. 2023 May 26;14(1):3032.
doi: 10.1038/s41467-023-38744-7.

Long term anti-SARS-CoV-2 antibody kinetics and correlate of protection against Omicron BA.1/BA.2 infection

Collaborators, Affiliations

Long term anti-SARS-CoV-2 antibody kinetics and correlate of protection against Omicron BA.1/BA.2 infection

Javier Perez-Saez et al. Nat Commun. .

Abstract

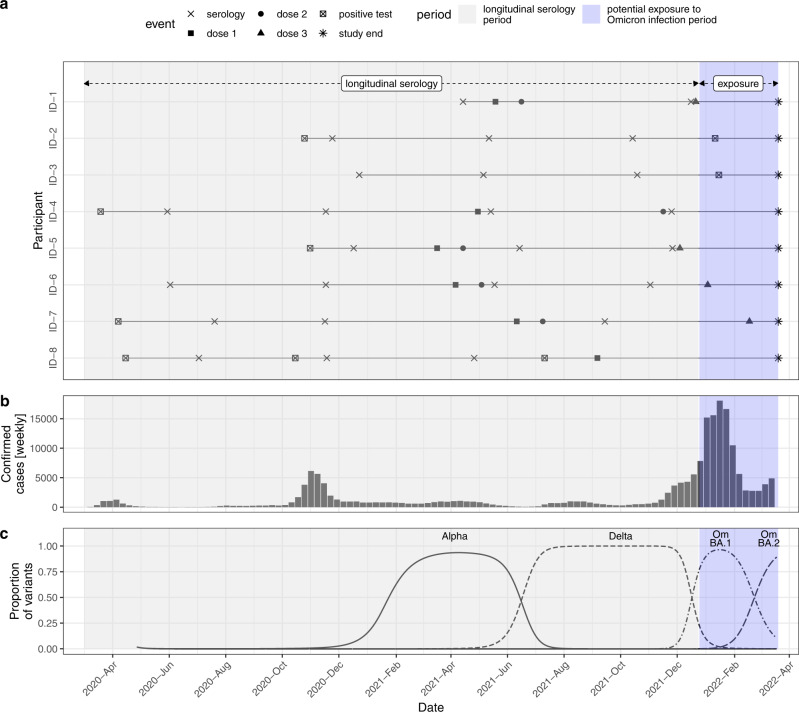
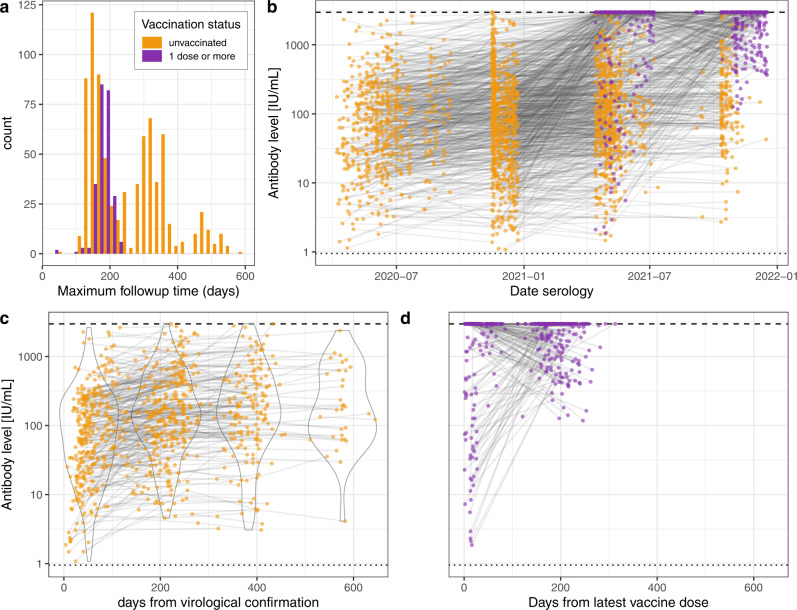
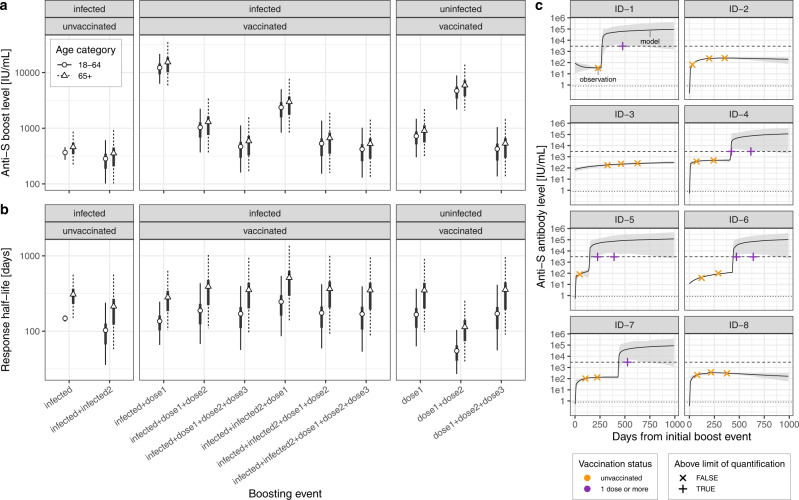
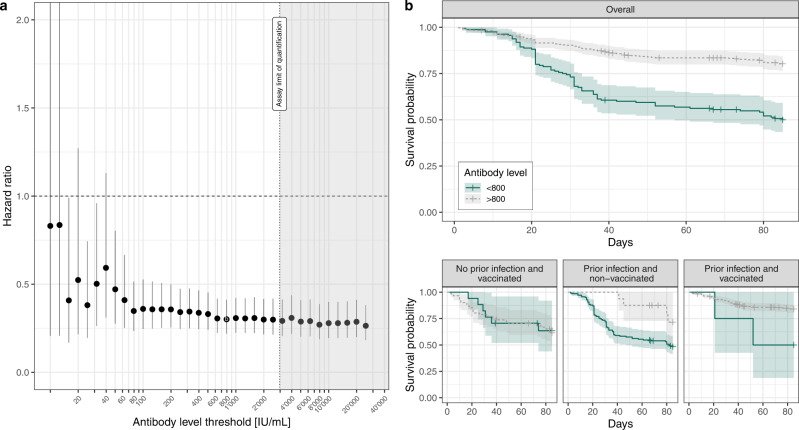
Binding antibody levels against SARS-CoV-2 have shown to be correlates of protection against infection with pre-Omicron lineages. This has been challenged by the emergence of immune-evasive variants, notably the Omicron sublineages, in an evolving immune landscape with high levels of cumulative incidence and vaccination coverage. This in turn limits the use of widely available commercial high-throughput methods to quantify binding antibodies as a tool to monitor protection at the population-level. Here we show that anti-Spike RBD antibody levels, as quantified by the immunoassay used in this study, are an indirect correlate of protection against Omicron BA.1/BA.2 for individuals previously infected by SARS-CoV-2. Leveraging repeated serological measurements between April 2020 and December 2021 on 1083 participants of a population-based cohort in Geneva, Switzerland, and using antibody kinetic modeling, we found up to a three-fold reduction in the hazard of having a documented positive SARS-CoV-2 infection during the Omicron BA.1/BA.2 wave for anti-S antibody levels above 800 IU/mL (HR 0.30, 95% CI 0.22-0.41). However, we did not detect a reduction in hazard among uninfected participants. These results provide reassuring insights into the continued interpretation of SARS-CoV-2 binding antibody measurements as an independent marker of protection at both the individual and population levels.


Conflict of interest statement

The authors declare no competing interests.

Figures

Fig. 1
Fig. 1. Study context.
a Study phases and eight examples of participant-level data. b Weekly confirmed SARS-CoV-2 cases in the state of Geneva (available from: https://infocovid.smc.unige.ch). c Proportion of SARS-CoV-2 variants in sequenced samples in Western Switzerland estimated through multinomial spline regression of publicly available weekly sequence data from the Covariants project (https://github.com/hodcroftlab/covariants/), following analysis from https://www.hug.ch/laboratoire-virologie/surveillance-variants-sars-cov-2-geneve-national (report May 2022). Source data are provided as a Source Data file.
Fig. 2
Fig. 2. Anti-S binding antibodies level trajectories.
a Follow-up time distribution (time from participant’s first to last serology) for samples collected prior (n = 778, yellow) and post (n = 246, purple) vaccination when at least two positive samples were available. Note that participants may have multiple samples prior and post vaccination and may therefore appear in both categories. b Trajectories for all participants (n = 1083) by serological sampling date and according to vaccination status. Colors as in panel (a). c Trajectories of pre-vaccination samples by time from virological confirmation when available (n = 442), along with violin plots of antibody levels in discrete arbitrary categories of time post confirmation (0–149, 150–249, 250–449, 450+ days). d Trajectories post-vaccination by time from latest dose (n = 246). Dashed and dotted lines in panels bd indicate the upper quantification limit (2500 U/mL, equivalent to 2960 IU/mL) and threshold for positivity (0.8 U/mL, equivalent to 0.95 IU/mL) of the test, respectively. Source data are provided as a Source Data file.
Fig. 3
Fig. 3. Antibody dynamics inference.
a Inferred mean antibody level boosts following infection and/or vaccination by age category and infection/vaccination history (dots: mean, thick lines: 50% CrI, thin dotted/dashed lines: 95% CrI from 5000 posterior draws). “Dose1/2/3” denotes the vaccine dose, and “infected1/2” denotes the infection (first or second infection). Note that the order of boosting events is not taken into account in the model and that boosting events are considered to be additive. b Inferred mean antibody level half-lives with symbols as in panel (a). c Example of serological measurements and modeled antibody trajectories for a random set of participants (ID-1 to ID-8). Measurements were available before and/or after vaccination (colors) and were either below or above the Roche Elecsys anti-S upper quantification limit of 2960 IU/mL. Modeled trajectories are given in terms of the mean (line) and 95% CrI (shaded area, from 5’000 posterior draws). Source data are provided as a Source Data file.
Fig. 4
Fig. 4. Omicron BA.1/BA.2 infection survival analysis.
a Cox hazard ratio estimates based on proportional hazard models accounting for age and prior infection status across antibody level thresholds (dots give the mean, error bars give the 95% CI, n = 967 participants with available data, see Methods and Supplementary Fig. S1 for details on participants selection). b Kaplan–Meier curves of the probability of non-infection by SARS-CoV-2 Omicron BA.1/BA.2 stratified by whether predicted antibody levels during the exposure period were above or below 800 IU/mL, shown for the overall analysis dataset, and stratified by infection and vaccination history (ribbons indicate the 95% CIs). The selected value of 800 IU/ml corresponds to the threshold with the lowest hazard ratio in estimates in panel a. Day 0 corresponds to December 25th, 2021, when Omicron BA.1 accounted for more than 80% of infections in the state of Geneva (Fig. 1c). For this 800 IU/mL threshold, the overall sample size was of N = 562 (flowchart in Supplementary Fig. S1), subdivided into N = 78 for “No prior infection and vaccinated”, N = 155 for “Prior infection and non-vaccinated”, and N = 329 for “Prior infection and vaccinated”. Source data are provided as a Source Data file.

References

    1. Bergeri, I. et al. Global SARS-CoV-2 seroprevalence from January 2020 to April 2022: A systematic review and meta-analysis of standardized population-based studies. Nat. Med.10.1371/journal.pmed.1004107 (2022). - PMC - PubMed
    1. Zaballa, M.-E. et al. Seroprevalence of anti-SARS-CoV-2 antibodies and cross-variant neutralization capacity after the Omicron BA.2 wave in Geneva, Switzerland: a population-based study. Lancet Reg. Health Eur.10.1016/j.lanepe.2022.100547 (2022). - PMC - PubMed
    1. Theel ES, et al. The role of antibody testing for SARS-CoV-2: is there one? J. Clin. Microbiol. 2020;58:e00797–20. doi: 10.1128/JCM.00797-20. - DOI - PMC - PubMed
    1. Earle KA, et al. Evidence for antibody as a protective correlate for COVID-19 vaccines. Vaccine. 2021;39:4423–4428. doi: 10.1016/j.vaccine.2021.05.063. - DOI - PMC - PubMed
    1. Gilbert PB, et al. Immune correlates analysis of the mRNA-1273 COVID-19 vaccine efficacy clinical trial. Science. 2022;375:43–50. doi: 10.1126/science.abm3425. - DOI - PMC - PubMed

Publication types