. 2023 May 25;14(1):3015.
doi: 10.1038/s41467-023-38694-0.

Detailed mapping of Bifidobacterium strain transmission from mother to infant via a dual culture-based and metagenomic approach

Affiliations

Detailed mapping of Bifidobacterium strain transmission from mother to infant via a dual culture-based and metagenomic approach

Conor Feehily et al. Nat Commun. .

Abstract

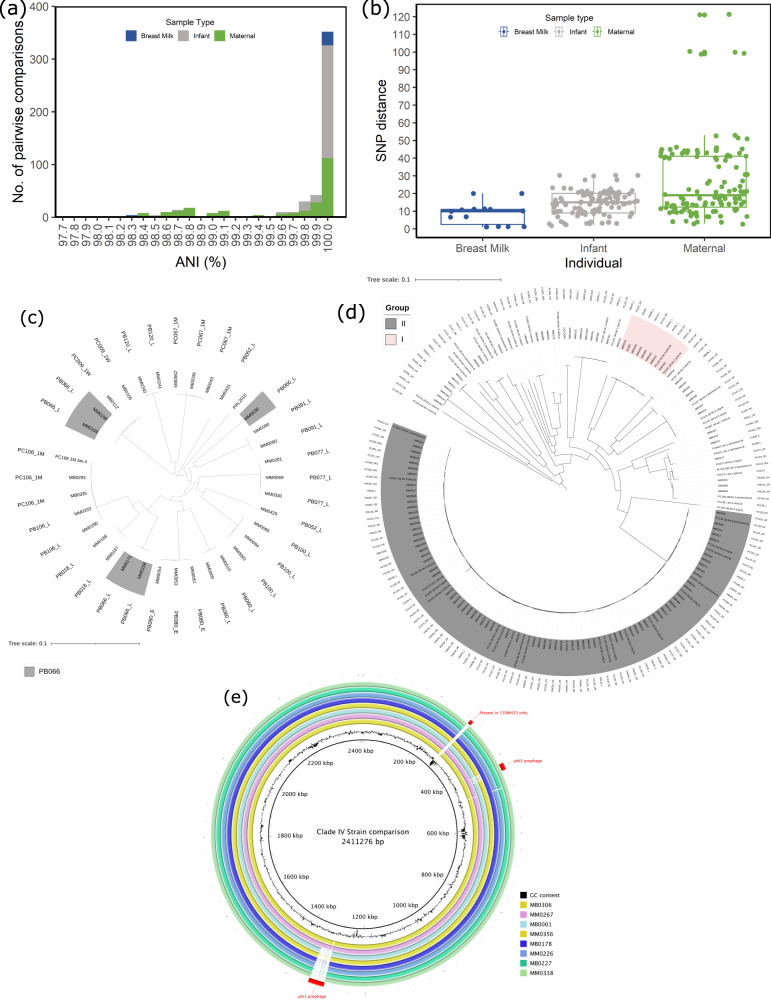
A significant proportion of the infant gut microbiome is considered to be acquired from the mother during and after birth. Thus begins a lifelong and dynamic relationship with microbes that has an enduring impact on host health. Based on a cohort of 135 mother-infant (F = 72, M = 63) dyads (MicrobeMom: ISRCTN53023014), we investigated the phenomenon of microbial strain transfer, with a particular emphasis on the use of a combined metagenomic-culture-based approach to determine the frequency of strain transfer involving members of the genus Bifidobacterium, including species/strains present at low relative abundance. From the isolation and genome sequencing of over 449 bifidobacterial strains, we validate and augment metagenomics-based evidence to reveal strain transfer in almost 50% of dyads. Factors important in strain transfer include vaginal birth, spontaneous rupture of amniotic membranes, and avoidance of intrapartum antibiotics. Importantly, we reveal that several transfer events are uniquely detected employing either cultivation or metagenomic sequencing, highlighting the requirement for a dual approach to obtain an in-depth insight into this transfer process.


Conflict of interest statement

D.G. is an employee of PrecisionBiotics Ltd (Novozyme Cork) who sponsored the clinical study. All other authors declare no competing interests.

Figures

Fig. 1
Fig. 1. Analysis of both the microbiota and cultured isolates in the study.
a Overview of samples analysed by shotgun metagenomics (top white) and bifidobacterial culture isolations (bottom grey). Maternal samples are represented to the left of “|” whilst infant samples are on the right. The timepoint of sampling is shown across the top [Created with BioRender.com]. b The prevalence and relative abundance of the total Bifidobacterium genus in maternal (n = 129, green) and infant (n = 119, grey) stool as determined by metagenomic sequencing is represented in the left plots. Stratification for the 4 most dominant Bifidobacterium species is adjacent. c Clustering of the microbiome of all sequenced samples (n = 1011) based on Bray-Curtis is shown by the dendrogram. Each block represents a different sampling timepoint as shown in the first coloured annotation bar. Further relevant covariates are annotated in subsequent colour bars. The alpha (Shannon) diversity of each sample is represented in the green dot plot. d Total number of culture-isolated and sequenced (n = 489) Bifidobacterium species isolated from breast milk, maternal, and infant stool. e Phylogenetic tree of all Bifidobacterium strains isolated in this study together with type strains for all bifidobacterial species. Each coloured clade highlights the different species isolated.
Fig. 2
Fig. 2. Limit of detection analysis.
a The percentage relative abundance of species for which either metagenomic assembled genomes (MAGs) or culture-isolated genomes were recovered for three sample types. Violin plots visualise the spread of data per sample extending to both the minimum and maximum value. Internal boxplots highlight the middle 50% of data with the median relative abundance shown in the central line. The whiskers extend to show the range of values. Significant differences in groups are annotated with asterisk (***p = 0.00046, ****p = 7.1 × 10−11) as determined by two-sided t-test. The x-axis is in log scale. b Venn diagram showing the number of Bifidobacterium species identified by either isolation or metagenomic sequencing, with the number of strains common to both method highlighted in the overlap region. c Linear regression models displaying the relationship between MAG recovery and sequencing read depth in metagenomic samples. Solid blue lines indicate the smoothed linear model line with shading visualising the confidence interval around the fit. Individual plots are grouped by sample type and a blue dotted vertical line indicates the minimum read depth required for each sample type in order to recover at least 1 MAG.
Fig. 3
Fig. 3. Intrasample strain diversity.
a Pairwise average nucleotide identity (ANI) between strains of the same species in a single sample of maternal stool, infant stool, and maternal breast milk. b Pairwise SNP distance between strains of the same species in an individual sample of maternal stool (n = 122), infant stool (n = 108), or maternal breast milk (n = 14) with an ANI ≥ 99.9%. Boxplots visualise the middle 50% of data with the median relative abundance shown in the central line. The whiskers extend to show the range of values excluding the outliers. c B. bifidum from individuals with multiple strains. Strains from PB066 34-week stool sample are highlighted. d Midpoint rooted phylogenetic tree of B. breve strains from this study. e Comparison of 8 complete B. breve genomes from group II.
Fig. 4
Fig. 4. Evidence for strain sharing between dyads.
a Genome coverage of metagenome data mapped to isolated genomes. Size of circle is relative to average number of mapped reads per genome. b SNP distance between maternal strain and corresponding infant strains isolated by either targeted (n = 9) or untargeted (n = 18) approaches. Boxplots highlight the middle 50% of data with the median relative abundance shown in the central line. The whiskers extend to show the range of values excluding outliers. c Upset plot showing how many strain transmission events were identified by each method and their overlap. Horizontal bars show the total number of transmission events detected by each method. Vertical bars show the number of transmission events detected by either one or more methods, as represented by multiple dots connected by a filled line. d Number of transmitted Bifidobacterium strains identified by each method.
Fig. 5
Fig. 5. Strains transferred and the factors affecting this transfer.
a Heatmap summary of all species found to transfer from mother to infant and their distribution within each of 5 covariate categories. The total number of sharing events for a given species is represented by the bar plot to the right of the heatmap. Infant male/female split is 62/70, respectively. b Each barplot panel represents a different covariate that was significantly associated with sharing of microbes between related mothers and infants. Significant differences between groups were determined using two-sided, Chi-square test with no correction. Infant male/female split is 62/70, respectively. c Each barplot panel represents the species whose strain transfer was significantly associated with the given covariate. Significant differences between groups were determined using two-sided, Chi-square test with no correction.

References

    1. Cho I, Blaser MJ. The human microbiome: at the interface of health and disease. Nat. Rev. Genet. 2012;13:260–270. doi: 10.1038/nrg3182. - DOI - PMC - PubMed
    1. De Muinck EJ, Trosvik P. Individuality and convergence of the infant gut microbiota during the first year of life. Nat. Commun. 2018;9:1–8. doi: 10.1038/s41467-018-04641-7. - DOI - PMC - PubMed
    1. Coker, M. O. & Madan, J. C. The microbiome and immune system development. In The Developing Microbiome (INC, 2020). 10.1016/b978-0-12-820602-7.00003-9.
    1. Lee MJ, et al. Perturbations of gut microbiome genes in infants with atopic dermatitis according to feeding type. J. Allergy Clin. Immunol. 2018;141:1310–1319. doi: 10.1016/j.jaci.2017.11.045. - DOI - PubMed
    1. Zimmermann P, Messina N, Mohn WW, Finlay BB, Curtis N. Association between the intestinal microbiota and allergic sensitization, eczema, and asthma: A systematic review. J. Allergy Clin. Immunol. 2019;143:467–485. doi: 10.1016/j.jaci.2018.09.025. - DOI - PubMed

Publication types