. 2023 May 25;14(1):3020.
doi: 10.1038/s41467-023-38591-6.

Wound infiltrating adipocytes are not myofibroblasts

Affiliations

Wound infiltrating adipocytes are not myofibroblasts

Shruthi Kalgudde Gopal et al. Nat Commun. .

Abstract

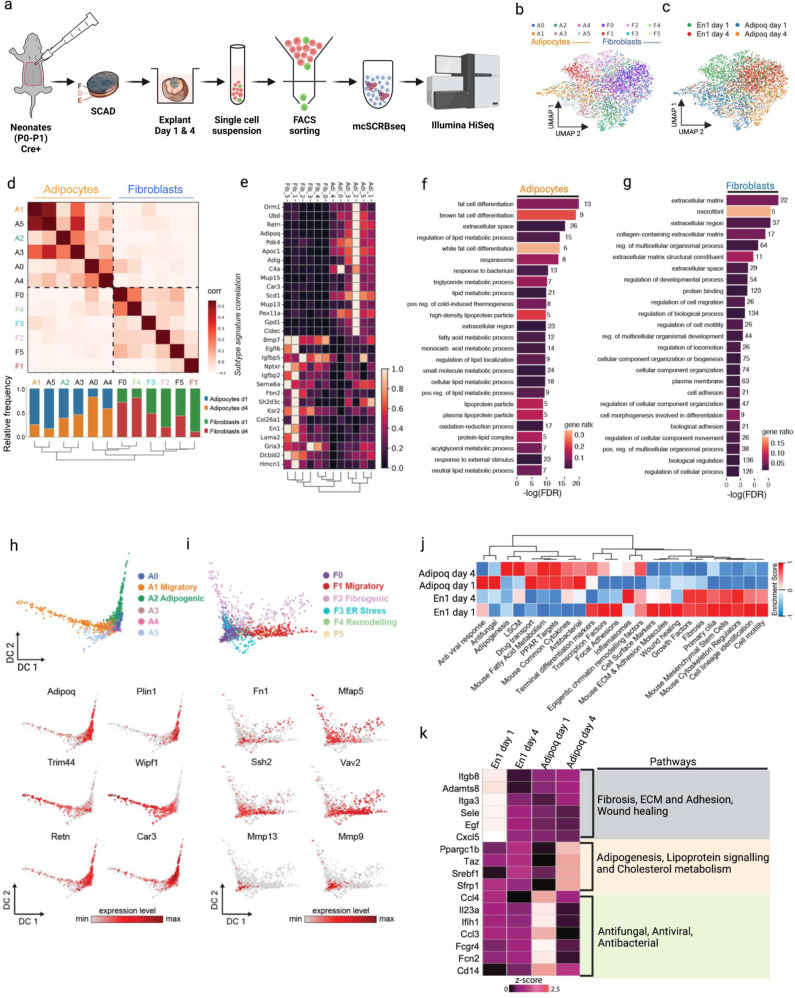
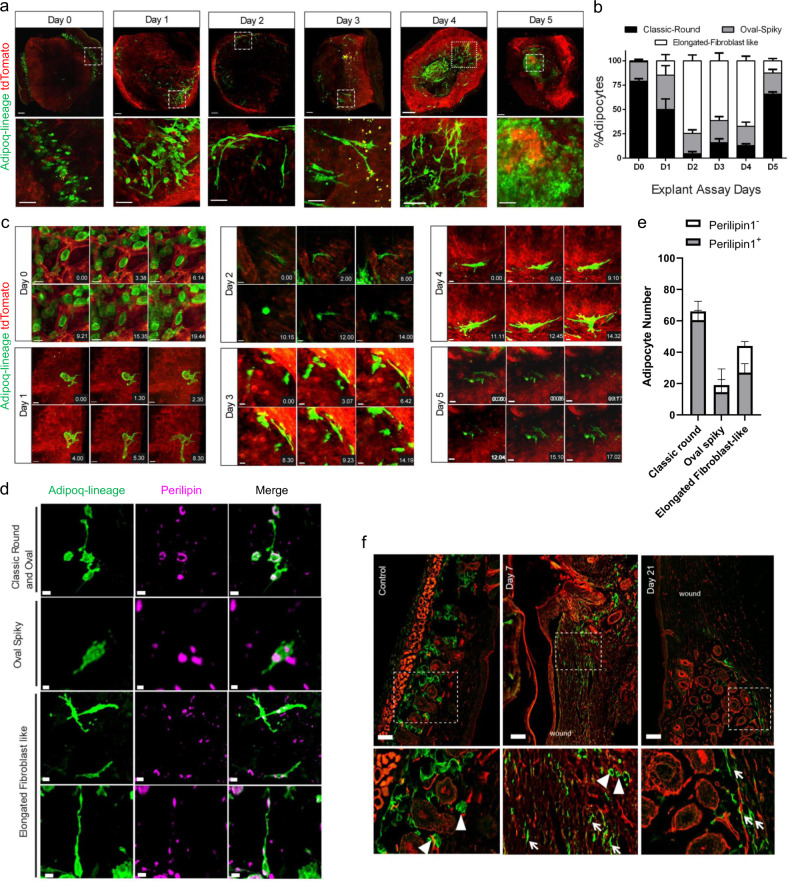
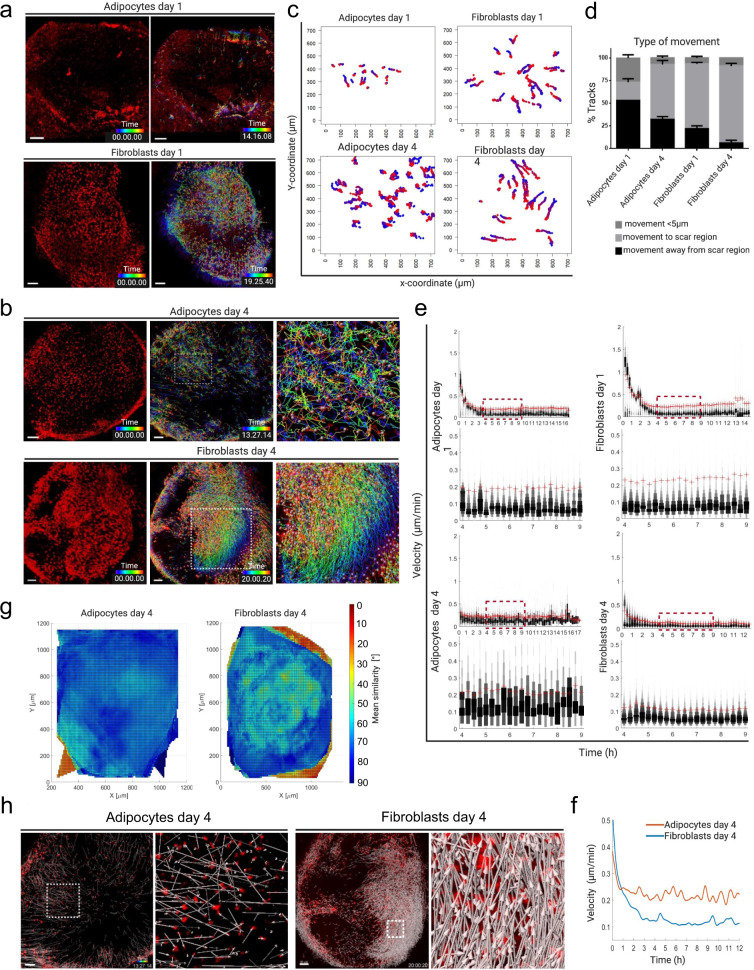
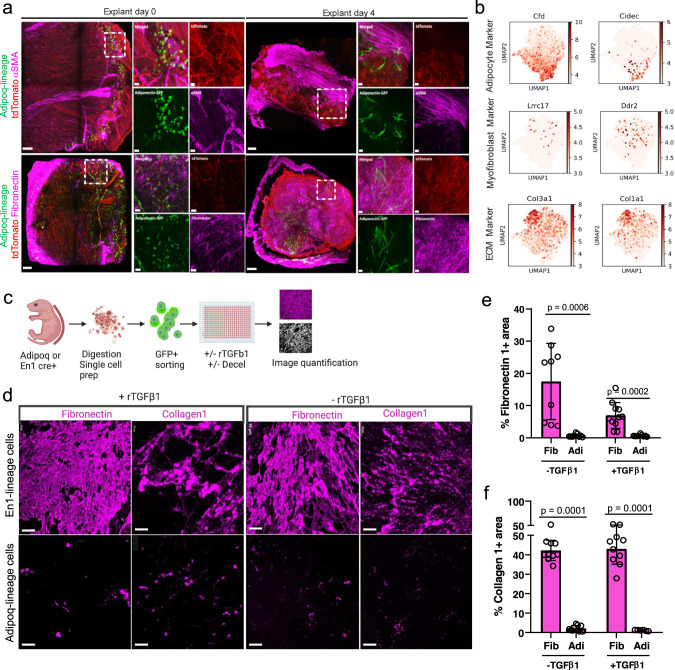
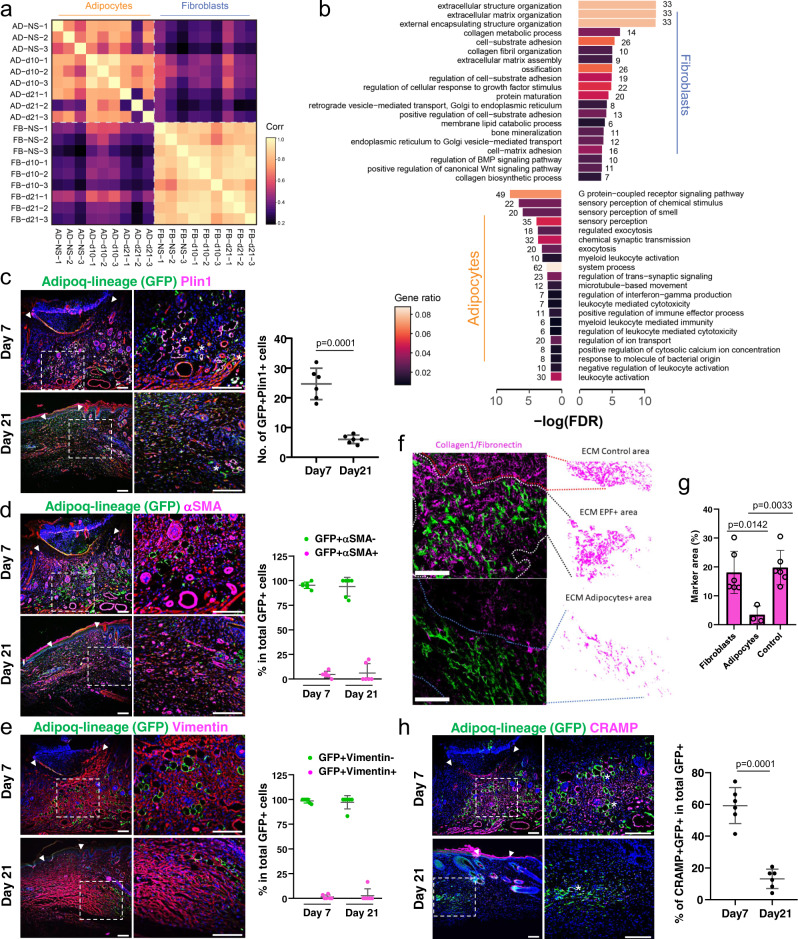
The origins of wound myofibroblasts and scar tissue remains unclear, but it is assumed to involve conversion of adipocytes into myofibroblasts. Here, we directly explore the potential plasticity of adipocytes and fibroblasts after skin injury. Using genetic lineage tracing and live imaging in explants and in wounded animals, we observe that injury induces a transient migratory state in adipocytes with vastly distinct cell migration patterns and behaviours from fibroblasts. Furthermore, migratory adipocytes, do not contribute to scar formation and remain non-fibrogenic in vitro, in vivo and upon transplantation into wounds in animals. Using single-cell and bulk transcriptomics we confirm that wound adipocytes do not convert into fibrogenic myofibroblasts. In summary, the injury-induced migratory adipocytes remain lineage-restricted and do not converge or reprogram into a fibrosing phenotype. These findings broadly impact basic and translational strategies in the regenerative medicine field, including clinical interventions for wound repair, diabetes, and fibrotic pathologies.


Conflict of interest statement

The authors declare no competing interests.

Figures

Fig. 1
Fig. 1. Adipocyte and fibroblast lineages retain their identities in skin explant model.
a Schematic workflow of ex vivo whole-skin explant assay and molecular crowding single cell RNA barcoding and sequencing (mcSCRBseq). The skin explants from neonatal AdipoqCre;R26mTmG or En1Cre;R26mTmG skin were cultured in 96-well plate with fascia side face up. The GFP+ cells were FACS sorted from explants that were collected 1 day or 4 days after culture for single cell sequencing. F, fascia; D, dermis; E, epidermis. b Dimension-reduced single cell transcriptomic data is visualized through Uniform Manifold Approximation and Projection (UMAP), coloured by Louvain cluster and c time point of extraction. d Similarities of marker gene signatures for the 12 cell states (6 states per lineage) along with relative frequency of each cell state per time point. Colour indicates Pearson correlation coefficients for each pairwise comparison across transcriptional cell states in adipocyte and fibroblast lineages. e The heatmap shows relative expression of the indicated genes across cell states and lineages. f Gene set enrichment results in an adipocyte core signature gene list (88 genes). g Gene set enrichment results in a fibroblast core signature gene list (198 genes). h Diffusion maps show adipocyte cell states and the gene expression levels of the indicated genes. i Diffusion maps show fibroblast cell states and gene expression levels of the indicated genes. j Pathway focused gene expression analysis of adipocytes and fibroblasts at day 1 and day 4. k Expression of feature genes of listed pathway in adipocytes and fibroblasts at day 1 and day 4. Z score of individual gene was normalization read counts across samples.
Fig. 2
Fig. 2. Spatio-temporal characterization of migratory adipocytes.
a Morphological changes of adiponectin-lineage positive cells (GFP) in skin explants from AdipoqCre;R26mTmG neonates in culture from Day 0 to Day 5 at low (upper panel, scale bar 200 µm) and high (lower panel, scale bar 50 µm) magnification. b Quantification of adipocyte morphologies throughout 5-day explant assay, n = 3 explants per timepoint, mean ± SD. c Morphology dynamics of adipocytes. Snapshots of single representative cells from Day 0 to Day 5 showing transition from characteristic mature round to migratory states of adipocytes. Time format-hour.min. Scale bar: 20 microns. d Three migratory morphologies of adipocytes are positive for Perilipin1 by immuno-labelling. Scale bar: Classic round 20 µm, Oval spliky:10 µm and Elongated fibroblast-like morphologies: upper panel 20 µm, lower panel 30 µm. This experiment was repeated three times independently with similar results. e Quantification of Perilipin1-positive and -negative cells in explants, n = 3 biological repeats, mean ± SD. f Adipocytes superficially resemble fibroblasts after wounding in live mice: Control back skin of AdipoqCre;R26mTmG mice, GFP+ adipocytes are round, located around hair follicles. Following the wound healing experiment at day 7, Adipoq-lineage (GFP) cells seen at the wound periphery have a fibroblast-like elongated morphology. At day 21 after injury, activated adipocytes still have a fibroblastic shape as the skin tissue is undergoing remodelling. Arrowheads indicate round adipocytes, and arrows indicate elongated, activated fibroblast-like cells. Scale bars: 50 µm. This experiment was repeated three times independently with similar results.
Fig. 3
Fig. 3. Distinct adipocyte and fibroblast migrations.
3D whole mount time-lapse imaging snapshots of single-cell tracks skin explants generated from Adipoqcre or En1Cre crossed to R26LSL-H2B-mCherry reporter mice. a Snapshots of adipocyte- and fibroblast-migration tracks on day 1. b Adipocyte and fibroblast tracks on day 4, generated by automated cell tracking using Imaris version 9.2. (Bitplane). c Manual tracks of adipocytes and fibroblasts in the scar region of explants at day 1 and day 4; the plot shows the difference in migration distance and type of movement in the scar region of both adipocytes and fibroblasts. N = 2 videos per time point. Scar regions were cropped (700 µm X 700 µm) from whole explant and cells manually tracked. Blue indicates starting time and red is the end-point. d 3 main types of movement quantified using manually annotated single cell tracks present in c, n = 3 biological repeats, mean ± SD. e Velocity of migratory adipocytes and fibroblasts is calculated using time-lapse videos and automated single cell tracks. Velocity variation and amplitude difference from time point 4 −9 hours across all samples are shown in higher magnification (lower panel). The red crosses (+) indicate the mean velocities of the indicated time points. f Spline graph of day 4 showing differences of mean velocity between adipocytes and fibroblasts. g Neighbour similarity analysis of day 4 explants using automated single-cell tracks generated from 3D time lapse videos. The colour bar represents the movement angles 0° (red, coordinated movement) to 90° (blue, random movement). Fibroblast migrations are coordinated and collective, whereas adipocyte migrations are random and individual. h Directed and non-directed movement of fibroblasts and adipocytes respectively at day 4. Scale bars:100 µm.
Fig. 4
Fig. 4. Adipocytes are non-fibrogenic in ex vivo models.
a Immunostainings of AdipoqCre;R26mTmG explants at day 0 and day 4. Adiponectin-lineage cells in green, fibroblasts in red, and marker gene αSMA (top) and Fibronectin 1 (bottom) expression in magenta. Merged channel image of the whole explant (left), magnified area of individual channels (right). Scale bars: 100 µm in low magnification images, 20 µm in high magnification images. This experiment was repeated three times independently with similar results. b Feature plots generated from combined analysis of mcSCRBseq showing adipocyte, myofibroblast, and extracellular matrix-specific enrichment in cell type-specific clusters. c-f Adipocyte-lineage cells deposit marginal matrix proteins than fibroblasts under scarring conditions. c Schematic of in vitro matrix deposition assay and quantification using Image J. d FACS-sorted adipocytes, and fibroblasts were cultured in vitro, with and without rTGFβ1 stimulation for 72hrs, followed by decellularization and immunolabelling of deposited matrix Collagen 1 and Fibronectin 1. Scale bars: 50 µm. e,f Quantification of percent fluorescence of deposited matrix showing higher percentage of deposited matrix when compared to adipocytes, n = 3 biological replicates and 4 images of each replicate, Mean ± SD, Two-way ANOVA with 95% CI.
Fig. 5
Fig. 5. Adipocytes are non-fibrogenic in wounds.
mRNA-seq was performed with FACS sorted adipocytes and fibroblasts from day 7 and 21 wounds and adjacent skin of AdipoqCre;R26mTmG and En1Cre;R26mTmG mice, respectively. Each cell type at each time point includes three independent biological replicates. a. Pearson correlation analysis of all 18 samples. Colour in each cells represented Pearson correlation coefficients for every pairwise comparison. b GO term enrichment based on DEGs of adipocytes and fibroblasts from day 10 wounds. Filled colour represented number of genes enriched relative to all DEGs. Cryosections of day 7 and day 21 wounds from AdipoqCre;R26mTmG mice were subjected for immunofluorescence staining. c Representative images and quantification of Perilipin (magenta) in GFP positive cells. Data are numbers of GFP+Perilipin+ cells per high magnification field, n = 6 independent samples, mean ± SD, unpaired two-tailed t-test. d Representative images and quantification of αSMA (magenta) in GFP positive cells. The migratory elongated and rounded adipocytes are negative for αSMA. At day 7 there is widespread αSMA staining in the centre of the wound, whereas only physiological αSMA is found in the hair follicle dermal sheath at day 21. Data are percentage of αSMA+GFP+ cells and αSMA-GFP+ cells in total GFP+ cells, n = 6 independent samples, mean ± SD. e Representative images and quantification of vimentin (magenta) in GFP positive cells. Data are percentage of Vimentin+GFP+ cells and Vimentin-GFP+ cells in total GFP+ cells, n = 6 independent samples, mean ± SD. f Transplantation of FACS-sorted adipocytes or fibroblasts from P1 new born mice into adult Rag2-/- immunodeficient mouse back skin into an excisional wound model. Immunolabelling with anti-Collagen1 or anti-Fibronectin 1 and quantification of associated extracellular matrix in the transplanted regions. g Quantification of adipocyte- and fibroblast-associated ECM in the transplanted regions. n = 3 independent adipocyte samples, n = 6 independent fibroblast or control samples, mean ± SD, unpaired two-tailed t-test. h Representative images and quantification of cathelicidin-related antimicrobial peptide (CRAMP) in GFP positive cells. Data are percentage of CRAMP+GFP+ cells in total GFP+ cells, n = 6 independent samples, mean ± SD, unpaired two-tailed t-test. Arrow heads indicate the wound borders, the stars indicate the examples of double positive staining. Scale bars: c-f, h = 100 µm.

References

    1. Spickard EA, Joshi PM, Rothman JH. The multipotency-to-commitment transition in Caenorhabditis elegans-implications for reprogramming from cells to organs. FEBS Lett. 2018;592:838–851. doi: 10.1002/1873-3468.12977. - DOI - PMC - PubMed
    1. Merrell AJ, Stanger BZ. Adult cell plasticity in vivo: de-differentiation and transdifferentiation are back in style. Nat. Rev. Mol. Cell Biol. 2016;17:413–425. doi: 10.1038/nrm.2016.24. - DOI - PMC - PubMed
    1. Desai VD, Hsia HC, Schwarzbauer JE. Reversible modulation of myofibroblast differentiation in adipose-derived mesenchymal stem cells. PLoS ONE. 2014;9:e86865. doi: 10.1371/journal.pone.0086865. - DOI - PMC - PubMed
    1. Giordano A, et al. Mammary alveolar epithelial cells convert to brown adipocytes in post-lactating mice. J. Cell Physiol. 2017;232:2923–2928. doi: 10.1002/jcp.25858. - DOI - PMC - PubMed
    1. Guerrero-Juarez CF, et al. Single-cell analysis reveals fibroblast heterogeneity and myeloid-derived adipocyte progenitors in murine skin wounds. Nat. Commun. 2019;10:650. doi: 10.1038/s41467-018-08247-x. - DOI - PMC - PubMed

Publication types