. 2023 May 25;14(1):3025.
doi: 10.1038/s41467-023-38780-3.

Establishment of gastrointestinal assembloids to study the interplay between epithelial crypts and their mesenchymal niche

Affiliations

Establishment of gastrointestinal assembloids to study the interplay between epithelial crypts and their mesenchymal niche

Manqiang Lin et al. Nat Commun. .

Abstract

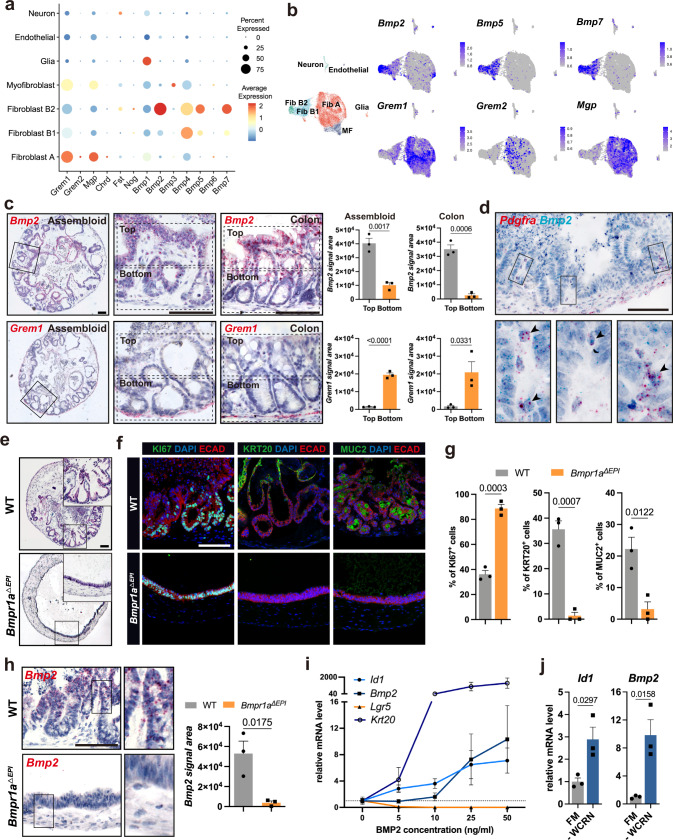
The cellular organization of gastrointestinal crypts is orchestrated by different cells of the stromal niche but available in vitro models fail to fully recapitulate the interplay between epithelium and stroma. Here, we establish a colon assembloid system comprising the epithelium and diverse stromal cell subtypes. These assembloids recapitulate the development of mature crypts resembling in vivo cellular diversity and organization, including maintenance of a stem/progenitor cell compartment in the base and their maturation into secretory/absorptive cell types. This process is supported by self-organizing stromal cells around the crypts that resemble in vivo organization, with cell types that support stem cell turnover adjacent to the stem cell compartment. Assembloids that lack BMP receptors either in epithelial or stromal cells fail to undergo proper crypt formation. Our data highlight the crucial role of bidirectional signaling between epithelium and stroma, with BMP as a central determinant of compartmentalization along the crypt axis.


Conflict of interest statement

The authors declare no competing interests.

Figures

Fig. 1
Fig. 1. Establishment of colon assembloids modeling colonic crypt formation.
a Schematic of colon assembloid generation (the schematic was created using Adobe Illustrator 26.3.1). b Immunofluorescence image of colon assembloids stained for E-cadherin (ECAD) and DAPI. Scale bar: 100 µm. c Confocal microscopy images of whole-mount staining of assembloids cultured in medium without sWnt, R-spondin 1, CHIR99021, or noggin (-WCRN) for 1–4 days. Epithelium was derived from tg Act-DsRed mice; stroma was derived from tg Act-CFP mice. Scale bar: 100 µm. d Hematoxylin and eosin (H&E) stained images of assembloids cultured in -WCRN medium for 1–4 days. Scale bar: 100 µm. e Confocal microscopy images of whole-mount staining for assembloids derived from Axin2CreERT2/Rosa26-tdTomato mice, cultured in -WCRN medium for 1–4 days, showing AXIN2 lineage tracing for 24 h. Scale bar: 100 µm. f, g Immunofluorescence images and quantification of colon assembloids cultured in -WCRN medium for 1–4 days stained for active YAP1 (n = 3 biological replicates per group). Scale bar: 100 µm. Data are presented as mean ± SEM. h Immunofluorescence images of colon assembloids and colon tissue labeled with markers for proliferative cells (KI67), colonocytes (KRT20), goblet cells (MUC2), and enteroendocrine cells (SYP). Scale bars: 100 µm (high magnification: 5 µm). i Dot plot showing expression of known marker genes against detected epithelial cell clusters identified by scRNA-seq in colon assembloids, tissue, and organoids. Circle size represents the within-cluster probability of gene detection. Fill color represents the normalized average expression level. EEC enteroendocrine cell, GC goblet cell, CC colonocyte, TA transit-amplifying cell, SC stem cell. scRNA-seq data are from two biological replicates per group. Images are representative of at least three biological replicates. Source data are provided as a Source Data file.
Fig. 2
Fig. 2. Stromal cellular complexity of colon assembloids.
a Immunofluorescence images of day 4 colon assembloids and tissue stained for endothelial cells (CD31) and neuronal cells (TUBB3). b Immunofluorescence images of day 4 colon assembloids and tissue stained for fibroblast (VIM) and myofibroblast (αSMA) markers. c UMAP plot of scRNA-seq dataset from colon assembloid stromal cells. d Dot plot showing expression of known marker genes against detected stromal clusters in colon assembloids identified by scRNA-seq. Circle size represents the within-cluster probability of gene detection. Fill color represents the normalized average expression level. e UMAP expression plots of telocyte marker genes (Foxl1, Wnt5a, and Sox6) and trophocyte marker genes (Cd34, Cd81, and Rspo3) in the assembloid dataset. Cells colored by normalized expression of indicated marker genes. f Single-molecule in situ hybridization (sm-ISH) showing localization of Foxl1 and Rspo3 in assembloids and colon tissue. Scale bars: 100 µm. scRNA-seq data are from two biological replicates per group. Images are representative of at least three biological replicates.
Fig. 3
Fig. 3. BMP gradient in colon assembloids and its effect on colonic crypt formation.
a Dot plot showing expression of BMP signaling molecules in the identified stromal cell clusters from assembloids. b UMAP expression plots of BMP ligand genes (Bmp2, Bmp5, and Bmp7) and BMP antagonist genes (Grem1, Grem2, and Mgp) for stromal cells in assembloids. c Single-molecule in situ hybridization (sm-ISH) using serial sections showing localization of Bmp2 and Grem1 in assembloids and colon tissue; quantification for Bmp2 and Grem1 signal area divided into top and bottom in the crypt (n = 3 biological replicates per group). d Duplex sm-ISH showing co-localization of Pdgfra and Bmp2 in assembloids. e Hematoxylin and eosin (H&E) staining of an assembloid derived from a wild-type mouse (WT) and an assembloid comprised of epithelial cells from an Axin2CreErt2/Bmpr1afl/fl mouse and WT mesenchymal cells from a WT mouse (Bmpr1aΔEPI). f, g) Immunofluorescence images and quantification of WT and Bmpr1aΔEPI assembloids stained for KI67, KRT20, and MUC2 (n = 3 biological replicates per group). h sm-ISH images and quantification of Bmp2 expression in WT and Bmpr1aΔEPI assembloids (n = 3 biological replicates per group). i qPCR for expression of the stem cell marker Lgr5, the colonocyte marker Krt20, the BMP ligand Bmp2, and the BMP target Id1 from organoids cultured with different concentrations of BMP2 (n = 3 biological replicates per group). j qPCR for expression of Id1 and Bmp2 from organoids cultured in full medium (FM) or in medium without sWnt, R-spondin 1, CHIR99021, or noggin (-WCRN) (n = 3 biological replicates per group). Scale bars: 100 µm. Data are presented as mean ± SEM. Statistical analyses were performed using Student’s t-test (two-tailed) for (c, g, h), and (j). Fib Fibroblast, MF Myofibroblast. scRNA-seq data are from two biological replicates per group. Images are representative of at least three biological replicates. Source data are provided as a Source Data file.
Fig. 4
Fig. 4. BMP signaling promotes functional transition of stromal cells.
a Hematoxylin and eosin (H&E) staining of a WT assembloid and an assembloid comprising Bmpr1a KO mesenchymal cells derived from a Bmpr1afl/fl mouse and WT epithelial cells from a WT mouse (Bmpr1aΔMES). b, c Immunofluorescence images and quantification of WT and Bmpr1aΔMES assembloids stained for KI67, KRT20, and MUC2 (n = 3 biological replicates per group). d sm-ISH images and quantification of Foxl1 and Grem1 expression in WT and Bmpr1aΔEPI assembloids (n = 3 biological replicates per group). e sm-ISH images and quantification of Foxl1 and Grem1 expression in WT and Bmpr1aΔMES assembloids (n = 3 biological replicates per group). f sm-ISH images and quantification of Bmp2 expression in WT and Bmpr1aΔMES assembloids (n = 3 biological replicates per group). g qPCR for expression of Id1, telocyte marker genes (Bmp2, Foxl1, and Wnt5a), and trophocyte marker genes (Cd34 and Grem1) of primary murine colon stromal cells cultured in normal medium, or treated with 50 ng/ml BMP2, 500 ng/ml GREM1, or 50 ng/ml BMP2 and 500 ng/ml GREM1 (n = 3 biological replicates per group). h Flow cytometry analysis of EpCAM- CD45- CD31- CD34+ cell fractions in primary murine colon stromal cells cultured in normal medium or treated with 50 ng/ml BMP2. i qPCR for expression of telocyte and trophocyte marker genes in EpCAM CD45 CD31 CD34+ primary murine colon stromal cells exposed to the indicated BMP2 concentrations (n = 3 biological replicates per group). j qPCR for expression of additional telocyte and trophocyte marker genes of EpCAM CD45 CD31 CD34+ primary murine colon stromal cells exposed to 250 ng/ml BMP2 (n = 4 biological replicates per group). Scale bars: 100 µm. Data are presented as mean ± SEM. Statistical analyses were performed using Student’s t test (two-tailed) for (cf) and (j); using one-way ANOVA, followed by Tukey’s multiple comparisons test for (g). Images are representative of at least three biological replicates. Source data are provided as a Source Data file.
Fig. 5
Fig. 5. Establishment of colon tumor assembloids.
a Hematoxylin and eosin (H&E) staining of a colon tumor assembloid and colon tumor tissue derived from the AOM/DSS mouse model. b Immunofluorescence images of a tumor assembloid and tumor tissue stained for KI67, KRT20, and MUC2. c Immunofluorescence images of a tumor assembloid and tumor tissue stained for active YAP1. Scale bar: 100 µm. Images are representative of at least three biological replicates.

References

    1. Parikh K, et al. Colonic epithelial cell diversity in health and inflammatory bowel disease. Nature. 2019;567:49–55. doi: 10.1038/s41586-019-0992-y. - DOI - PubMed
    1. Kinchen J, et al. Structural remodeling of the human colonic mesenchyme in inflammatory bowel disease. Cell. 2018;175:372–386.e317. doi: 10.1016/j.cell.2018.08.067. - DOI - PMC - PubMed
    1. Harnack C, et al. R-spondin 3 promotes stem cell recovery and epithelial regeneration in the colon. Nat. Commun. 2019;10:4368. doi: 10.1038/s41467-019-12349-5. - DOI - PMC - PubMed
    1. McCarthy N, Kraiczy J, Shivdasani RA. Cellular and molecular architecture of the intestinal stem cell niche. Nat. Cell Biol. 2020;22:1033–1041. doi: 10.1038/s41556-020-0567-z. - DOI - PubMed
    1. Rafii S, Butler JM, Ding BS. Angiocrine functions of organ-specific endothelial cells. Nature. 2016;529:316–325. doi: 10.1038/nature17040. - DOI - PMC - PubMed

Publication types