. 2023 May 25;13(1):8501.
doi: 10.1038/s41598-023-35327-w.

Prediction and experimental evidence of different growth phases of the Podospora anserina hyphal network

Affiliations

Prediction and experimental evidence of different growth phases of the Podospora anserina hyphal network

Clara Ledoux et al. Sci Rep. .

Abstract

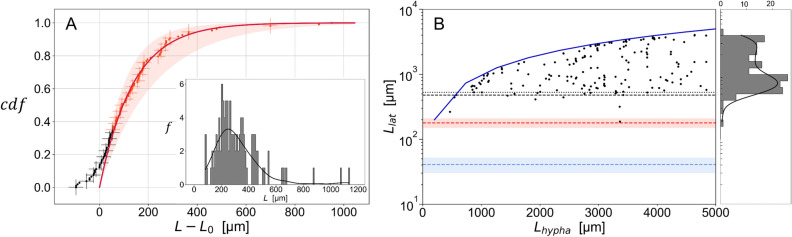
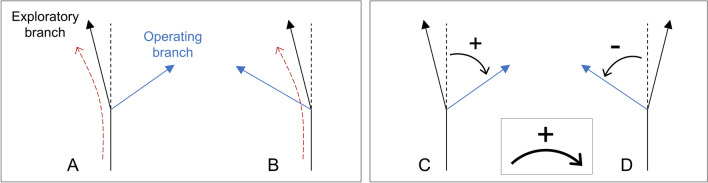
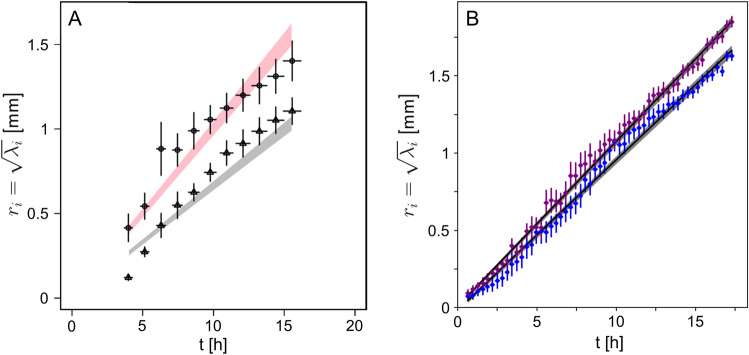
Under ideal conditions, the growth of the mycelial network of a filamentous fungus is monotonous, showing an ever increasing complexity with time. The components of the network growth are very simple and based on two mechanisms: the elongation of each hypha, and their multiplication by successive branching. These two mechanisms are sufficient to produce a complex network, and could be localized only at the tips of hyphae. However, branching can be of two types, apical or lateral, depending on its location on the hyphae, therefore imposing the redistribution of the necessary material in the whole mycelium. From an evolutionary point of view, maintaining different branching processes, with additional energy needs for structure and metabolism, is intriguing. We propose in this work to discuss the advantages of each branching type using a new observable for the network growth, allowing us to compare growth configurations. For this purpose, we build on experimental observations of the Podospora anserina mycelium growth, enabling us to feed and constrain a lattice-free modeling of this network based on a binary tree. First, we report the set of statistics related to the branches of P. anserina that we have implemented into the model. Then, we build the density observable, allowing us to discuss the succession of growth phases. We predict that density over time is not monotonic, but shows a decay growth phase, clearly separated from an other one by a stationary phase. The time of appearance of this stable region appears to be driven solely by the growth rate. Finally, we show that density is an appropriate observable to differentiate growth stress.


Conflict of interest statement

The authors declare no competing interests.

Figures

Figure 1
Figure 1
(A) Cumulative law of the distribution (in inset, bins 10 μm) of N=109 lengths between two consecutive apical vertices V3. The transition from black to red markers is defined by the maximum slope, found at 230±5μm from the apex. The solid red line is an exponential fit of the data shown in red with 1-2-α(L-L0). The data were manually shifted by L0=180 μm. Using a diagonal covariance matrix, the exponential fit parameters were found to α=(10.4±3.9)×10-3μm-1, R2=0.99. We made use of R squared R2=1-SSrSSt, with SSr the residual sum of squares and SSt the total sum of squares to discuss the quality of the fit. The red area corresponds to one standard deviation. (B) Lengths Llat between the apex and a lateral vertex V3, measured when the branch appears in function of Lhypha, the length of the hypha when the branch appears. The dark blue solid line corresponds to Llat=Lhypha. 95% (resp. 90%) of the data points are above the black dashed line at 480 μm (resp. black dotted line at 530 μm). The red dashed line corresponds to the apical dominance (L0=180 μm), as defined in A. The blue dashed line and area correspond to the mean and standard deviation of the distribution (not shown) of Lapi=41±11μm, defined as the length between the apex and the apical branch at the time of branching (see text for details).
Figure 2
Figure 2
The main figure shows the spatial ΔL and temporal Δt distance between two successive lateral branching, taken in chronological order, for N=156 branching events, from experiment on M2 culture medium (M21, see text for details). The solid black lines represent the kernel density estimate associated with the ΔL and Δt distributions.
Figure 3
Figure 3
Symmetry of local (A,B) and global (C,D) branching. (A,B) Direction of subapical and lateral branching compared to the local curvature of the hypha (subapical branching is shown). A is in the opposite direction, B is in the same direction. We found 82% and 72% for subapical and lateral branchings respectively corresponding to configuration A. (C,D) Clockwise (C) and counterclockwise (D) direction of the subapical (large angle apical branching) and lateral branching. We found 54% and 56% for subapical and lateral branching respectively corresponding to configuration C. All collections are composed of 198 samples. The error is 5% in all configurations.
Figure 4
Figure 4
(A) Thallus of P. anserina reconstructed from 3×4 tiles, extracted from experiment previously discussed in at t=15 h after the ascospore germination. (B) Simulation of the growth of P. anserina after the same duration of growth, the simulation time being scaled on experimental time.
Figure 5
Figure 5
Roots of the eigenvalues r1=λ1 and r2=λ2 of the apexes (V1) cloud distribution—see Eq. (1)—as a function of growth time. (A) Corresponds to the modelling of the growth, points correspond to the output data of simulation, shaded area are the theoretical function ri=Bit. (B) Corresponds to experimental data, obtained from experiment M21, see text for details. The grey area shows one standard deviation for both fits. Corresponding slopes Bi are 0.098±0.002, 0.107±0.002 mm h-1 with R2>0.99. In this last case the data have been manually shifted by t0=1h±10 min. Corresponding sphericity 2λ2/(λ1+λ2), with λ1λ2, is found to be constant at 0.88±0.02.
Figure 6
Figure 6
(A) Density versus time for output data of simulation (points) and theoretical function ρ(t)=D2ωtt2 with adjusted parameters (grey area for one standard deviation). (B) same as (A) but with many lateral branches and big angle for operating branch. (C) same as (A) but without lateral branches and small angle for exploratory branch.
Figure 7
Figure 7
Experimental density in function of time. Culture media are respectively M21 (A) and M01 (B). Points are density computed at each time step, black solid line is density ρ computed from expected laws of apexes number A and surface S growth. Grey area shows one standard deviation error. Solid red and blue lines are fit based on βt-α. Red and blue areas show one standard deviation. Respectively for M2 and M0 culture media, α were found to 2.1±0.3 and 1.6±0.3 with R2=0.96 and 0.95. With α=2 (not shown) we found R2=0.96 and 0.76.
Figure 8
Figure 8
Number of apexes as a function of time for the three replicates on M2 medium (A) and M0 medium (B) respectively. Only the initial period of growth is shown, defined up to the average time tmin for the three replicats on M0 medium. (C) Respective velocities of the six initial hyphae. Dashed line corresponds to the average of the asymptotic velocities of 20 apical hyphae (not shown). The grey banner represents one standard deviation of the distribution of these values.

References

    1. Fricker, M. D., Heaton, L. L. M., Jones, N. S. & Boddy, L. The mycelium as a network. Microbiol. Spectr.5, 033. 10.1128/microbiolspec.FUNK-0033-2017 (2017). - PMC - PubMed
    1. Harris SD. Branching of fungal hyphae: Regulation, mechanisms and comparison with other branching systems. Mycologia. 2008;100:823–832. doi: 10.3852/08-177. - DOI - PubMed
    1. Lew RR. How does a hypha grow? The biophysics of pressurized growth in fungi. Nat. Rev. Microbiol. 2011;9:509–518. doi: 10.1038/nrmicro2591. - DOI - PubMed
    1. Boswell GP, Jacobs H, Davidson FA, Gadd GM, Ritz K. Functional consequences of nutrient translocation in mycelial fungi. J. Theor. Biol. 2002;217:459–477. doi: 10.1006/jtbi.2002.3048. - DOI - PubMed
    1. Dawkins, R. The evolution of evolvability. In Artificial Life 201–220 (Routledge, 2019).

Publication types

Substances