. 2023 May 25;13(1):8146.
doi: 10.1038/s41598-023-34445-9.

Simple and efficient differentiation of human iPSCs into contractible skeletal muscles for muscular disease modeling

Affiliations

Simple and efficient differentiation of human iPSCs into contractible skeletal muscles for muscular disease modeling

Muhammad Irfanur Rashid et al. Sci Rep. .

Abstract

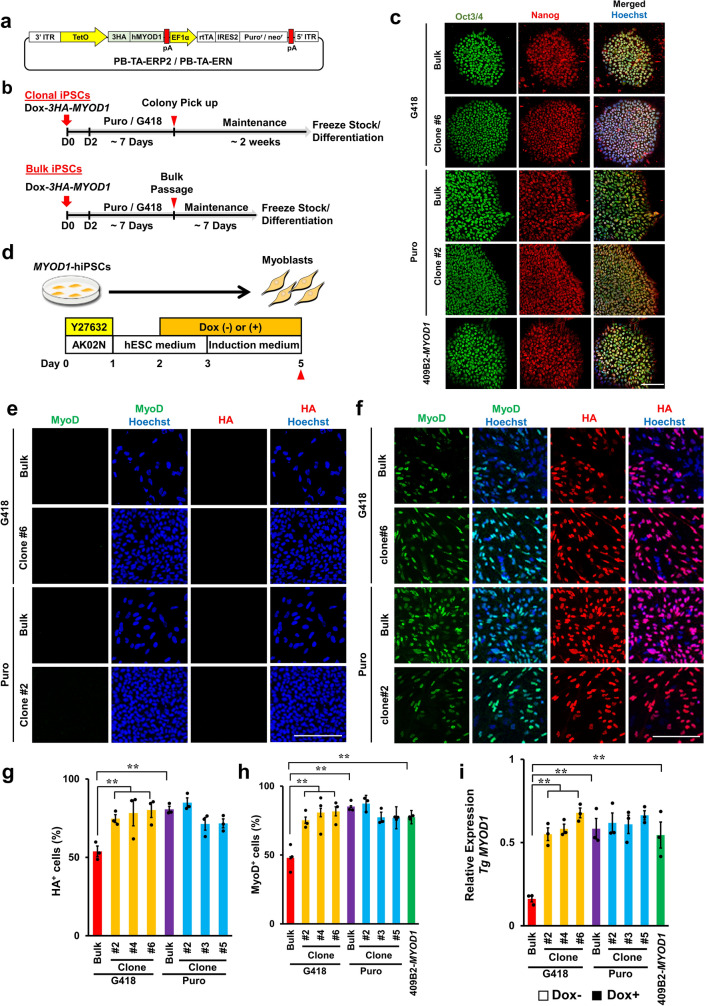
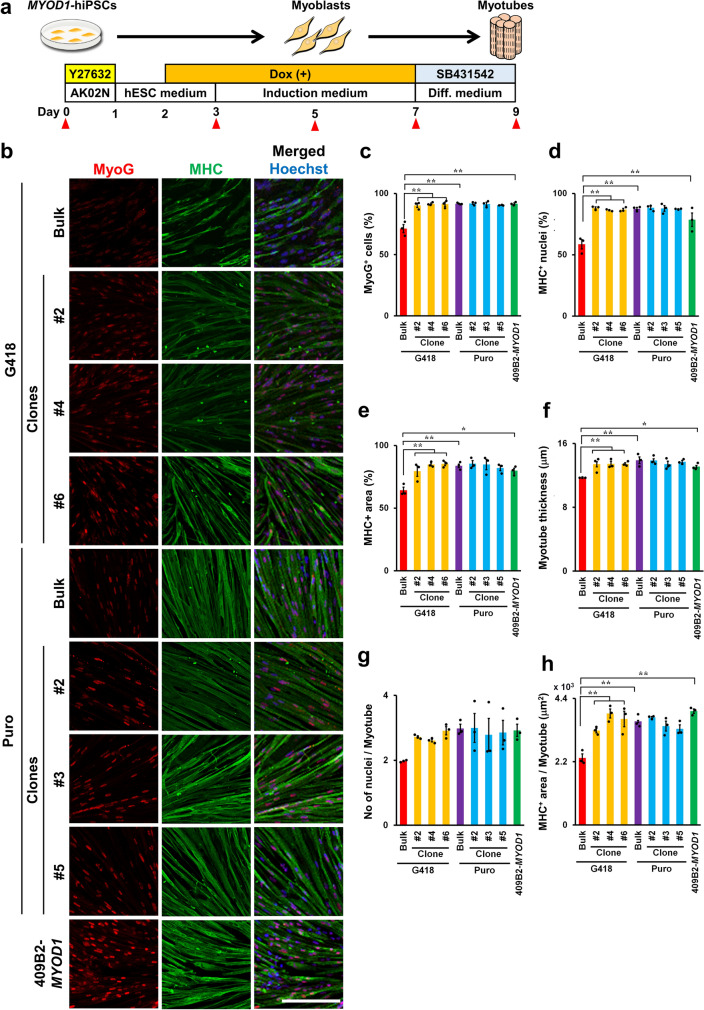
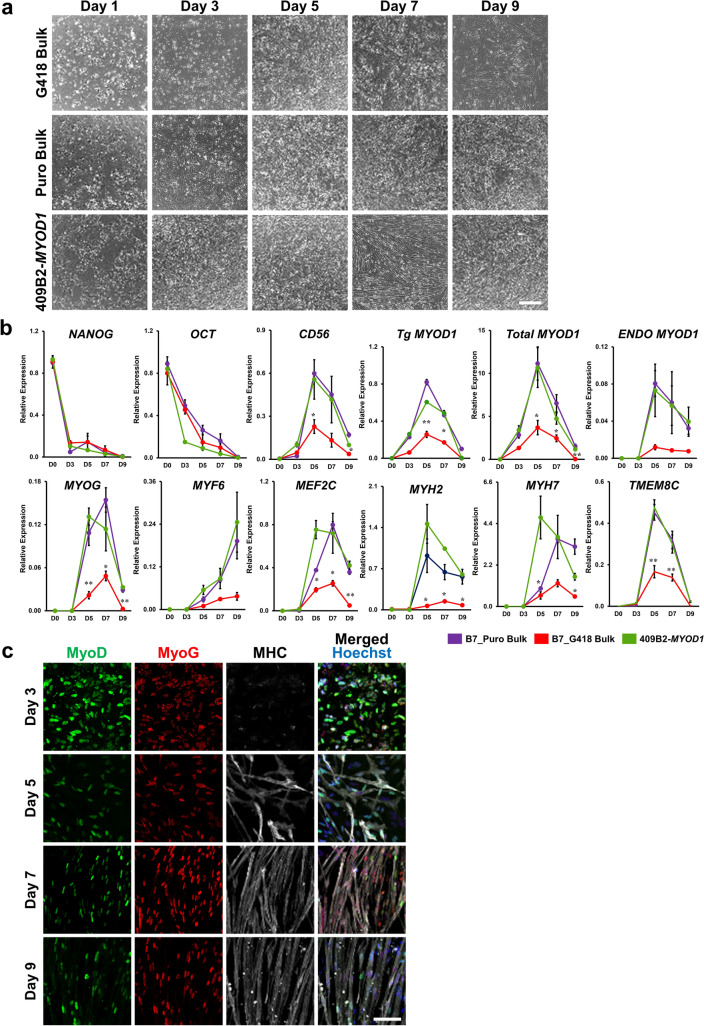
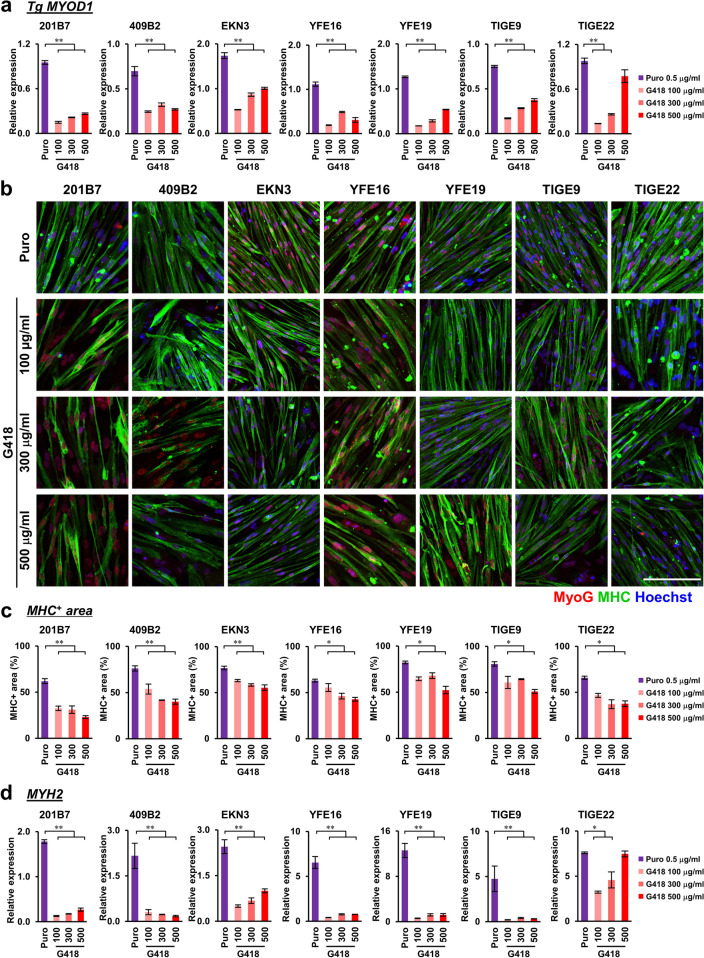
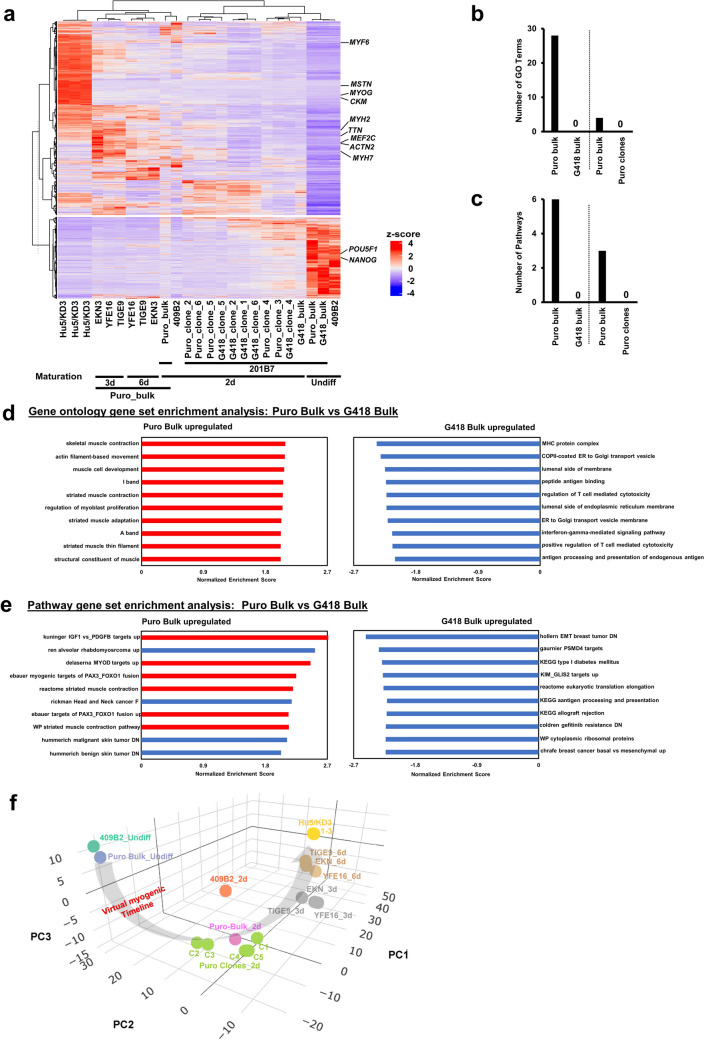
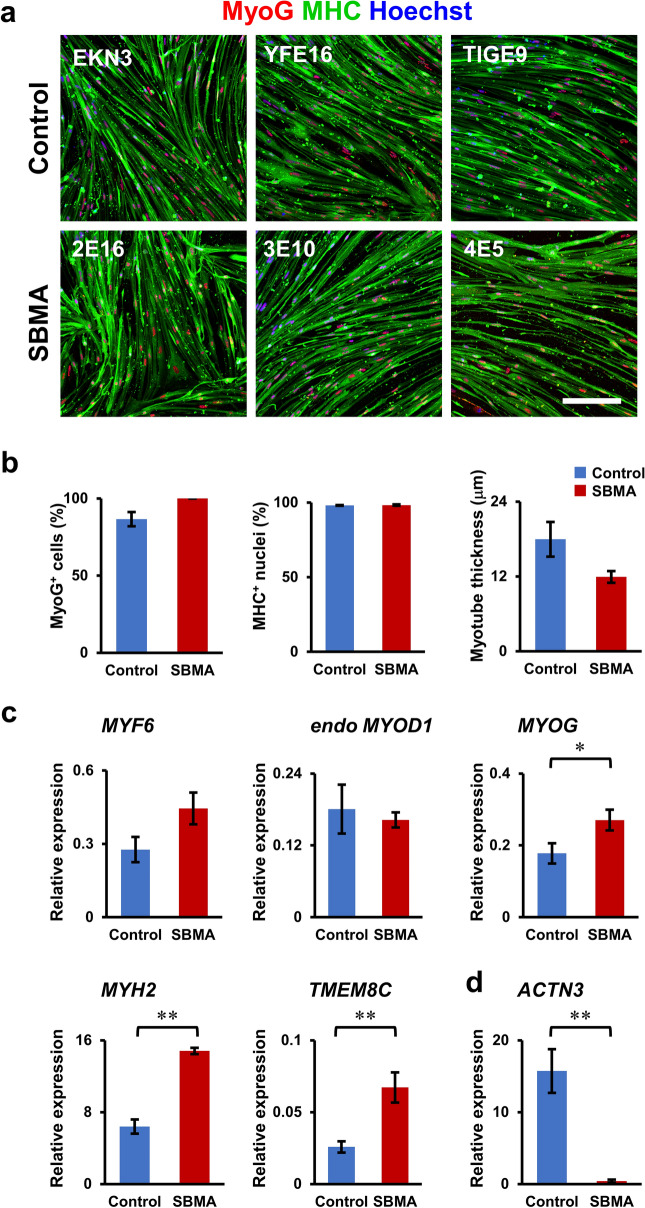
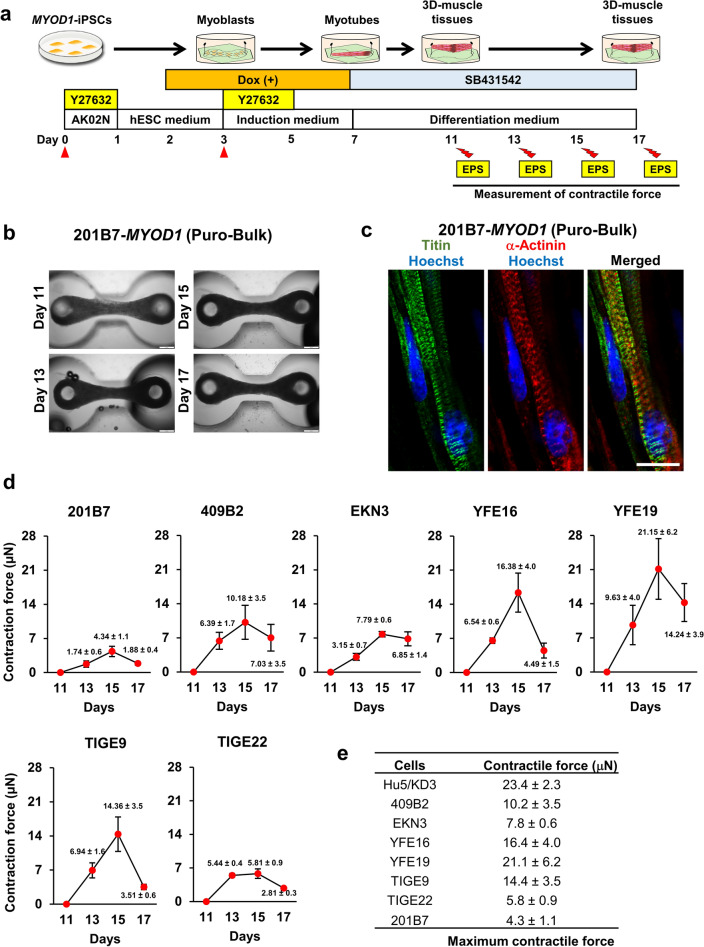
Pathophysiological analysis and drug discovery targeting human diseases require disease models that suitably recapitulate patient pathology. Disease-specific human induced pluripotent stem cells (hiPSCs) differentiated into affected cell types can potentially recapitulate disease pathology more accurately than existing disease models. Such successful modeling of muscular diseases requires efficient differentiation of hiPSCs into skeletal muscles. hiPSCs transduced with doxycycline-inducible MYOD1 (MYOD1-hiPSCs) have been widely used; however, they require time- and labor-consuming clonal selection, and clonal variations must be overcome. Moreover, their functionality should be carefully examined. Here, we demonstrated that bulk MYOD1-hiPSCs established with puromycin selection rather than G418 selection showed rapid and highly efficient differentiation. Interestingly, bulk MYOD1-hiPSCs exhibited average differentiation properties of clonally established MYOD1-hiPSCs, suggesting that it is possible to minimize clonal variations. Moreover, disease-specific hiPSCs of spinal bulbar muscular atrophy (SBMA) could be efficiently differentiated via this method into skeletal muscle that showed disease phenotypes, suggesting the applicability of this method for disease analysis. Finally, three-dimensional muscle tissues were fabricated from bulk MYOD1-hiPSCs, which exhibited contractile force upon electrical stimulation, indicating their functionality. Thus, our bulk differentiation requires less time and labor than existing methods, efficiently generates contractible skeletal muscles, and may facilitate the generation of muscular disease models.


Conflict of interest statement

HO is a paid member of the Scientific Advisory Board of SanBio Co., Ltd., and YO is a scientific advisor of Kohjin Bio Co., Ltd. The other authors declare no competing financial interests.

Figures

Figure 1
Figure 1
Establishment of bulk and clonal MYOD1-hiPSCs transduced with Dox-inducible 3HA-hMYOD1 (Dox-3HA-MYOD1) and Dox-inducible 3HA-hMYOD1 expression under differentiating conditions. (a) PiggyBac vector for Dox-inducible 3HA-hMYOD1 expression with the selection cassette for G418 or puromycin (Dox-3HA-MYOD1). (b) Schematic of the establishment of bulk and clonal MYOD1-hiPSCs. The upper panel indicates the protocol for clonal MYOD1-hiPSCs, and the lower panel indicates the protocol for bulk MYOD1-hiPSCs. (c) ICC analysis of the established MYOD1-hiPSCs for pluripotent stem cell markers (Oct3/4 and Nanog). The nuclei were stained with Hoechst 33258. All bulk and clonal MYOD1-hiPSCs retained the expression of pluripotent stem cell markers. Scale bar, 50 μm. (d) Schematic of the analysis of transgene expression under differentiation conditions with or without Dox. MYOD1-hiPSCs were induced to differentiate into skeletal muscles in the presence of Dox from day 2 to day 5 or cultured in the absence of Dox. Samples were collected at the times indicated by the closed triangles. (eh) ICC analysis of the expression of transgenes (HA) and MyoD1 in cells cultured under differentiating conditions without Dox (e) or with Dox (f). Scale bar, 200 μm. Quantitative analyses of HA+ and MyoD1+ cells are shown in g and h, respectively. The expression levels of transgenes (HA) and MyoD1 were lower in the G418-bulk line than in the G418-clones but were similar in the Puro-bulk line and the Puro-clones. (i) Transgene expression in bulk and clonal MYOD1-hiPSCs established with G418 or puromycin selection in the differentiating conditions in the presence of Dox as examined by qRT‒PCR and compared with that of control 409B2-MYOD1-hiPSCs. The amount of cDNA was normalized to that of human-specific β-ACTIN. The G418-bulk line expressed transgenes at only approximately 25% of the level observed in the G418 clones or 409B2-MYOD1-hiPSCs. The data are presented as the mean ± SEM, n = 3. *p < 0.05, **p < 0.01. ANOVA followed by post hoc Bonferroni test.
Figure 2
Figure 2
Bulk MYOD1-hiPSCs established with puromycin selection achieved efficient myogenic differentiation and myotube maturation similar to that achieved by clonally established MYOD1-hiPSCs. (a) Schematic presentation of skeletal muscle differentiation from MYOD1-hiPSCs. Samples were collected at the times indicated with the closed triangles. (b) ICC analysis of myotubes derived from bulk and clonal MYOD1-hiPSCs established with G418 or puromycin selection and control 409B2-MYOD1-hiPSCs for the expression of MyoG and MHC at day 9 of differentiation. The nuclei were stained with Hoechst 33258. Scale bar, 200 μm. (ce) Quantitative analysis of the parameters for skeletal muscle differentiation, including the proportions of MyoG+ cells among total cells (c), the proportions of MHC+ nuclei among total nuclei (d), and the proportion of MHC+ area in the total area (e). Puro-bulk MYOD1-hiPSCs exhibited differentiation potential similar to that of clonal MYOD1-hiPSCs and control 409B2-MYOD1-hiPSCs, whereas G418-bulk MYOD1-hiPSCs exhibited lower differentiation potential than the other MYOD1-hiPSCs. (fh) Quantitative analysis of the parameters for myotube maturation, including the myotube thickness (f), number of nuclei per myotube (g), and MHC+ area per myotube (h). Puro-bulk MYOD1-hiPSCs exhibited myotube maturation potential similar to that of clonal MYOD1-hiPSCs and control 409B2-MYOD1-hiPSCs, whereas G418-bulk MYOD1-hiPSCs exhibited lower myotube maturation potential than the other MYOD1-hiPSCs. The data are presented as the mean ± SEM, n = 3. *p < 0.05, **p < 0.01. ANOVA followed by post hoc Bonferroni test.
Figure 3
Figure 3
Time course analysis revealed highly efficient myogenic differentiation of Puro-bulk MYOD1-hiPSCs. (a) Brightfield images showing the time course of myogenic differentiation of G418-bulk and Puro-bulk MYOD1-hiPSCs as well as control 409B2-MYOD1-hiPSCs. After day 7, G418-bulk MYOD1-hiPSCs featured nonmuscle cells with flattened morphology and showed fewer myotubes and larger spaces among myotubes than Puro-bulk and clonal MYOD1-hiPSCs. Scale bar, 100 μm. (b) Time course gene expression analysis of G418-bulk, Puro-bulk, and control 409B2-MYOD1-hiPSCs along with myogenic differentiation. The amount of cDNA was normalized to that of human-specific β-ACTIN and is presented as the expression relative to that in undifferentiated hiPSCs (NANOG and OCT3/4), that in the human myoblast cell line Hu5/KD3 differentiated for 3 days (CD56, total and endogenous MYOD1, MYOG, MYF6, MEF2C, MYH2, MYH7, and TMEM8C), or that in EKN3-MYOD1-hiPSCs differentiated for 5 days (Tg MYOD1). The data are presented as the mean ± SEM, n = 3. *, p < 0.05, **, p < 0.01 vs. 409B2-MYOD1-hiPSCs. ANOVA followed by post hoc Bonferroni test. (c) Time course ICC analysis of Puro-bulk MYOD1-hiPSCs for MyoD, MyoG, and MHC along with myogenic differentiation. The number of MyoD+ cells gradually decreased after day 7, while MHC+ cells appeared around day 5 and formed aligned myotubes from day 7. Scale bar, 100 μm.
Figure 4
Figure 4
Reproducibility of higher transgene expression and more efficient skeletal muscle differentiation in seven bulk MYOD1-hiPSCs established by puromycin selection compared with those established by selection with various concentrations of G418. (a) Transgene expression in seven MYOD1-hiPSC clones (201B7, 409B2, EKN3, YFE16, YFE19, TIGE9, and TIGE22) established with puromycin (0.5 μg/ml) or G418 (100 μg/ml, 300 μg/ml, 500 μg/ml) selection in the differentiating conditions (day 5) in the presence of Dox as examined by qRT‒PCR. The amount of cDNA was normalized to that of human-specific β-ACTIN. The G418-bulk line exhibited poor transgene expression even when the cells were selected with high concentrations of G418. The data are presented as the mean ± SEM, n = 3. *, p < 0.05, **, p < 0.01. ANOVA followed by post hoc Bonferroni test. (b) ICC analysis of myotubes derived from bulk-MYOD1-hiPSCs established from seven hiPSC clones by selection with puromycin or various concentrations of G418 for the expression of MyoG and MHC at day 9 of differentiation. The nuclei were stained with Hoechst 33258. All seven Puro-bulk MYOD1-hiPSC lines efficiently differentiated into skeletal muscles in the presence of Dox, whereas G418-bulk MYOD1-hiPSC lines showed moderate or poor differentiation potential regardless of the concentration of G418 used for the selection. Scale bar, 200 μm. (c) Quantitative analysis of the parameter for skeletal muscle differentiation, the proportion of MHC+ area in the total area. The data are presented as the mean ± SEM, n = 3. *, p < 0.05, **, p < 0.01. ANOVA followed by post hoc Bonferroni test. (d) Expression of MYH2 in bulk MYOD1-hiPSC lines established from seven hiPSC clones by selection with puromycin (0.5 μg/ml) or various concentrations of G418 (100 μg/ml, 300 μg/ml, 500 μg/ml) at day 9 of differentiation. The amount of cDNA was normalized to that of human-specific β-ACTIN and is presented as the relative expression in the human myoblast cell line Hu5/KD3 differentiated for 3 days. The data are presented as the mean ± SEM, n = 3. *, p < 0.05, **, p < 0.01. ANOVA followed by post hoc Bonferroni test.
Figure 5
Figure 5
Transcriptome analyses revealed that Puro-bulk MYOD1-hiPSCs were capable of differentiating into more mature skeletal muscles. (a) Hierarchical clustering based on 2,794 genes identified as having significantly altered expression between undifferentiated MYOD1-hiPSCs (day 0) and skeletal muscles derived from control hiPSCs (409B2-MYOD1) (day 9) or human myoblast cell lines (Hu5/KD3). 2d, 3d, and 6d: 2 days, 3 days, and 6 days in myotube differentiation medium, respectively; Undiff.: undifferentiated iPSCs. The expression data were grouped using a hierarchical clustering algorithm (ward. D2) by average linkage with the Pearson distance and visualized by ComplexHeatmap ver. 2.13.1 (https://github.com/jokergoo/ComplexHeatmap) and dendsort ver. 0.3.4 (https://github.com/evanbiederstedt/dendsort). (b) Quantitative analysis of the number of skeletal muscle-related GO terms significantly enriched in each sample indicated (Puro-bulk vs. G418-bulk and Puro-bulk vs. Puro-clones) (FDR q-value < 0.01). (c) Quantitative analysis of the number of skeletal muscle-related pathways significantly enriched in each sample indicated (Puro-bulk vs. G418-bulk and Puro-bulk vs. Puro-clones) (FDR q-value < 0.01). (d) GO enrichment analysis. The top 10 upregulated gene sets in Puro- and G418-bulk with FDR q-values < 0.01 are shown. The red bar indicates muscle-related gene sets, and the blue bar indicates non-muscle-related gene sets. (e) Pathway gene set enrichment analysis. The top 10 pathways significantly enriched in Puro- and G418-bulk with FDR q-values < 0.01 are shown. The red bar indicates muscle-related pathways, and the blue bar indicates non-muscle-related pathways. (f) 3D image of the PCA based on 10,000 genes among undifferentiated MYOD1-hiPSCs (409B2_Undiff, Puro-bulk_Undiff), skeletal muscles derived from control iPSCs (409B2-MYOD1), 201B7-MYOD1-hiPSCs (Puro-bulk and 5 Puro-clones) (2 days in myotube differentiation medium), various Puro-bulk MYOD1-hiPSCs (TIGE9-, EKN3-, and YFE16) (3 and 6 days in myotube differentiation medium), and human myoblast cell line (Hu5/KD3)-derived skeletal muscles. The distinct distributions of undifferentiated cells and differentiated skeletal muscles are indicated. The gray arrow indicates the ‘virtual myogenic timeline’. 2d, 3d, and 6d: 2 days, 3 days, and 6 days in myotube differentiation medium, respectively; Undiff. : undifferentiated iPSCs; C1-C6: clones 1 to 6 of Puro-clones.
Figure 6
Figure 6
SBMA disease-specific hiPSCs efficiently differentiated into mature skeletal muscle and exhibited reduced ACTN3 expression, consistent with the decrease in fast-twitch muscle in SBMA patients. (a) ICC analysis of MyoG (red) and MHC (green) in skeletal muscles derived from SBMA disease-specific hiPSCs and control hiPSCs. SBMA disease-specific hiPSCs could differentiate into mature skeletal muscles as efficiently as control hiPSCs. Scale bar, 200 μm. (b) Quantitative analysis of the parameters of skeletal muscle differentiation (MyoG+ cells and MHC+ nuclei) and maturation (thickness of myotubes). The data are presented as the mean ± SEM, n = 3. (c,d) Quantitative RT‒PCR analysis of SBMA and control hiPSC-derived skeletal muscles for MYF6, endo-MYOD1, MYOG, MYH2, and TMEM8C. (c) and ACTN3 (d) expressed in fast-twitch muscles. The data are presented as the mean ± SEM, n = 9 (n = 3 each from 3 patients and 3 controls). *p < 0.05, **p < 0.01.
Figure 7
Figure 7
3D muscle tissues fabricated from Puro-bulk MYOD1-hiPSCs exhibited contractile force, indicating the functionality of the hiPSC-derived muscle tissues. (a) Schematic of the fabrication of 3D muscle tissues. On day 3 of differentiation, differentiating cells were dissociated and replated on microdevices. On day 11, muscle tissues were pulled up at the top of the pillar and processed for measurement of contractile force elicited by EPS at days 11, 13, 15 and 17. (b) Brightfield top-view images of muscle tissues derived from Puro-bulk 201B7-MYOD1-hiPSCs at days 11, 13, 15, and 17. Scale bar, 500 μm. (c) IHC analysis of fabricated muscle tissues from Puro-bulk 201B7-MYOD1-hiPSCs for Titin and α-Actinin at day 17 of differentiation. Sarcomere formation was clearly observed in Puro-bulk 201B7-MYOD1-hiPSC-derived muscle tissues. The nuclei were stained with Hoechst 33258. Scale bar, 20 µm. (d) Measurement of the contractile force of the muscle tissues derived from seven hiPSC clones (201B7, 409B2, EKN3, YFE16, YFE19, TIGE9, and TIGE22) at days 11, 13, 15, and 17 of differentiation. The maximum contractile force is recorded at day 15. The data are presented as the mean ± SEM, n = 4. (e) Comparison of the maximum contractile force of muscle tissues derived from seven hiPSC clones (201B7, 409B2, EKN3, YFE16, YFE19, TIGE9, and TIGE22) and Hu5/KD3 cells.

Similar articles

Cited by

References

    1. Takahashi K, Yamanaka S. Induction of pluripotent stem cells from mouse embryonic and adult fibroblast cultures by defined factors. Cell. 2006;126:663–676. doi: 10.1016/j.cell.2006.07.024. - DOI - PubMed
    1. Takahashi K, et al. Induction of pluripotent stem cells from adult human fibroblasts by defined factors. Cell. 2007;131:861–872. doi: 10.1016/j.cell.2007.11.019. - DOI - PubMed
    1. Corti S, Faravelli I, Cardano M, Conti L. Human pluripotent stem cells as tools for neurodegenerative and neurodevelopmental disease modeling and drug discovery. Expert Opin. Drug Discov. 2015;10:615–629. doi: 10.1517/17460441.2015.1037737. - DOI - PubMed
    1. Chal J, Pourquié O. Making muscle: Skeletal myogenesis in vivo and in vitro. Development. 2017;144:2104–2122. doi: 10.1242/dev.151035. - DOI - PubMed
    1. Xu C, et al. A zebrafish embryo culture system defines factors that promote vertebrate myogenesis across species. Cell. 2013;155:909–921. doi: 10.1016/j.cell.2013.10.023. - DOI - PMC - PubMed

Publication types