. 2023 Jun;55(6):984-994.
doi: 10.1038/s41588-023-01397-9. Epub 2023 May 25.

Integrating genetics with single-cell multiomic measurements across disease states identifies mechanisms of beta cell dysfunction in type 2 diabetes

Affiliations

Integrating genetics with single-cell multiomic measurements across disease states identifies mechanisms of beta cell dysfunction in type 2 diabetes

Gaowei Wang et al. Nat Genet. 2023 Jun.

Abstract

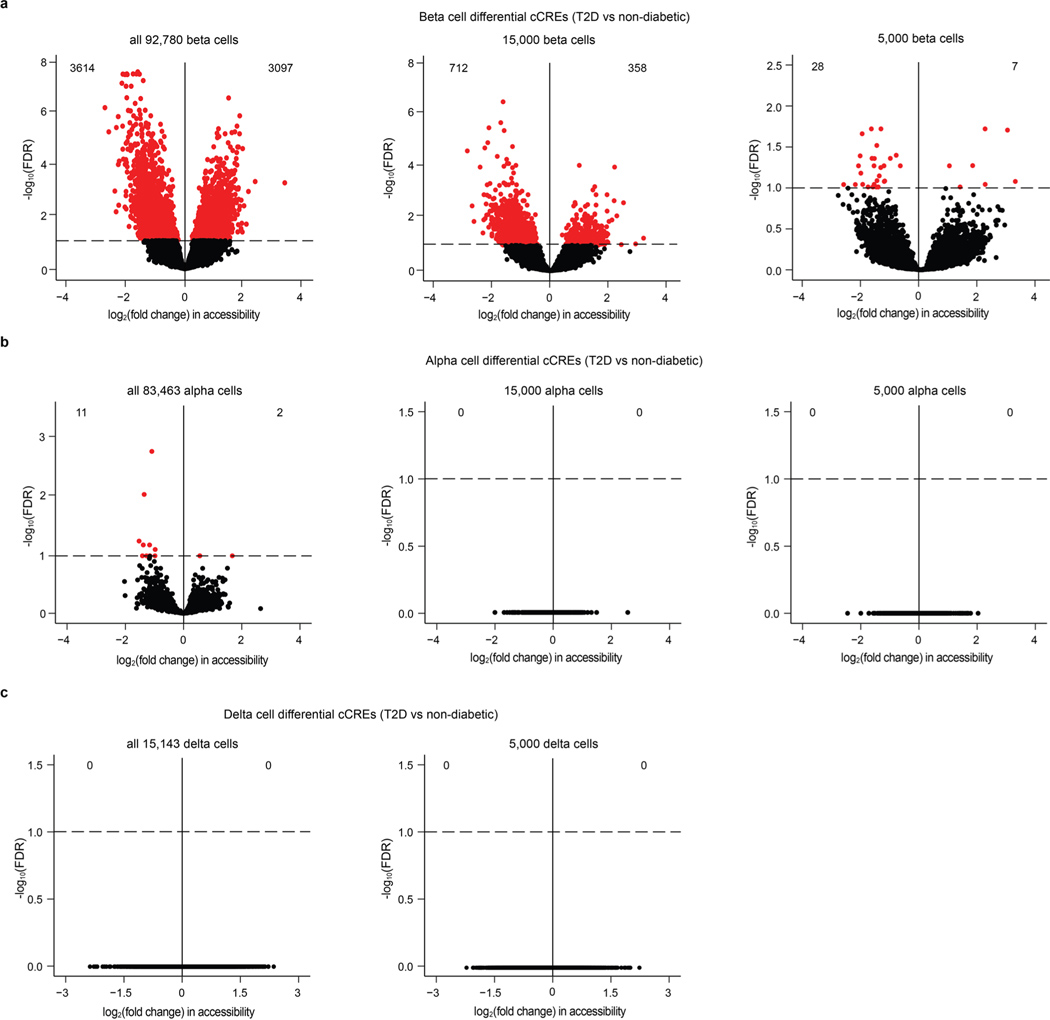
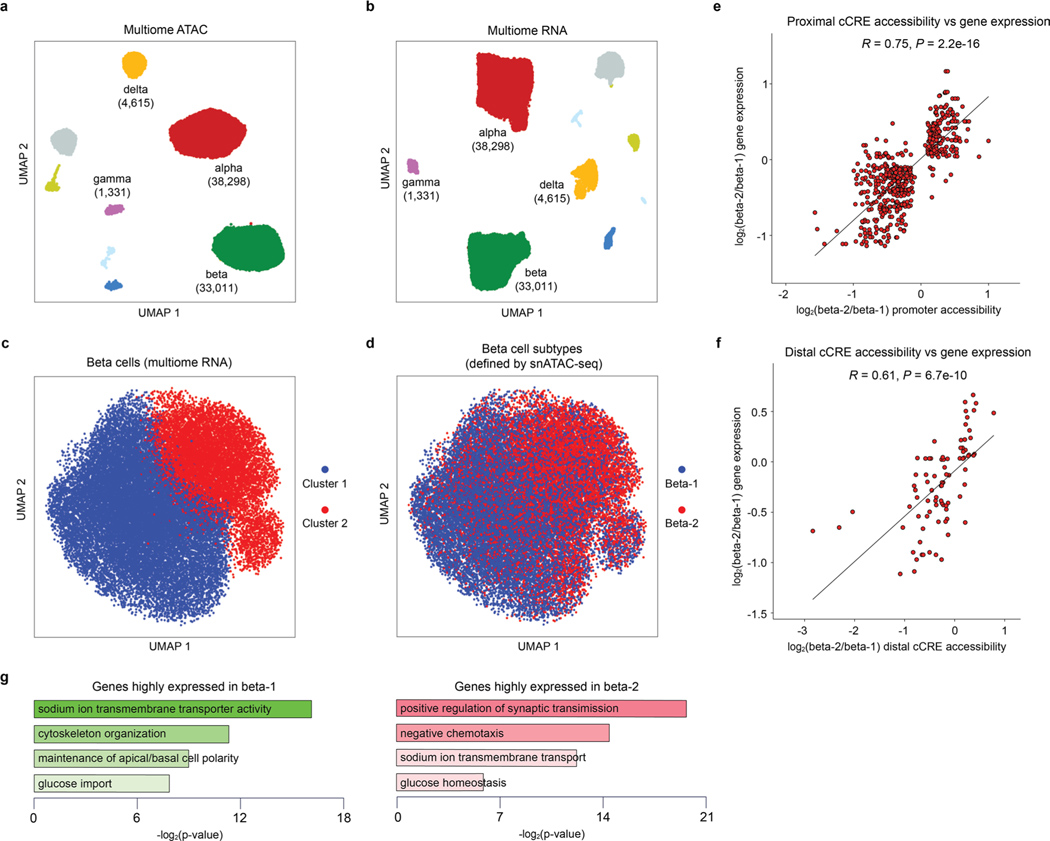
Dysfunctional pancreatic islet beta cells are a hallmark of type 2 diabetes (T2D), but a comprehensive understanding of the underlying mechanisms, including gene dysregulation, is lacking. Here we integrate information from measurements of chromatin accessibility, gene expression and function in single beta cells with genetic association data to nominate disease-causal gene regulatory changes in T2D. Using machine learning on chromatin accessibility data from 34 nondiabetic, pre-T2D and T2D donors, we identify two transcriptionally and functionally distinct beta cell subtypes that undergo an abundance shift during T2D progression. Subtype-defining accessible chromatin is enriched for T2D risk variants, suggesting a causal contribution of subtype identity to T2D. Both beta cell subtypes exhibit activation of a stress-response transcriptional program and functional impairment in T2D, which is probably induced by the T2D-associated metabolic environment. Our findings demonstrate the power of multimodal single-cell measurements combined with machine learning for characterizing mechanisms of complex diseases.


Conflict of interest statement

Competing interests

K.J.G. holds stock in Vertex Pharmaceuticals and Neurocrine Biosciences. J.C. is now employed by and holds stock in Pfizer Inc. The other authors declare no competing interests.

Figures

Extended Data Fig. 1 |
Extended Data Fig. 1 |. Quality control of snATAC-seq data.
(a) Steps for snATAC-seq data processing and quality control. (b) Representative quality control metrics for each donor. Log10 total reads, fraction of reads overlapping promoters, fraction of reads overlapping peaks, and fraction of reads overlapping mitochondria DNA distribution of cells from library JYH809 as example. Blue vertical lines denote thresholds of 1000 minimal fragment number, 15% fragments overlapping promoters, 30% fragments overlapping peaks, and 10% fraction of reads overlapping mitochondria DNA, respectively. Red vertical lines denote thresholds to identify top 1% barcodes with extremely high total fragment number and fraction of reads overlapping promoters and peaks, respectively. (c) Representative cell clustering from library JYH809. (d) Promoter chromatin accessibility in a 5 kb window around TSS for endocrine marker genes in individual nuclei library JYH809. Total counts normalization and log-transformation were applied. (e) Cell clustering of chromatin accessibility profiles from all donors. (f) Representative low-quality cluster and subcluster. Cells in cluster 14 (top, highlighted in red) have significantly lower unique fragment than cells in other clusters (p = 2.3e-9, n = 255,598 cells). Cells in subcluster 1 (bottom, highlighted in red) have significantly lower fraction of reads overlapping peaks than cells in other clusters (p = 4.8e-5, n = 16,296 cells). Data are shown as mean ± S.E.M., ANOVA test with sex, age, BMI, disease status as covariates. (g) Log10 total reads, fraction of reads overlapping peaks and fraction of reads in promoters of cells from each cluster in Fig. 1b. Data are shown as mean ± S.E.M. (h) Promoter chromatin accessibility in a 5 kb window around TSS for selected endocrine and non-endocrine marker genes for each profiled cell (alpha: GCG, beta: INS-IGF2, delta: SST, gamma: PPY, acinar: REG1A, ductal: CFTR, stellate: PDGFRB, endothelial: CLEC14A, immune: CCL3). The UMAP projection is the same as in the main Fig. 1b. (i) Genome browser tracks showing aggregate read density (scaled to uniform 1 × 10⁶ read depth) for cells within each cell type cluster at hormone gene loci for endocrine islet cell types. The gene body of each gene is highlighted.
Extended Data Fig. 2 |
Extended Data Fig. 2 |. Identification of factors explaining donor variability in snATAC-seq data.
(a,d,g,j) Absolute Spearman correlation coefficient between the first 6 principle components (PCs) and each biological or technical variable in beta (a), alpha (d), delta (g), and gamma (j) cells. An absolute Spearman correlation threshold of 0.4 was used to identify factors having a high correlation with each PC. (b,e,h,k) Principal component analysis (PCA) based on cCREs in beta (b), alpha (e), delta (h), and gamma (k) cells from individual non-diabetic (n = 11), pre-T2D (n = 8), and T2D (n = 15) donors which are color-coded by disease status. Each donor in the space is defined by the first two principal components (left) and the two principal components (right) that show highest correlation with disease status. (c,f,i,l) Pairwise Spearman correlation coefficients between biological or technical variables in beta (c), alpha (f), delta (i), and gamma (l) cells.
Extended Data Fig. 3 |
Extended Data Fig. 3 |. Validation of beta cell T2D-differential cCREs in snATAC-seq data from an independent cohort of donor islets.
(a) Clustering of chromatin accessibility profiles from HPAP human islet snATAC-seq data (non-diabetic, n = 13; pre-T2D, n = 2; T2D, n = 5). Nuclei are plotted using the first two UMAP components. Clusters are assigned cell type identities based on promoter accessibility of known marker genes (see Extended Data Fig. 3b). The number of nuclei for each cell type cluster is shown in parentheses. (b) Promoter chromatin accessibility in a 5 kb window around TSS for selected endocrine and non-endocrine marker genes for each profiled nucleus (alpha: GCG, beta: INS-IGF2, delta: SST, acinar: REG1A). (c) Heatmap showing chromatin accessibility at differential cCREs identified in Fig. 1e in HPAP snATAC-seq data. Columns represent beta cells from each donor (non-diabetic, n = 13; T2D, n = 5) and all non-diabetic and T2D donors with accessibility of peaks normalized by CPM (counts per million).
Extended Data Fig. 4 |
Extended Data Fig. 4 |. T2D affects chromatin accessibility more profoundly in beta cells than in other endocrine cell types.
(a) Volcano plot showing differential cCREs in beta cells between type 2 diabetic (T2D) and non-diabetic donors. Panels show all beta cells (left), beta cells down-sampled to 15,000 (middle), and 5,000 cells (right). Each dot represents a cCRE. cCREs with FDR < .1 after Benjamini-Hochberg correction (red dots) were considered differentially accessible. (b) Volcano plot showing differential cCREs in alpha cells between T2D and non-diabetic donors. Panels show all alpha cells (left), alpha cells down-sampled to 15,000 (middle), and 5,000 cells (right). Each dot represents a chromatin accessible cCRE. cCREs with FDR < .1 after Benjamini-Hochberg correction (red dots) were considered differentially accessible. (c) Volcano plot showing differential cCREs in delta cells between T2D and non-diabetic donors. Panels show all delta cells (left) and delta cells down-sampled to 5,000 cells (right). Each dot represents a chromatin accessible cCRE. cCREs with FDR < .1 after Benjamini-Hochberg correction (red dots) were considered differentially accessible.
Extended Data Fig. 5 |
Extended Data Fig. 5 |. Machine learning identifies two beta cell subtypes.
(a) Clustering of chromatin accessibility profiles from 92,780 beta cells from non-diabetic, pre-T2D and T2D donor islets using Scanpy (resolution=0.5). Nuclei are plotted using the first two UMAP components. (b) Position of beta cells from representative non-diabetic (MM80), pre-T2D (MM55), and T2D (MM54) donors on the UMPA. (c) Illustration of the strategy for distinguishing gradual from subtype changes in beta cells using machine learning. Possible scenarios for cell changes during T2D progression and expected disease state prediction accuracies for each scenario. In the case of no T2D-associated changes, the prediction accuracy for each disease state would be random (scenario 1), gradual cell state changes would be reflected by high prediction accuracy in each disease state (scenario 2), and subtype changes would be reflected by median prediction accuracies (scenario 3, here shown for two cell subtypes). (d, f, h) Relative abundance of predicted disease state among beta (d), alpha (f), and delta (h) cells from each donor using XGBOOST. Each column represents nuclei from one donor. (e, g, i) Relative abundance of predicted disease state among beta (e), alpha (g), and delta (i) cells in non-diabetic, pre-T2D and T2D donor islets. Data are shown as mean ± S.E.M. (n = 11 non-diabetic, n = 8 pre-T2D, n = 15 T2D donors), dots denote data points from individual donors. (j) Illustration of the strategy for identifying a classifier capable of distinguishing the two beta cell subtypes.
Extended Data Fig. 6 |
Extended Data Fig. 6 |. Validation of beta cell subtypes using independent data and computational methods.
(a) Relative abundance of beta-1 and beta-2 cells in male and female donor islets. Data are shown as mean ± S.E.M. (n = 9 females, n = 25 males), dots denote data points from individual donors. ANOVA test with age, disease, BMI, and islet index as covariates. (b-d) Pearson correlation between relative abundance of beta-2 cells and BMI (b), islet index (c), age (d) across donors (n = 34 donors). The bands around the linear regression line represent the range of the 95% confidence interval, two-sided Pearson test. (e) Relative abundance of beta-1 and beta-2 cells in islet snATAC-seq data from an independent cohort (n = 13 non-diabetic, n = 5 T2D donors). Each column represents cells from one donor. (f) Relative abundance of each beta cell subtype in non-diabetic and T2D donor islets. Data are shown as mean ± S.E.M (n = 13 non-diabetic, n = 5 T2D donors). **P < .01; ANOVA test with age, sex, and BMI as covariates. (g) Clustering of chromatin accessibility profiles from 92,780 beta cells from non-diabetic, pre-T2D and T2D donors using beta cell differential cCREs between non-diabetic and T2D donors from Fig. 1e. Cells are plotted using the first two UMAP components. (h) Relative abundance of each beta cell cluster based on UMAP annotation. Each column represents cells from one donor. (i) Position of beta cells from non-diabetic, pre-T2D and T2D donors on the UMAP. ( j) Position of beta cells from representative non-diabetic (MM80), pre-T2D (MM55) and T2D (MM54) donors on the UMPA. (k) Relative abundance of each beta cell cluster in non-diabetic, pre-T2D and T2D donor islets. Data are shown as mean ± S.E.M. (n = 11 non-diabetic, n = 8 pre-T2D, n = 15 T2D donors). **P < .01, *P < .05; ANOVA test with age, sex, BMI, and islet index as covariates. (l) Overlap between beta cell subtypes identified using machine learning and beta cell clusters from UMPA. The overlap is 76.6% between cluster 1 and beta-1 and 74.3% between cluster 2 and beta-2. P = 2.2e-16 (Two-sided Binominal test).
Extended Data Fig. 7 |
Extended Data Fig. 7 |. Validation and characterization of beta cell subtypes using multiome data.
(a, b) Clustering of chromatin accessibility profiles of nuclei from multiome data (a). (b) Clustering of gene expression profiles of cells from multiome data (b). Nuclei are plotted using the first two UMAP components. Clusters are assigned cell type identities based on expression levels or promoter chromatin accessibility of known marker genes (alpha: GCG, beta: INS, delta: SST, gamma: PPY). The number of nuclei for each cell type cluster is shown in parentheses. n = 20 donors (c) Clustering of gene expression profiles of beta cells from multiome data using genes linked to differential proximal (within ± 5 kb of a TSS in GENCODE V19) and distal (based on potential distal cCRE-promoter connections inferred from Cicero, see Methods) cCREs between non-diabetic and T2D beta cells from Fig. 1e. Nuclei are plotted using the first two UMAP components. (d) Plots of beta cell subtypes predicted from chromatin accessibility profiles of beta cells from multiome data by machine learning. (e-f) Correlation between changes in proximal cCRE (within ± 5 kb of a TSS in GENCODE V19) accessibility and gene expression differences between beta-1 and beta-2 cells for differentially expressed genes from Fig. 3b. There are 544 proximal cCREs and target gene pairs in total, of which 511 have consistent changes between proximal cCRE accessibility and gene expression (e). Correlation between changes in distal cCRE (potential distal cCRE-promoter connections inferred from Cicero, see Methods) accessibility and gene expression differences between beta-1 and beta-2 cells for differentially expressed genes from Fig. 3b. There are 85 distal cCREs and target gene pairs in total, of which 72 have consistent changes between distal cCRE accessibility and gene expression (f). Two-sided Pearson test. (g) Enriched gene ontology terms among genes (see Fig. 3b) with higher (proximal or distal) cCRE accessibility and expression in beta-1 compared to beta-2 cells (left) and higher (proximal or distal) cCRE accessibility and expression in beta-2 compared to beta-1 cells (right).
Extended Data Fig. 8 |
Extended Data Fig. 8 |. Beta-1 and beta-2 cell classification in scRNA-seq data from independent cohorts.
(a, d, g, j) Clustering of gene expression profiles of beta cells from cohort 15, cohort 212, cohort 322, and Patch-seq cohort using differentially expressed genes between beta-1 and beta-2 from Fig. 3b. Cells are plotted using the first two UMAP components. The number of donors for each cohort and cells for each cell cluster is shown in parentheses. (b, e, h, k) Heatmap showing pseudo-bulk expression levels of differentially expressed genes between beta-1 and beta-2 (see Fig. 3b) in beta cells from cluster 1 and cluster 2 of cohort 15, cohort 212, cohort 322, and Patch-seq cohort. Expression levels of genes are normalized by TPM (transcripts per million). (c, f, i, l) Relative abundance of each beta cell subtype in non-diabetic and T2D donor islets in cohort 15 (n = 5 nondiabetic, n = 4 T2D) cohort 212 (n = 12 non-diabetic, n = 6 T2D), cohort 322 (n = 10 non-diabetic), and Patch-seq cohort (n = 15 non-diabetic, n = 16 pre-T2D, n = 14 T2D). Data are shown as mean ± S.E.M., dots denote data points from individual donors. **P < .01, ***P < .001; ANOVA test with age, sex, and BMI as covariates.
Extended Data Fig. 9 |
Extended Data Fig. 9 |. Transcriptional programs distinguishing the two beta cell subtypes.
(a) Genome browser tracks showing aggregate RNA and ATAC read density at representative genes positively regulated by HNF1A, HNF4A or HNF4G. Beta cell cCREs with binding sites for HNF1A, HNF4A and HNF4G are shown. (b) Genome browser tracks showing aggregate RNA and ATAC read density at representative genes positively regulated by NEUROD1, NFIA or TCF4. Beta cell cCREs with binding sites for NEUROD1, NFIA and TCF4 are shown.(a, b) All tracks are scaled to uniform 1 × 10⁶ read depth, differential expressed genes between beta-1 and beta-2 are indicated by grey shaded boxes. (c) Box plots showing accessibility at HNF1A, HNF4A and HNF4G proximal cCREs in beta-1 and beta-2 cells. Genomic coordinates of promotor regions are shown in parentheses. (d) Bar plots showing expression of HNF1A, HNF4A and HNF4G in beta-1 and beta-2 cells. (e) Bar plots showing accessibility at NEUROD1, NFIA and TCF4 proximal cCREs in beta-1 and beta-2 cells. Proximal region of genes were shown in parentheses. (f) Bar plots showing expression of NEUROD1, NFIA, and TCF4 in beta-1 and beta-2. (c-f) Accessibility of peaks is normalized by CPM, gene expression is normalized by TPM. Data are shown as mean ± S.E.M., n = 20 donors, Two-sided paired t-test. (g) Genome browser tracks showing aggregate RNA and ATAC read density at HNF1A, HNF4A and HNF4G in beta-1 and beta-2 cells. Beta cell cCREs with binding sites for HNF1A, HNF4A and HNF4G are shown. (h) Genome browser tracks showing aggregate RNA and ATAC read density at NEUROD1, NFIA and TCF4 in beta-1 and beta-2 cells. Beta cell cCREs with binding sites for NEUROD1, NFIA and TCF4 are shown. (i) Genome browser tracks showing aggregate RNA and ATAC read density at HNF1A and TCF4 in beta-1 and beta-2 cells. Beta cell cCREs with binding sites for HNF1A and TCF4 are shown. All tracks are scaled to uniform 1 × 10⁶ read depth.
Extended Data Fig. 10 |
Extended Data Fig. 10 |. Transcriptional programs changed in both beta cell subtypes in T2D.
(a) Heatmap showing chromatin accessibility at cCREs with differential accessibility in beta-1 cells from non-diabetic and T2D donors. Columns represent beta cells from each donor (non-diabetic, n = 11; pre-T2D, n = 8; T2D, n = 15) with accessibility of peaks normalized by CPM (counts per million). (b) Heatmap showing chromatin accessibility at cCREs with differential accessibility in beta-2 cells from non-diabetic and T2D donors. Columns represent beta cells from each donor (non-diabetic, n = 11; pre-T2D, n = 8; T2D, n = 15) with accessibility of peaks normalized by CPM. (c) Heatmap showing expression of genes negatively regulated by TFs (green) with higher activity in non-diabetic compared to T2D beta-1 cells (see Methods) and TFs (red) with lower activity in non-diabetic compared to T2D beta-1 cells (n = 6 non-diabetic, n = 8 pre-T2D, n = 6 T2D donors). Representative target genes of individual TFs are highlighted and classified by biological processes. Gene expression is normalized by TPM (transcripts per million). # denotes TFs with decreased or increased expression in T2D in both beta-1 and beta-2 cells. (d) Heatmap showing expression of genes negatively regulated by TFs (green) with higher activity in non-diabetic compared to T2D beta-2 cells (see Methods) and TFs (red) with lower activity in non-diabetic compared to T2D beta-2 cells (n = 6 non-diabetic, n = 8 pre-T2D, n = 6 T2D donors). Representative target genes of individual TFs are highlighted and classified by biological processes. Gene expression is normalized by TPM (transcripts per million). # denotes TFs with decreased or increased expression in T2D in both beta-1 and beta-2 cells. (e-g) Pearson correlation of expression levels between indicated TFs across pseudo-bulk RNA profiles from each beta cell subtype (40 dots in total: 20 donors including n = 6 non-diabetic, n = 8 pre-T2D, n = 6 T2D). The bands around the linear regression line represent the range of the 95% confidence interval. Two-sided Pearson test.
Fig. 1 |
Fig. 1 |. Beta cells exhibit changes in chromatin activity in T2D.
a, Schematic of the study design. snATAC-seq was performed on nuclei from pancreatic islets from 11 nondiabetic, 8 pre-T2D and 15 T2D human donors. Single-nucleus multiome (ATAC + RNA) analysis was performed on a subset of donors (n = 6 nondiabetic, n = 8 pre-T2D, n = 6 T2D). We used machine learning to identify classifiers for beta cells in nondiabetic, pre-T2D and T2D donors; inferred GRNs; linked molecular signatures to beta cell function using Patch-seq; and identified T2D causal gene regulatory programs. b, Clustering of chromatin accessibility profiles from 218,973 nuclei from nondiabetic, pre-T2D and T2D donor islets. Nuclei are plotted using the first two UMAP components. Clusters are assigned cell type identities based on promoter accessibility of known marker genes. The number of nuclei for each cell type cluster is shown in parentheses. EC, endothelial cells. c, Relative abundance of each cell type based on UMAP annotation in b. Each column represents cells from one donor. d, Relative abundance of each islet endocrine cell type in nondiabetic, pre-T2D and T2D donor islets. Data are shown as mean ± s.e.m. (n = 11 nondiabetic, n = 8 pre-T2D, n = 15 T2D); dots denote data points from individual donors. ***P < 0.001; **P < 0.01; *P < 0.05; ANOVA test with age, sex, BMI and islet index as covariates. e, Heatmap showing chromatin accessibility at cCREs with differential accessibility in beta cells from nondiabetic and T2D donors. Columns represent beta cells from each donor and all nondiabetic, pre-T2D and T2D donors with accessibility of peaks normalized by counts per million (CPM).
Fig. 2 |
Fig. 2 |. Machine learning identifies two beta cell subtypes with differential abundance in T2D.
a, Schematic outlining the machine learning-based approach to distinguish two models that could account for gene regulatory changes in beta cells in T2D. b, Relative abundance of beta-1 (blue) and beta-2 (red) cells identified by machine learning. Each column represents nuclei from one donor. c, Relative abundance of each beta cell subtype in nondiabetic, pre-T2D and T2D donor islets. Data are shown as mean ± s.e.m. (n = 11 nondiabetic, n = 8 pre-T2D, n = 15 T2D); dots denote data points from individual donors. ***P < .001; ANOVA test with age, sex, BMI and islet index as covariates. d, Pearson correlation between relative abundance of beta-2 cells and HbA1c across donors (n = 34 donors). The bands around the linear regression line represent the range of 95% confidence interval; two-sided Pearson test.
Fig. 3 |
Fig. 3 |. The two beta cell subtypes are distinguished by chromatin accessibility, gene expression and function.
a, Workflow to link beta cell subtype chromatin accessibility to gene expression using islet single-nucleus multiome (ATAC + RNA) data and gene expression to function using Patch-seq. b, Heatmap showing log2 differences (beta-2/beta-1) in chromatin accessibility at cCREs with differential accessibility between beta cell subtypes (left, FDR < 0.05) and log2 differences (beta-2/beta-1) in gene expression of cCRE target genes with differential expression between beta cell subtypes (right, FDR < 0.15). Rows represent differential cCREs or genes, columns represent donors (n = 20 donors). Representative genes are highlighted. Accessibility of cCREs is normalized by CPM, and gene expression is normalized by TPM. Two-sided paired t-test, FDR, P values adjusted with the Benjamini–Hochberg method. c, Box plots showing cCRE accessibility (top) and gene expression (bottom) of representative genes in beta-1 and beta-2 cells. Proximal regions of genes are shown in parentheses. Accessibility of peaks is normalized by CPM, and gene expression is normalized by TPM. Data are shown as mean ± s.e.m., n = 20 donors, two-sided paired t-test. d, TF motif enrichment at cCREs with higher accessibility in beta-1 cells than in beta-2 cells (left) or higher accessibility in beta-2 cells than in beta-1 cells (right) against a background of all cCREs in beta cells using HOMER. The top three enriched de novo motifs, their P values, and best matched known TF motif are shown. e–g, Bar plots from Patch-seq analysis showing early, late and total exocytosis in beta-1 cells (10 cells from 4 nondiabetic donors) and beta-2 cells (4 cells from 4 nondiabetic donors) stimulated with 1 mM glucose (e), in beta-1 cells (26 cells from 10 nondiabetic donors) and beta-2 cells (20 cells from 9 nondiabetic donors) stimulated with 5 mM glucose (f), and in beta-1 cells (42 cells from 5 nondiabetic donors) and beta-2 cells (23 cells from 6 nondiabetic donors) stimulated with 10 mM glucose (g). Data are shown as mean ± s.e.m.; *P < 0.05; ANOVA test with age, sex and BMI as covariates. pF, picofarad; fF, femtofarad.
Fig. 4 |
Fig. 4 |. GRNs defining the two beta cell subtypes.
a, Schematic outlining the inference of beta cell GRNs and differential gene regulatory programs (TF–gene modules) between beta cell subtypes. b, Heatmap showing log2 differences (beta-2/beta-1) in expression for genes positively regulated by TFs (HNF1A, HNF4A and HNF4G) with higher accessibility in beta-1 cells than in beta-2 cells and TFs (NEUROD1, NFIA and TCF4) with higher accessibility in beta-2 cells than in beta-1 cells (Methods). Representative target genes of individual TFs are highlighted. Gene expression is normalized by TPM. c, Heatmap showing log2 differences (beta-2/beta-1) in expression for genes negatively regulated by TFs (HNF1A, HNF4A and HNF4G) with higher accessibility in beta-1 cells than in beta-2 cells and TFs (NEUROD1, NFIA and TCF4) with higher accessibility in beta-2 cells than in beta-1 cells (Methods). Representative target genes of individual TFs are highlighted. Gene expression is normalized by TPM. df, Pearson correlation of expression levels between indicated TFs across pseudobulk RNA profiles from each beta cell subtype (20 donors, 40 dots in total). The bands around the linear regression lines represent the range of 95% confidence interval, two-sided Pearson test. g, A bistable circuit established by positive feedback among HNF1A, HNF4A and HNF4G; positive feedback among NEUROD1, NFIA and TCF4; and mutual repression between HNF1A and TCF4.
Fig. 5 |
Fig. 5 |. Beta cell functional and gene regulatory changes in T2D.
a,b, Bar plots from Patch-seq analysis showing early, late and total exocytosis in beta-1 cells from nondiabetic (68 cells from 11 donors), pre-T2D (91 cells from 14 donors) and T2D (35 cells from 7 donors) donors (a) and in beta-2 cells from nondiabetic (43 cells from 10 donors), pre-T2D (57 cells from 14 donors) and T2D (131 cells from 14 donors) donors (b) stimulated with 5 mM or 10 mM glucose. Data are shown as mean ± s.e.m.; *P < 0.05; **P < 0.01; ANOVA test with age, sex and BMI as covariates. c,d, Heatmap showing expression of genes positively regulated by TFs with higher (green) or lower (red) activity in nondiabetic compared with T2D beta-1 cells (c) and beta-2 cells (d). Representative target genes of individual TFs are highlighted and classified by biological processes. Gene expression is normalized by TPM. # denotes TFs with decreased or increased expression in T2D in both beta-1 and beta-2 cells, n = 6 nondiabetic, n = 8 pre-T2D, n = 6 T2D. e,f, Genome browser tracks showing aggregate RNA and ATAC read density at representative genes (RPL3, EEF2 and NDUFS6) downregulated in T2D relative to nondiabetic for both beta-1 and beta-2 cells (e). Genome browser tracks showing aggregate RNA and ATAC read density at representative genes (PDE4B, ATP8A1 and ABCC9) upregulated in T2D relative to nondiabetic for both beta-1 and beta-2 cells (f). Beta cell cCREs with binding sites for differential TFs in both beta-1 and beta-2 cells are shown. Differentially expressed genes in T2D beta cells are indicated by gray shaded boxes. All tracks are scaled to uniform 1 × 10⁶ read depth. g, Crossregulation between TFs with activity change in T2D in both beta cell subtypes (derived from Fig. 5c,d). The color code for TFs in nondiabetic, pre-T2D and T2D donors reflects their expression change during T2D progression.
Fig. 6 |
Fig. 6 |. T2D risk variants affect beta cell subtype chromatin accessibility.
a, Enrichment of fine-mapped T2D risk variants for cCREs defining the beta-1 and beta-2 subtypes. n = 4,653 and 3,029 differential cCREs for beta-1 and beta-2, respectively. Values represent log odds ratios and 95% confidence intervals. b, Enrichment of fine-mapped T2D risk variants for cCREs defining the beta-1 and beta-2 subtypes bound by each TF or not bound by any of the listed TFs (‘no TF’). n = 16,023, 16,129, 15,743, 26,478, 13,636 and 35,694 cCREs bound by HNF4G, HNF4A, HNF1A, NEUROD1, NFIA and TCF4, respectively. Permutation test, values represent log odds ratios and 95% confidence intervals. c,d, Fine-mapped T2D risk variant rs1617434 at the MPHOSPH9 locus overlaps a cCRE defining the beta-1 subtype. The T2D risk allele of this variant decreases beta-1 chromatin accessibility and disrupts a predicted binding site for HNF4A (c). Fine-mapped T2D risk variant rs6813185 at the TMEM154/FBXW7 locus overlaps a cCRE active in both the beta-1 and beta-2 subtypes. This variant has significant heterogeneity in allelic imbalance in beta-2 and beta-2 chromatin accessibility, where the T2D risk allele has larger effect in beta-2 cells than in beta-1 cells (d) (P = 0.024). The values for allelic imbalance represent the fraction of reads from the risk allele and the 95% confidence interval. Two-sided binomial proportion tests. On the left is a schematic describing allelic imbalance mapping in reads from the beta-1 and/ or beta-2 subtype. *P < 0.05. e, Schematic showing abundance and functional changes of beta cell subtypes during T2D progression. The TFs maintaining beta cell subtype identity as well as TFs mediating T2D-associated changes are shown.

Update of

References

    1. Noguchi GM & Huising MO Integrating the inputs that shape pancreatic islet hormone release. Nat. Metab 1, 1189–1201 (2019). - PMC - PubMed
    1. Wojtusciszyn A, Armanet M, Morel P, Berney T. & Bosco D. Insulin secretion from human beta cells is heterogeneous and dependent on cell-to-cell contacts. Diabetologia 51, 1843–1852 (2008). - PubMed
    1. Dominguez-Gutierrez G, Xin Y. & Gromada J. Heterogeneity of human pancreatic β-cells. Mol. Metab 27, S7–S14 (2019). - PMC - PubMed
    1. Benninger RKP & Kravets V. The physiological role of β-cell heterogeneity in pancreatic islet function. Nat. Rev. Endocrinol 18, 9–22 (2022). - PMC - PubMed
    1. Segerstolpe Å et al. Single-cell transcriptome profiling of human pancreatic islets in health and type 2 diabetes. Cell Metab. 24, 593–607 (2016). - PMC - PubMed

Publication types