. 2023 Jun;55(6):927-938.
doi: 10.1038/s41588-023-01398-8. Epub 2023 May 25.

The impact of rare protein coding genetic variation on adult cognitive function

Collaborators, Affiliations

The impact of rare protein coding genetic variation on adult cognitive function

Chia-Yen Chen et al. Nat Genet. 2023 Jun.

Abstract

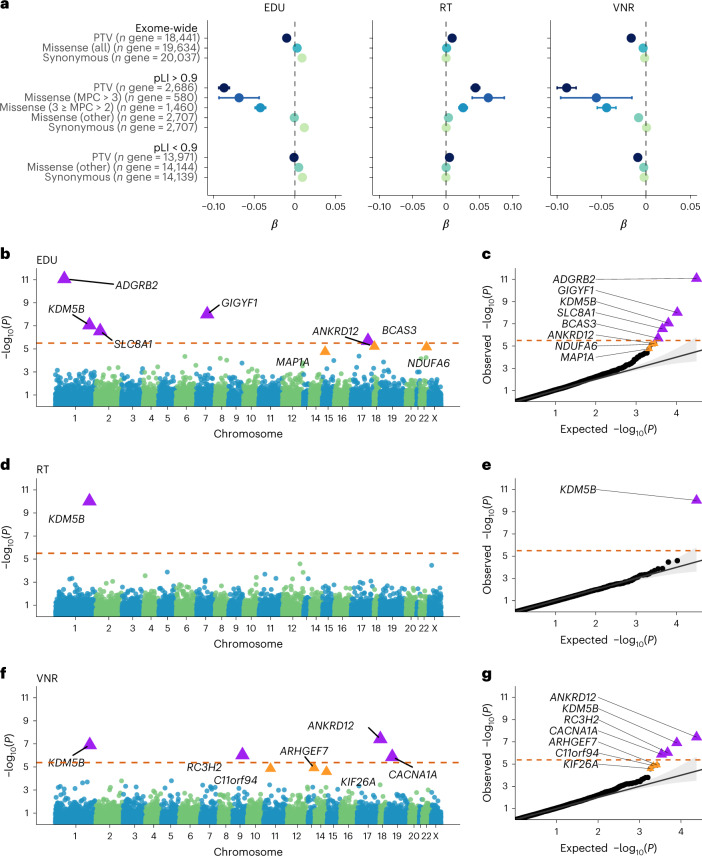
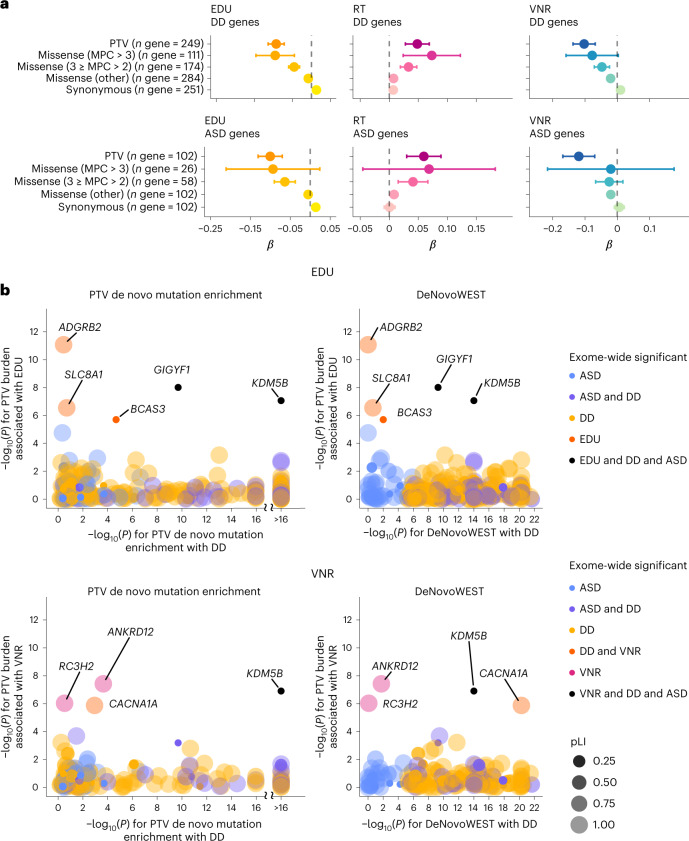
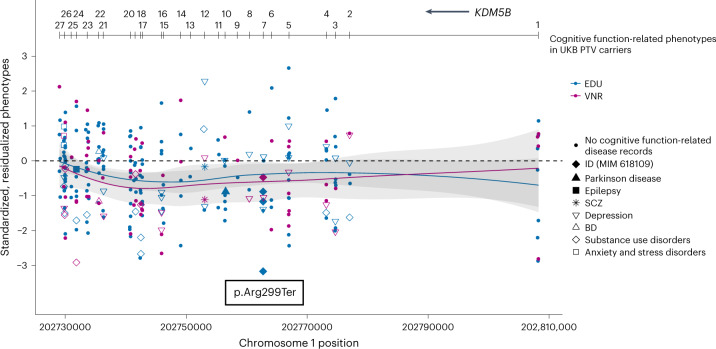
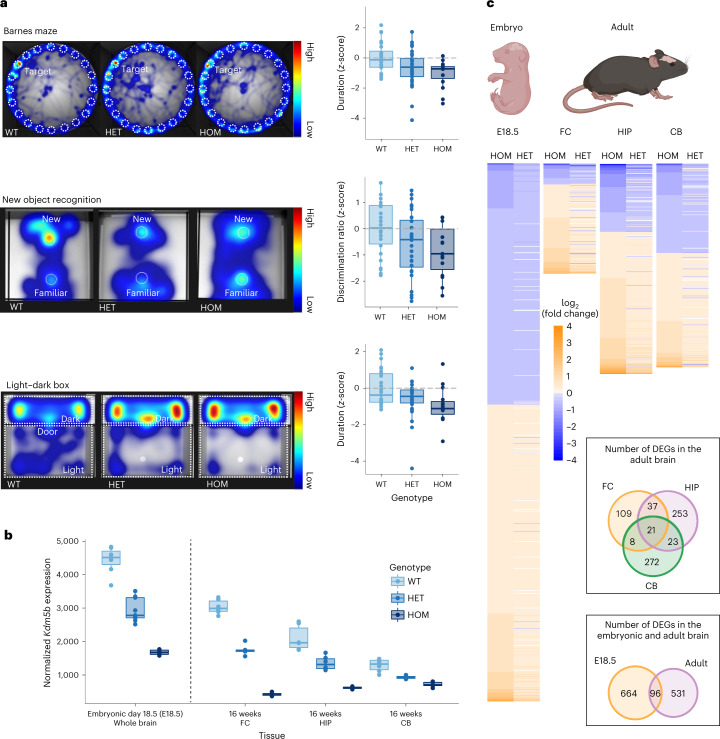
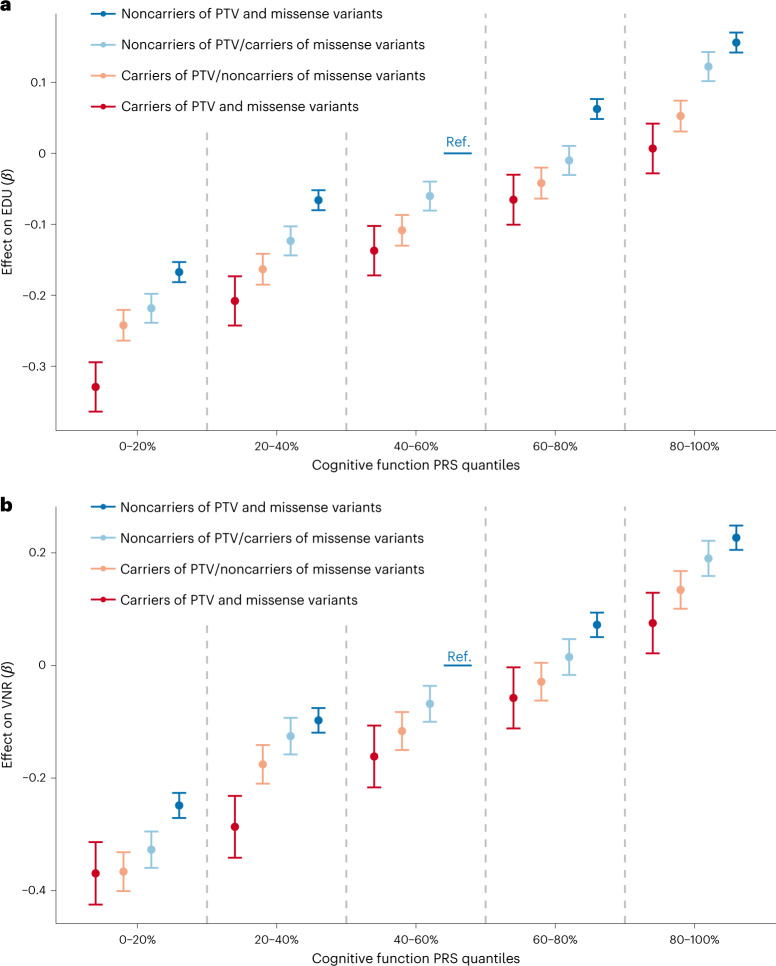
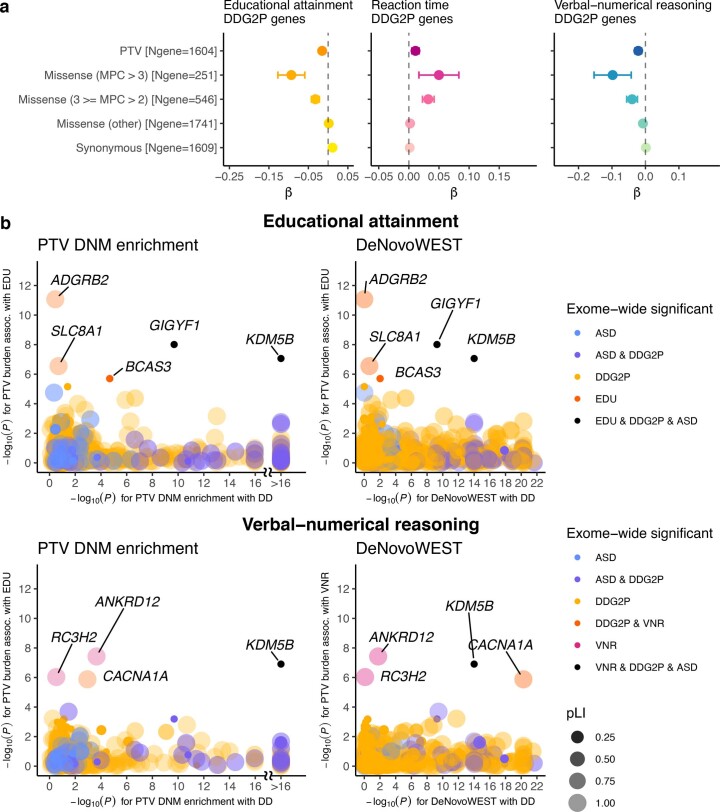
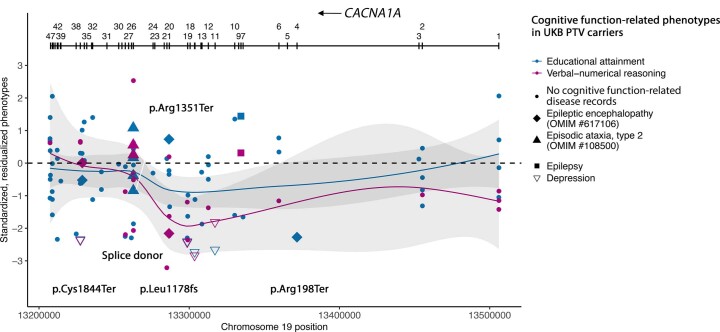
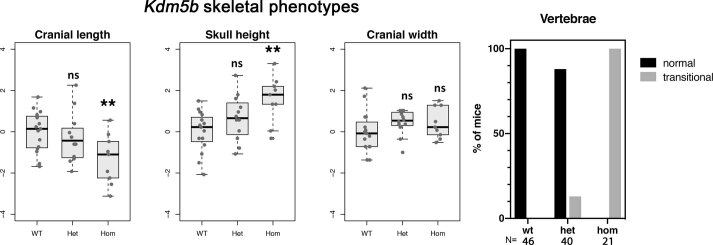
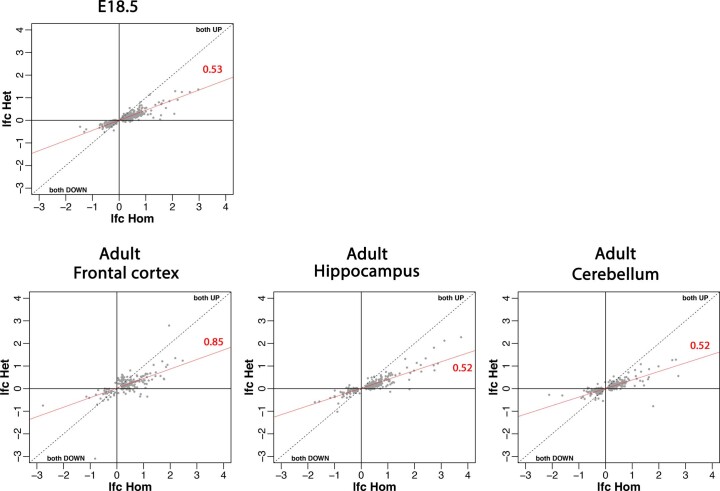
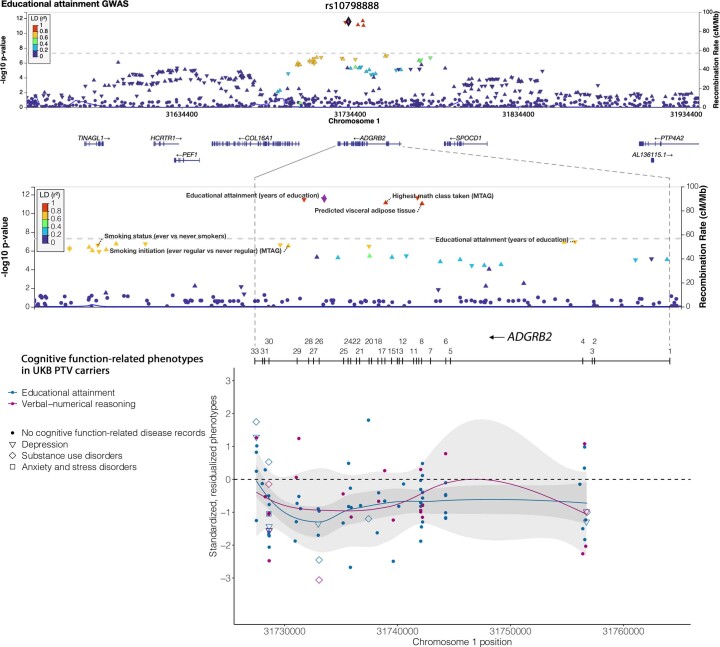
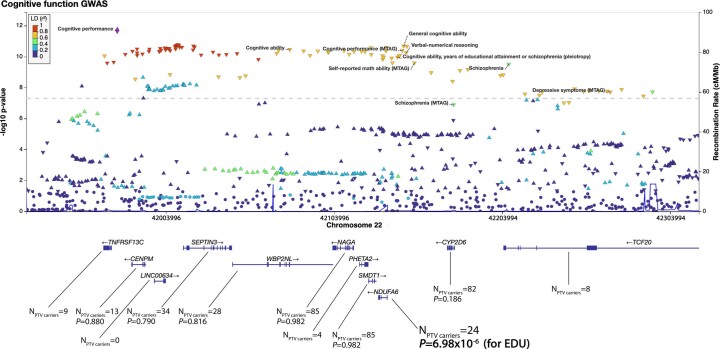
Compelling evidence suggests that human cognitive function is strongly influenced by genetics. Here, we conduct a large-scale exome study to examine whether rare protein-coding variants impact cognitive function in the adult population (n = 485,930). We identify eight genes (ADGRB2, KDM5B, GIGYF1, ANKRD12, SLC8A1, RC3H2, CACNA1A and BCAS3) that are associated with adult cognitive function through rare coding variants with large effects. Rare genetic architecture for cognitive function partially overlaps with that of neurodevelopmental disorders. In the case of KDM5B we show how the genetic dosage of one of these genes may determine the variability of cognitive, behavioral and molecular traits in mice and humans. We further provide evidence that rare and common variants overlap in association signals and contribute additively to cognitive function. Our study introduces the relevance of rare coding variants for cognitive function and unveils high-impact monogenic contributions to how cognitive function is distributed in the normal adult population.


Conflict of interest statement

C.-Y.C., T.F., E.A.T., H.R. and members of the Biogen Biobank team are employees of Biogen. R.T. is an employee of Dewpoint Therapeutics. J.Z.L. is an employee of GSK. M.E.H. is a cofounder, shareholder and nonexecutive director of Congenica, and an advisor to AstraZeneca. The other authors declare no competing interests.

Figures

Fig. 1
Fig. 1. Impact of exome-wide burden of rare protein-coding variants and gene discovery based on the PTV burden for EDU, RT and VNR in EUR samples in the UKB.
a, The effects of protein-truncating, missense (stratified by MPC) and synonymous variant burden on EDU, RT and VNR across the exome and stratified by genes intolerant (pLI ≥ 0.9) or tolerant (pLI < 0.9) to PTVs. Unrelated UKB EUR samples were included in this analysis (n = 318,844 for EDU, n = 319,536 for RT and n = 128,812 for VNR). pLI is the probability of being LOF-intolerant as recorded in the gnomAD database. Missense variants were classified according to deleteriousness (MPC) into three tiers: MPC > 3; 3 ≥ MPC > 2; and other missense variants not in the previous two tiers. The number of genes included in each burden was labeled. Data are presented as effect size estimates (β) with 95% confidence intervals (CIs). b, Exome-wide, gene-based PTV burden association for EDU (related UKB EUR sample n = 393,758). The −log10 P values (two-sided t-test) for each gene were plotted against the genomic position (Manhattan plot). The orange dashed line indicates the Bonferroni-corrected exome-wide significance level per phenotype (P < 0.05/15,782 = 3.17 × 10−6 for EDU). The purple triangles indicate Bonferroni-significant genes. The orange triangles indicate FDR-significant genes (FDR Q < 0.05). c, Observed −log10 P value (two-sided t-test) plotted against expected values (Q–Q plot) for exome-wide, gene-based PTV burden association for EDU. The orange dashed line indicates the Bonferroni-corrected exome-wide significance level per phenotype (P < 0.05/15,782 = 3.17 × 10−6 for EDU). d, Exome-wide, gene-based PTV burden association for RT (related UKB EUR sample n = 394,600). The −log10 P values (two-sided t-test) for each gene were plotted against the genomic position (Manhattan plot). The orange dashed line indicates the Bonferroni-corrected exome-wide significance level per phenotype (P < 0.05/15,798 = 3.16 × 10−6 for RT). e, Observed −log10 P value (two-sided t-test) plotted against the expected values (Q–Q plot) for exome-wide, gene-based PTV burden association for RT. The orange dashed line indicates the Bonferroni-corrected exome-wide significance level per phenotype (P < 0.05/15,798 = 3.16 × 10−6 for RT). f, Exome-wide, gene-based PTV burden association for VNR (related UKB EUR sample n = 159,026). The −log10 P values (two-sided t-test) for each gene were plotted against the genomic position (Manhattan plot). The orange dashed line indicates the Bonferroni-corrected exome-wide significance level per phenotype (P < 0.05/11,905 = 4.20 × 10−6 for VNR). g, Observed −log10 P value (two-sided t-test) plotted against the expected values (Q–Q plot) for exome-wide, gene-based PTV burden association for VNR. The orange dashed line indicates the Bonferroni-corrected exome-wide significance level per phenotype (P < 0.05/11,905 = 4.20 × 10−6 for VNR).
Fig. 2
Fig. 2. Impact of rare coding variants on cognitive function in DD and ASD genes.
a, The effects of protein-truncating, missense (stratified by MPC) and synonymous variant burden in the exome sequencing study identified DD and ASD genes on EDU, RT and VNR. Unrelated UKB EUR samples were included in this analysis (n = 318,844 for EDU, n = 319,536 for RT and n = 128,812 for VNR). Missense variants were classified according to deleteriousness (MPC) into three tiers: tier 1, MPC > 3; tier 2, 3 ≥ MPC > 2; tier 3 includes all missense variants not in tier 1 or 2. Data are presented as effect size estimates (β) with 95% CIs. b, Comparison between gene-based associations for DD, EDU and VNR (PTV de novo mutation enrichment tests (simulation-based test) and DeNovoWEST (simulation-based test) for DD; rare PTV burden association tests (two-sided t-test) for EDU and VNR). Each dot represents a gene that was identified for DD in Kaplanis et al. or for EDU or VNR in the current exome analysis. The dots are color-coded according to the phenotypes (DD, ASD, EDU and VNR) that the gene is significantly associated with exome-wide. The size and shade of the dots represent the pLI for the gene. EDU and VNR genes are labeled with gene names.
Fig. 3
Fig. 3. Phenotypic characterization of KDM5B in humans.
Distribution of EDU and VNR scores for KDM5B PTV carriers in the UKB. ClinVar probably pathogenic variants for IDD (MIM 618109) were annotated. Samples with inpatient ICD-10 records of psychiatric (SCZ, BD, depression, substance use disorder or anxiety and stress disorders), neurodegenerative and neurodevelopmental disorders were annotated. Phenotypes were residualized by sex, age, age2, sex by age, sex by age2, top 20 principal components and recruitment centers and were rank-based inverse-normal transformed. The blue (for EDU) and red (for VNR) lines represent fitted locally estimated scatterplot smoothing (LOESS) regression on standardized, residualized phenotypes. The gray bands represent 95% CIs for the fitted LOESS regression.
Fig. 4
Fig. 4. Kdm5b LoF alleles display a gene dosage effect on behavioral, cognitive and molecular phenotypes in mice.
a, Mice carrying Kdm5b LoF alleles showed a dose-dependent decrease in spatial memory performance (Barnes maze; two-sided Wald test based on an additive genetic effect with P = 0.012; Kdm5b+/− n = 34 (P = 0.031) and Kdm5b−/− n = 15 (P = 0.005) mice spent less time around the goalbox than WT controls, n = 24); showed a dose-dependent decrease in object recognition memory performance (new object recognition; two-sided Wald test based on an additive genetic effect with P = 0.042; Kdm5b+/− n = 32 (P = 0.038) and Kdm5b−/− n = 15 (P = 0.011) mice had reduced discrimination compared to WT controls, n = 26); and showed a dose-dependent increase in anxiety-related behavior (light–dark box; two-sided Wald test based on an additive genetic effect with P = 0.008; Kdm5b+/− n = 15 (P = 0.025) and Kdm5b−/− n = 34 (P = 0.004) mice spent less time in the light compared to WT controls). P values are based on two-sided Wald tests from a double generalized linear model (dglm v.1.8.5). For the box plot, the center line represents the median, the box limits represent the interquartile range (IQR) and the whiskers indicate the minimum and maximum values. The heatmaps show the relative time spent around various arenas during the trial period of each assay, as a composite of all mice of the same genotype (Barnes maze and light–dark box) or the trace for a single representative animal (new object recognition). Kdm5b+/− (HET) and Kdm5b−/− (HOM) mice spent less time around the goalbox (Barnes maze), showed reduced discrimination of the new object (new object recognition) and spent more time in the dark zone (light–dark box) compared with WT controls. b, Normalized RNA-seq read counts of Kdm5b gene expression in WT, Kdm5b+/− and Kdm5b−/− mice across embryonic and adult tissues as indicated (n = 7 for WT, n = 7 for Kdm5b+/− HET and n = 8 for Kdm5b−/− HOM embryonic mice whole brain; n = 6, 5 and 6 for the FC of WT, HET and HOM adult mice; n = 6, 6 and 6 for the HIP of WT, HET and HOM adult mice; n = 6, 6 and 6 for the CB of WT, HET and HOM adult mice). For the box plot, the center line represents the median, the box limits represent the IQR and the whiskers indicate the minimum and maximum values. c, Heatmap of expression changes (log2 fold change) in DEGs in Kdm5b+/− (HET) and Kdm5b−/− (HOM) mice across embryonic and adult tissues as indicated. There is a strong correlation between direction of change in expression in both mutant genotypes. The Venn diagrams show the overlap of DEGs in both Kdm5b+/− and Kdm5b−/− mice across tissues and stages. Created with BioRender.com. Source data
Fig. 5
Fig. 5. Contribution of common and rare coding variants to EDU and VNR.
a,b, The impact of cognitive function PRS and carrier status of PTV or damaging missense variants (MPC > 2) in LOF-intolerant genes (pLI > 0.9) on EDU (a) and VNR (b). Unrelated UKB EUR samples were included in this analysis with n = 318,844 for EDU and n = 128,812 for VNR. EDU and VNR were residualized by sex, age, age2, sex by age, sex by age2, top 20 principal components and recruitment centers and rank-based inverse-normal transformed. The effect (and 95% CI) of PRS and rare coding variant carrier status on residualized, transformed EDU/VNR was estimated using linear regression, with noncarriers of PTV and damaging missense variants with PRS in the middle quantile as the reference (Ref.) group. Data are presented as effect size estimates (β) with 95% CIs.
Extended Data Fig. 1
Extended Data Fig. 1. PTV burden-based phenome-wide association analysis (3,150 phenotypes) for KDM5B in the UK Biobank unrelated European samples (N = 321,843).
FEV1 Z-score is Inverted GLI 2012 z-score for FEV1. Phenotypes were grouped and color-coded from left to right in the following categories: biomarker; composite phenotypes; family history; ICD-10 cause of death, ICD-10 congenital malformations; deformations and chromosomal abnormalities; ICD-10 diseases of the circulatory system; ICD-10 diseases of the digestive system; ICD-10 diseases of the eye and adnexa; ICD-10 diseases of the genitourinary system; ICD-10 diseases of the musculoskeletal system and connective tissue; ICD-10 diseases of the nervous system; ICD-10 diseases of the respiratory system; ICD-10 diseases of the skin and subcutaneous tissue; ICD-10 endocrine, nutritional and metabolic diseases; ICD-10 mental, behavioral and neurodevelopmental disorders; ICD-10 neoplasms; ICD-10 pregnancy, childbirth and the puerperium; ICD-10 symptoms, signs and abnormal clinical and laboratory findings, not elsewhere classified; operation code; self-reported illness: cancer; self-reported illness: non−cancer; self-reported medication. Bonferroni corrected p-value (two-sided t-test) significance threshold was 0.05/3150 = 1.59×10⁻⁵.
Extended Data Fig. 2
Extended Data Fig. 2. Impact of rare coding variants in genes identified in the Developmental Disorder Genotype - Phenotype Database (DDG2P) on cognitive function.
a. The effects of protein-truncating, missense (stratified by MPC) and synonymous variant burden in exome sequencing study identified DDG2P on EDU, RT and VNR. Unrelated UKB EUR samples were included for this analysis (N = 318,844 for EDU, 319,536 for RT, and 128,812 for VNR). DDG2P database (https://www.deciphergenomics.org/ddd/ddgenes) was accessed on December 23, 2020. Missense variants were classified by deleteriousness (MPC) into 3 tiers: tier 1 with MPC > 3; tier 2 with 3 ≥ MPC > 2; tier 3 includes all missense variants not in tier 1 or 2. We note that the effect of damaging missense variants out scaled that of PTV burden for DDG2P genes. This is most likely explained by UKB participants being depleted for highly penetrant PTVs in this gene set that cause disease onset in childhood. Data are presented in effect size estimates (β) with 95% confidence intervals. b. Comparison between gene-based associations for genes from DDG2P database, EDU and VNR (PTV DNM enrichment [simulation-based test] and DeNovoWEST [simulation-based test] for DD; rare PTV burden associations [two-sided t-test] for EDU and VNR). Each dot represents a gene that is identified for DD in Kaplanis et al. 2020 and for EDU or VNR in the current exome analysis. The dots are color-coded according to the phenotypes (DD, ASD, or EDU) that the gene is exome-wide significantly associated with. The size and shade of the dots are representing the pLI for the gene. EDU and VNR genes are labeled with gene names.
Extended Data Fig. 3
Extended Data Fig. 3. Distribution of cognitive phenotypes (educational attainment and verbal-numerical reasoning) for CACNA1A PTV carriers.
ClinVar pathogenic/likely pathogenic variants for epileptic encephalopathy (MIM 617106) and/or type 2 episodic ataxia (MIM 108500) was annotated. Samples with inpatient ICD-10 (International Classification of Diseases version-10) records of psychiatric (schizophrenia, bipolar disorder, depression, substance use disorder and/or anxiety and stress disorders), neurodegenerative and neurodevelopmental disorders were annotated. Phenotypes were residualized by sex, age, age2, sex by age interaction, sex by age2 interaction, top 20 PCs, and recruitment center and inverse rank-based normal transformed. The blue line (for EDU) and red line (for VNR) represent fitted loess regression on standardized, residualized phenotypes. The gray bands represent 95% confidence intervals for the fitted loess regression.
Extended Data Fig. 4
Extended Data Fig. 4. Kdm5b loss-of-function impacts craniofacial and skeletal features in mice in a dose-dependent manner.
An intermediate effect on cranial length (additive genotype effect two-sided P = 0.0268) and height (additive genotype effect two-sided P = 0.0056) is detected in Kdm5b+/− mice, but not in cranial width (additive genotype effect two-sided P = 0.3090). For the boxplot, the center line represents the median, the box limits represent the IQR, and the whiskers indicate the minimum and maximum values. A fully penetrant transitional vertebrae phenotype seen in Kdm5b−/− mice (N = 21) is observed at a lower frequency in Kdm5b+/− mice (N = 40, Fisher’s exact test vs Kdm5b+/+ two-sided P = 0.0189). Source data
Extended Data Fig. 5
Extended Data Fig. 5. Correlation in differential gene expression between heterozygous and homozygous Kdm5b mutant mice.
Log2-fold change of differentially expressed genes plotted for Kdm5b+/ (y-axis) and Kdm5b−/− (x-axis) mice across embryonic and adult brain tissues as indicated. There is a strong correlation between direction of change in expression in both mutant genotypes (robust linear regression line and slope shown in red).
Extended Data Fig. 6
Extended Data Fig. 6. Overlap between educational attainment GWAS (Lee et al.) locus on chromosome 1 and ADGBR2 identified in PTV burden analysis in UKB.
Regional plot of educational attainment GWAS association test results were generated around top independent SNP rs10798888. Additional associations from GWAS catalog were annotated with the associated phenotypes in the regional plot. EDU and VNR score for ADGRB2 PTV carriers in UKB were plotted (both phenotypes were residualized by sex, age, age2, sex by age, sex by age2, top 20 PCs and recruitment centers and were inverse rank-based normal transformed). Samples with inpatient ICD-10 (International Classification of Diseases version-10) records of psychiatric, neurodegenerative, and neurodevelopmental disorders were annotated. The blue line (for EDU) and red line (for VNR) represent fitted loess regression on standardized, residualized phenotypes. The gray bands represent 95% confidence intervals for the fitted loess regression.
Extended Data Fig. 7
Extended Data Fig. 7. Overlap between cognitive function GWAS (Lam et al.) locus on chromosome 22 and NDUFA6 identified in PTV burden analysis in UKB (FDR significant for EDU).
Regional plot of cognitive function GWAS association test results were generated for top independent SNP rs5751191 and the extended LD region. Additional associations from GWAS catalog were annotated with the associated phenotypes in the regional plot. Number of PTV carriers and gene-based PTV burden association p-value were extracted for genes in the region.
Extended Data Fig. 8
Extended Data Fig. 8. The effects of protein-truncating, missense (stratified by MPC) and synonymous variant burden in genes stratified by brain-specific expression.
Unrelated UKB EUR samples were included for this analysis (N = 318,844 for EDU, 319,536 for RT, and 128,812 for VNR). Genes were stratified by elevated expression in brain tissue (2,587 genes), elevated expression in other tissues but also expressed in brain (5,298 genes) and no tissue specific expression (8,342 genes). Number of genes included in the burden is annotated for each set. Data are presented in effect size estimates (β) with 95% confidence intervals.
Extended Data Fig. 9
Extended Data Fig. 9. The impact of cognitive function polygenic score and carrier status of PTV and/or damaging missense variants (MPC > 2) in LoF intolerant genes (pLI > 0.9) on a) educational attainment and b) verbal-numerical reasoning.
The impact of cognitive function polygenic score (PRS) and carrier status of PTV and/or damaging missense variants (MPC > 2) in LoF intolerant genes (pLI > 0.9) on a) EDU and b) VNR. EDU and VNR were residualized by sex, age, age2, sex by age, sex by age2, top 20 PCs and recruitment centers and inverse rank-based normal transformed. Median of educational attainment was calculated for individuals stratified by PRS quantiles (in 2% groups) and PTV and/or damaging missense variant carrier status. The blue and red lines represent fitted linear regressions for standardized, residualized phenotypes by PRS percentile groups, stratified by rare coding variant carrier status. The gray bands represent 95% confidence intervals for each of the fitted linear regression.

References

    1. Lam M, et al. Large-scale cognitive GWAS meta-analysis reveals tissue-specific neural expression and potential nootropic drug targets. Cell Rep. 2017;21:2597–2613. - PMC - PubMed
    1. Davies G, et al. Study of 300,486 individuals identifies 148 independent genetic loci influencing general cognitive function. Nat. Commun. 2018;9:2098. - PMC - PubMed
    1. Savage JE, et al. Genome-wide association meta-analysis in 269,867 individuals identifies new genetic and functional links to intelligence. Nat. Genet. 2018;50:912–919. - PMC - PubMed
    1. Lam M, et al. Identifying nootropic drug targets via large-scale cognitive GWAS and transcriptomics. Neuropsychopharmacology. 2021;46:1788–1801. - PMC - PubMed
    1. Lee JJ, et al. Gene discovery and polygenic prediction from a genome-wide association study of educational attainment in 1.1 million individuals. Nat. Genet. 2018;50:1112–1121. - PMC - PubMed

Publication types

LinkOut - more resources