. 2023 May 25;7(1):48.
doi: 10.1038/s41698-023-00384-x.

PD-1 blockade potentiates neoadjuvant chemotherapy in NSCLC via increasing CD127+ and KLRG1+ CD8 T cells

Affiliations

PD-1 blockade potentiates neoadjuvant chemotherapy in NSCLC via increasing CD127+ and KLRG1+ CD8 T cells

Zhenzhen Hui et al. NPJ Precis Oncol. .

Abstract

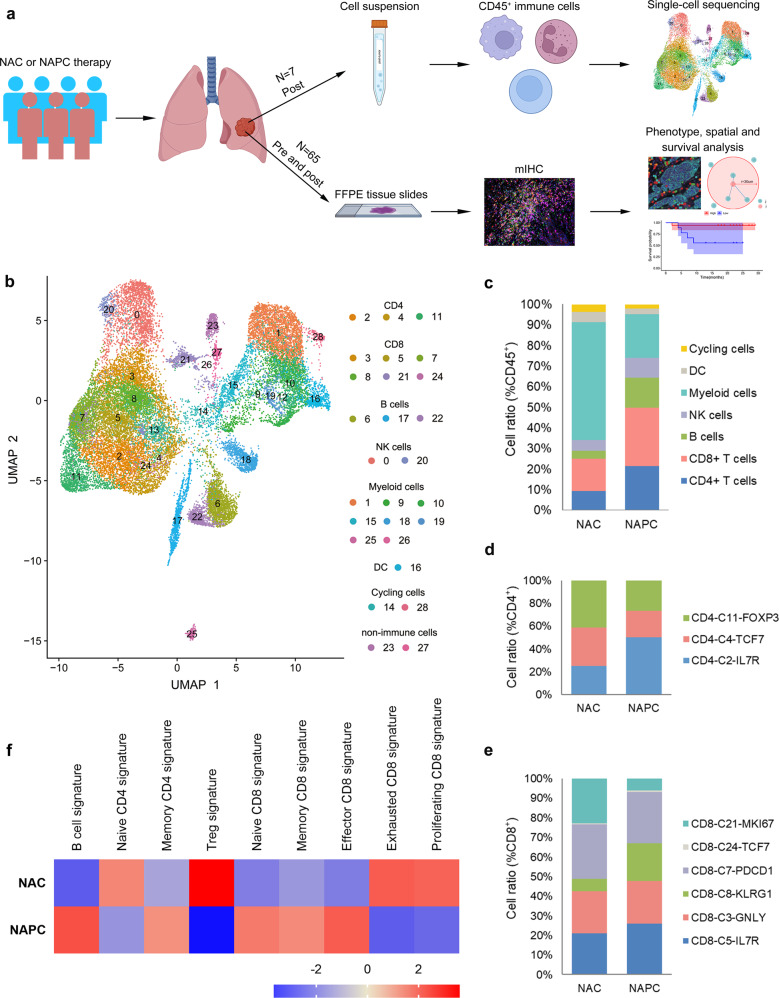
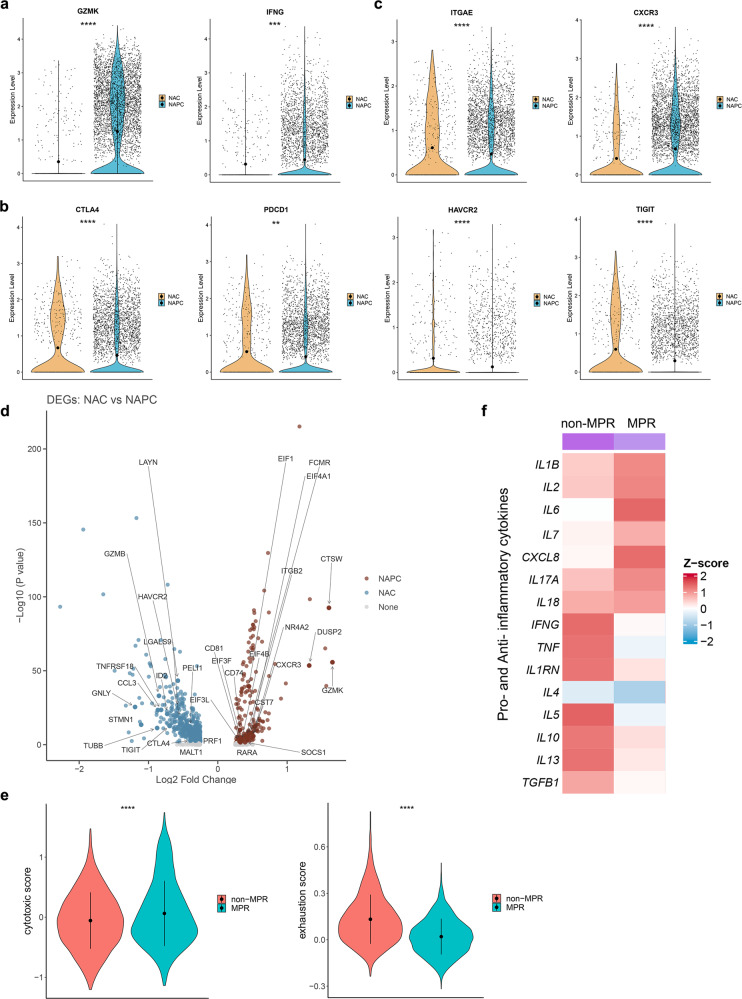
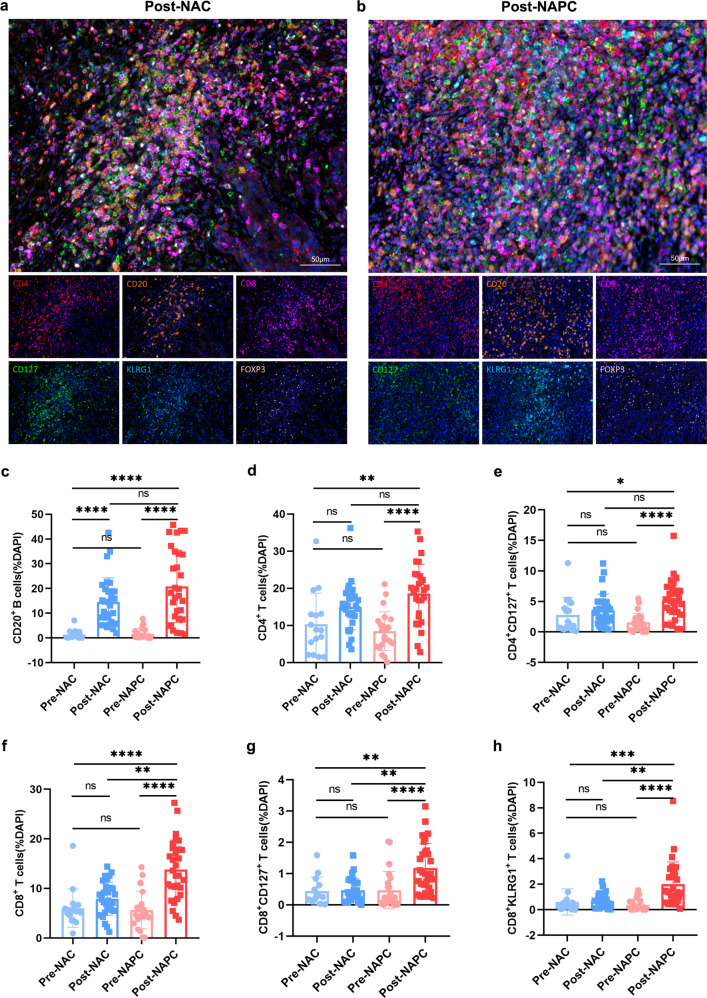
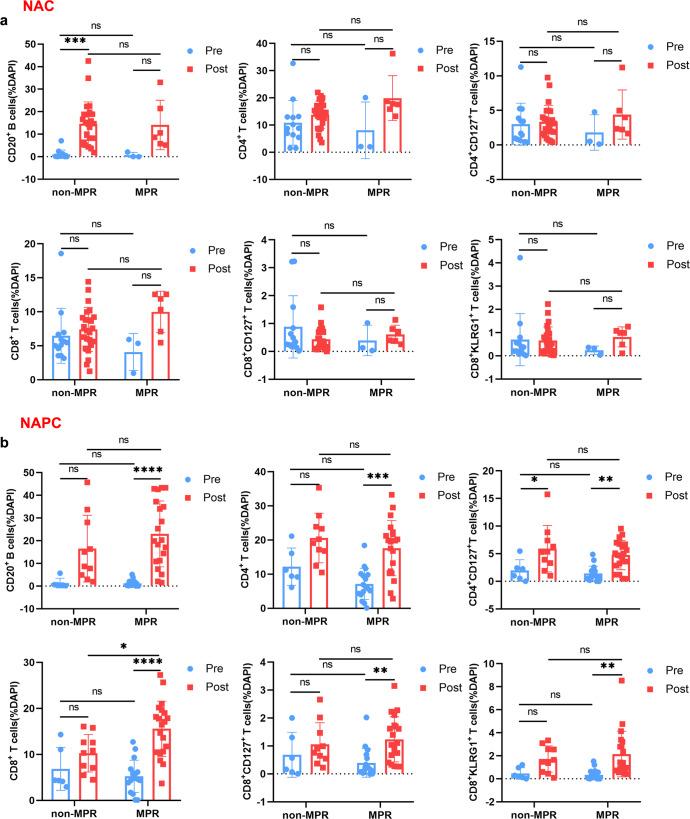
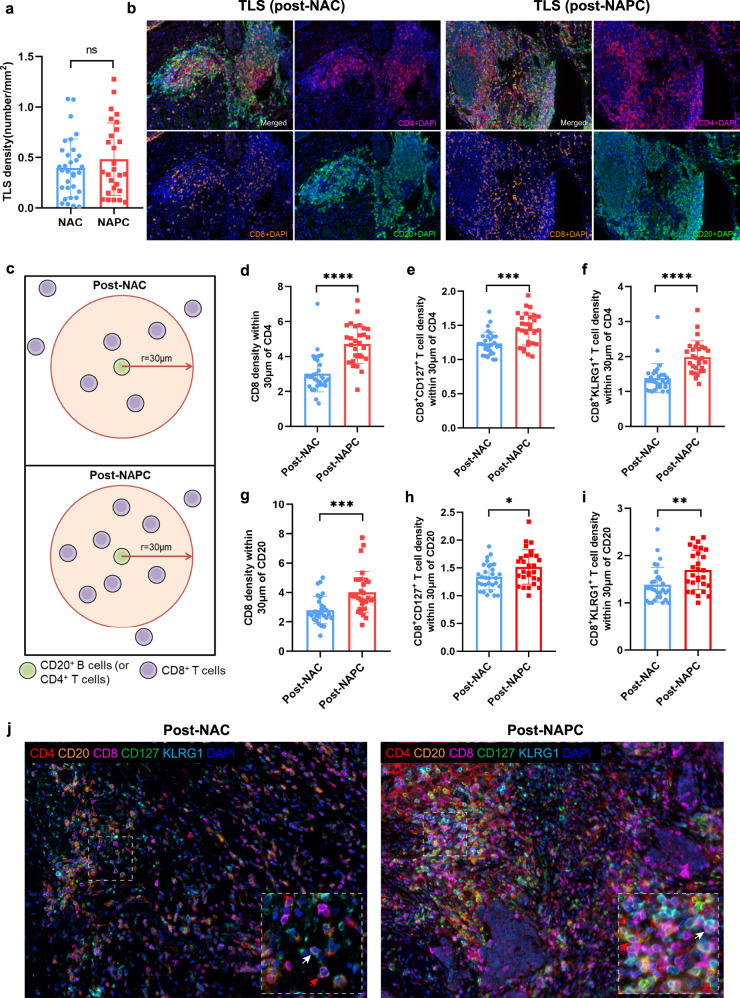
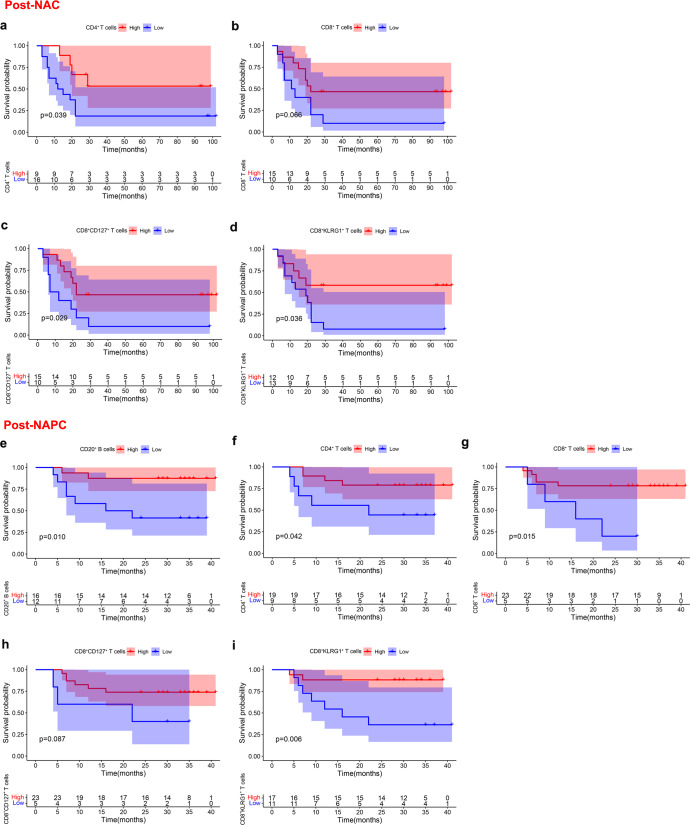
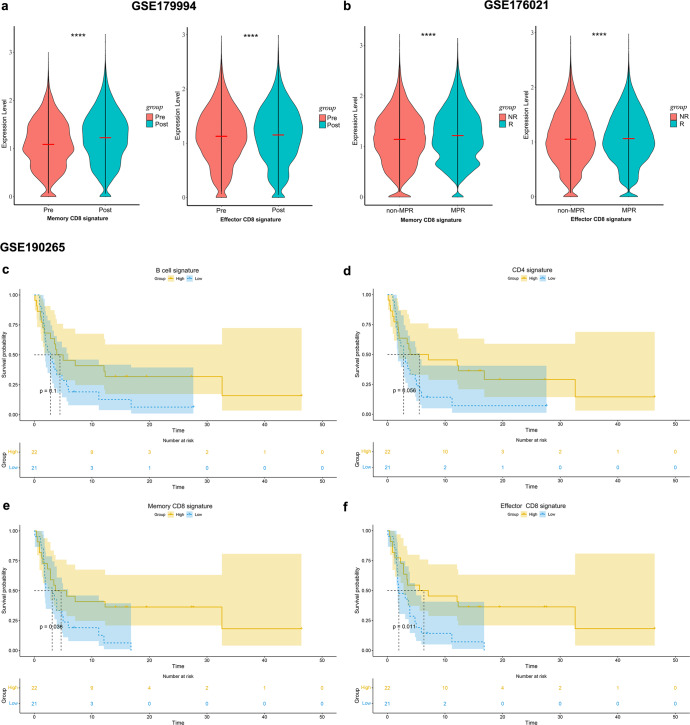
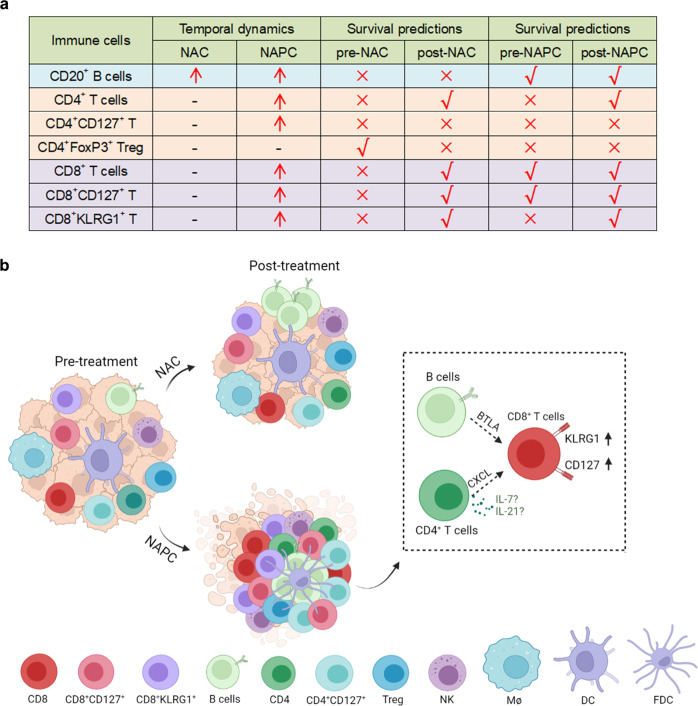
The combination of PD-1 blockade with neoadjuvant chemotherapy (NAC) has achieved unprecedented clinical success in non-small cell lung cancer (NSCLC) compared to NAC alone, but the underlying mechanisms by which PD-1 blockade augments the effects of chemotherapy remain incompletely elucidated. Single-cell RNA sequencing was performed on CD45+ immune cells isolated from surgically resected fresh tumors of seven NSCLC patients receiving NAC or neoadjuvant pembrolizumab and chemotherapy (NAPC). Multiplex fluorescent immunohistochemistry was performed on FFPE tissues before and after NAC or NAPC from 65 resectable NSCLC patients, and results were validated with GEO dataset. NAC resulted in an increase only of CD20+ B cells, whereas NAPC increased the infiltration of CD20+ B cells, CD4+ T cells, CD4+CD127+ T cells, CD8+ T cells, CD8+CD127+ and CD8+KLRG1+ T cells. Synergistic increase in B and T cells promotes favorable therapeutic response after NAPC. Spatial distribution analysis discovered that CD8+ T cells and their CD127+ and KLRG1+ subsets were in closer proximity to CD4+ T/CD20+ B cells in NAPC versus NAC. GEO dataset validated that B-cell, CD4, memory, and effector CD8 signatures correlated with therapeutic responses and clinical outcomes. The addition of PD-1 blockade to NAC promoted anti-tumor immunity through T and B cells recruitment in the tumor microenvironment and induced tumor-infiltrating CD8+ T cells skewed toward CD127+ and KLRG1+ phenotypes, which may be assisted by CD4+ T cells and B cells. Our comprehensive study identified key immune cell subsets exerting anti-tumor responses during PD-1 blockade therapy and that may be therapeutically targeted to improve upon existing immunotherapies for NSCLC.


Conflict of interest statement

The authors declare no competing interests.

Figures

Fig. 1
Fig. 1. Single-cell map of immune cells from NSCLC patients treated with neoadjuvant NAC and NAPC therapy.
a Schematic overview of the study design (Created with BioRender.com). CD45+ immune cells isolated from surgical resected fresh tumors of seven patients receiving two cycles NAC or NAPC were subjected to single-cell sequencing. Paired FFPE tissues at biopsy before neoadjuvant therapy and at surgery after neoadjuvant therapy were collected for mIHC staining. b UMAP display of immune cells in NSCLC patients treated with neoadjuvant NAC and NAPC therapy. Each dot corresponds to one single cell, colored according to cell cluster. c Immune cell composition in neoadjuvant NAC and NAPC therapy. de Comparison of CD4+ T cell and CD8+ T cell clusters proportions between NAC and NAPC groups. f GSEA analysis of different lymphocyte subpopulation signatures in NAC and NAPC.
Fig. 2
Fig. 2. Transcriptome profiling of CD8+ T-cell clusters after neoadjuvant therapy.
ac Violin plot showing functional gene expression levels of tumor-infiltrating CD8+ T cells in NAC and NAPC. Data are presented as mean. d Volcano plot showing comparison of DEGs of CD8+ T cells between NAC and NAPC. Inclusion criteria: Log2FC > 0.25, p < 0.05, min.pct > 0.1. e Comparison of CD8 cytotoxic score and exhausted score between non-MPR and MPR in NAPC estimated by the “AddModuleScore” function in Seurat. Data are presented as mean ± SD. f Heatmap displayed the expression levels of pro- and anti-inflammatory cytokines in tumor tissues of non-MPR and MPR patients.
Fig. 3
Fig. 3. CD8+ T cells and their CD127+ and KLRG1+ subsets were enriched in NAPC.
a, b Representative mIHC staining image of post-treatment samples in the NAC and NAPC groups (Image taken under 20X). ch Comparison of CD20+ B cells, CD4+ T cells, CD4+CD127+ T cells, CD8+ T cells, CD8+CD127+ T cells, and CD8+KLRG1+ T cells in pre- and post-treatment samples in the NAC and NAPC groups. Pre-NAC: n = 16, Post-NAC: n = 30, Pre-NAPC: n = 23, Post-NAPC: n = 30. Data are presented as mean ± SD. P values were determined by Kruskal-Wallis test, * P < 0.05; ** P < 0.01; *** P < 0.001; **** P < 0.0001 ns not significant.
Fig. 4
Fig. 4. Comparison of TILs in non-MPR and MPR patients before and after treatment in NAC and NAPC groups.
a Comparison of TILs in non-MPR and MPR patients pre- and post-treatment in NAC. b Comparison of TILs in non-MPR and MPR patients pre- and post-treatment in NAPC. NAC: Pre-NR n = 13, Post-NR n = 24, Pre-R n = 3, Post-R n = 6; NAPC: Pre-NR n = 6, Post-NR n = 10, Pre-R n = 17, Post-R n = 20. Data are presented as mean ± SD. P values were determined by two-way ANOVA with multiple comparisons, * P < 0.05; ** P < 0.01; *** P < 0.001; **** P < 0.0001; ns not significant. NR, non-MPR; R, MPR.
Fig. 5
Fig. 5. Spatial distribution patterns of CD8+ T cells and CD4+ T/CD20+ B cells.
a The TLS density was slightly higher in post-NAPC than post-NAC. b Representative TLSs in post-treatment samples of NAC and NAPC. The TLSs in post-NAC were smaller and mostly located in the periphery of the tumor which presented like lymphoid aggregates, while the TLSs in post-NAPC were mature, organized TLSs with defined T cell/B cell zones. c Depiction of methodology for spatial analyses performed. Densities of interest cell being within a certain radius to a reference cell were calculated. df More CD8+ T cells, CD8+CD127+ T cells and CD8+ KLRG1+ T cells are present within 30um of CD4+ T cells in NAPC patients. gi More CD8+ T cells, CD8+CD127+ T cells and CD8+ KLRG1+ T cells are present within 30um of CD20+ B cells in NAPC patients. j Representative NAC and NAPC images showing the distance distribution of CD4+ T cells, CD20+ B cells and CD8+ T cells, white arrows point to CD8+KLRG1+ T cells, red arrows point to CD8+CD127+ T cells (Image taken under 20X). Post-NAC: n = 30, Post-NAPC: n = 30. Data are presented as mean ± SD. P values were determined by Mann-Whitney test, *P < 0.05; **P < 0.01; ***P < 0.001; ****P < 0.0001.
Fig. 6
Fig. 6. Correlation of post-treatment TILs with clinical outcome.
ad Kaplan–Meier estimates of DFS for NAC patients according to the post-treatment level of CD4+ T cells, CD8+ T cells, CD8+CD127+ T cells and CD8+KLRG1+ T cells. ei Kaplan–Meier estimates of DFS for NAPC patients according to the post-treatment level of CD20+ B cells, CD4+ T cells, CD8+ T cells, CD8+CD127+ T cells and CD8+KLRG1+ T cells. Patients were divided into high and low groups using “survminer” package of the R software.
Fig. 7
Fig. 7. Memory and effector CD8+ T cell signatures associated with therapeutic response and prognosis.
a The abundance of memory and effector CD8 signatures before and after PD-1 blockade plus chemotherapy in NSCLC dataset (GSE179994). Data are presented as mean. b The abundance of memory and effector CD8 signatures in non-MPR and MPR after neoadjuvant nivolumab for resectable NSCLC (GSE176021). Data are presented as mean. cf Kaplan–Meier estimates of progression-free survival (PFS) for B-cell signature, CD4 signature, as well as memory and effector CD8 signatures in NSCLC patients receiving PD-1 blockade monotherapy (GSE190265). Patients were classified into highly infiltrated patients (ES ≥ median value) and low infiltrated patients (ES < median value) according to median ES in survival analysis.
Fig. 8
Fig. 8. Summary of immune cell phenotypes and dynamics before and after NAC and NAPC therapy.
a Temporal dynamics and survival predictions of key immune cell subsets following different treatments. Red arrows indicate elevated post-treatment cell ratios, right symbols indicate cell ratios with survival predictive value, and wrong symbols indicate cell ratios with no survival predictive value. b Immune features in NAC and NAPC tumors and their dynamics following different treatment regimens (Created with BioRender.com). NAC resulted in an increase only of CD20+ B cells, whereas NAPC promoted synergistic increases in CD20+ B cells, CD4+ T cells, CD4+CD127+ T cells, CD8+ T cells, CD8+CD127+ T cells, and CD8+KLRG1+ T cells. Treg cells did not differ before and after treatment in both NAC and NAPC groups. CD4+ T and CD20+ B cells may recruit CD8 to neighborhood via the CXCL signaling pathway and promote CD8+ T cells shifted toward CD127+ and KLRG1+ phenotypes via cytokines (such as IL-7, IL-21) or receptor-ligand interactions.

References

    1. Siegel RL, Miller KD, Fuchs HE, Jemal A. Cancer statistics, 2022. CA: a Cancer J. Clin. 2022;72:7–33. - PubMed
    1. Molina JR, Yang P, Cassivi SD, Schild SE, Adjei AA. Non-small cell lung cancer: epidemiology, risk factors, treatment, and survivorship. Mayo Clin. Proceed. 2008;83:584–594. doi: 10.1016/S0025-6196(11)60735-0. - DOI - PMC - PubMed
    1. Pfannschmidt J, Muley T, Bülzebruck H, Hoffmann H, Dienemann H. Prognostic assessment after surgical resection for non-small cell lung cancer: experiences in 2083 patients. Lung Cancer. 2007;55:371–377. doi: 10.1016/j.lungcan.2006.10.017. - DOI - PubMed
    1. Preoperative chemotherapy for non-small-cell lung cancer: a systematic review and meta-analysis of individual participant data. Lancet (London, England)383, 1561–1571 (2014). - PMC - PubMed
    1. Provencio M, et al. Neoadjuvant chemotherapy and nivolumab in resectable non-small-cell lung cancer (NADIM): an open-label, multicentre, single-arm, phase 2 trial. Lancet. Oncol. 2020;21:1413–1422. doi: 10.1016/S1470-2045(20)30453-8. - DOI - PubMed