. 2023 Jun;25(6):877-891.
doi: 10.1038/s41556-023-01152-6. Epub 2023 May 25.

Divergent metabolic programmes control two populations of MAIT cells that protect the lung

Affiliations

Divergent metabolic programmes control two populations of MAIT cells that protect the lung

Thomas Riffelmacher et al. Nat Cell Biol. 2023 Jun.

Abstract

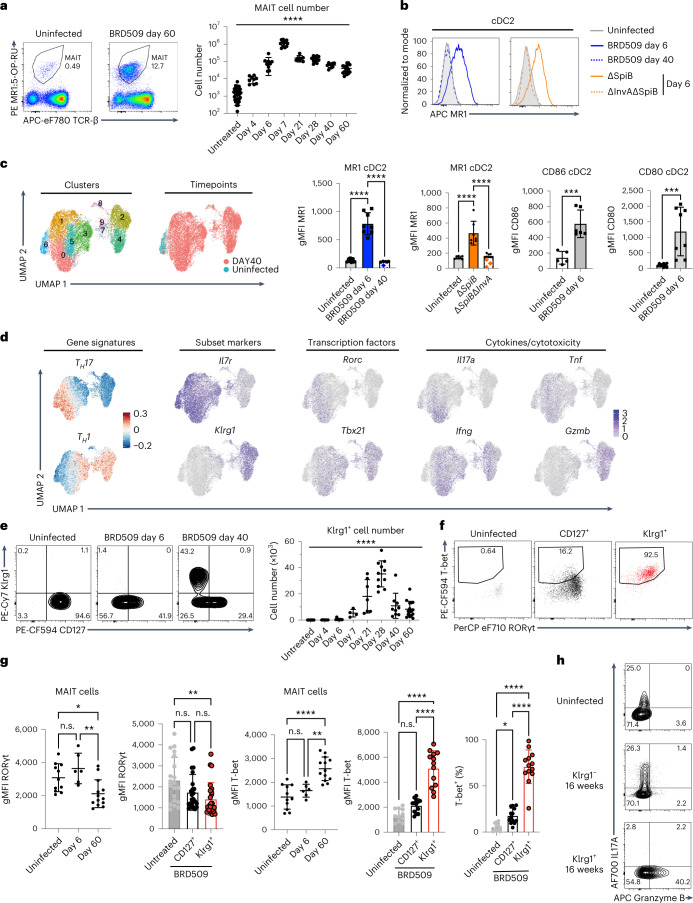
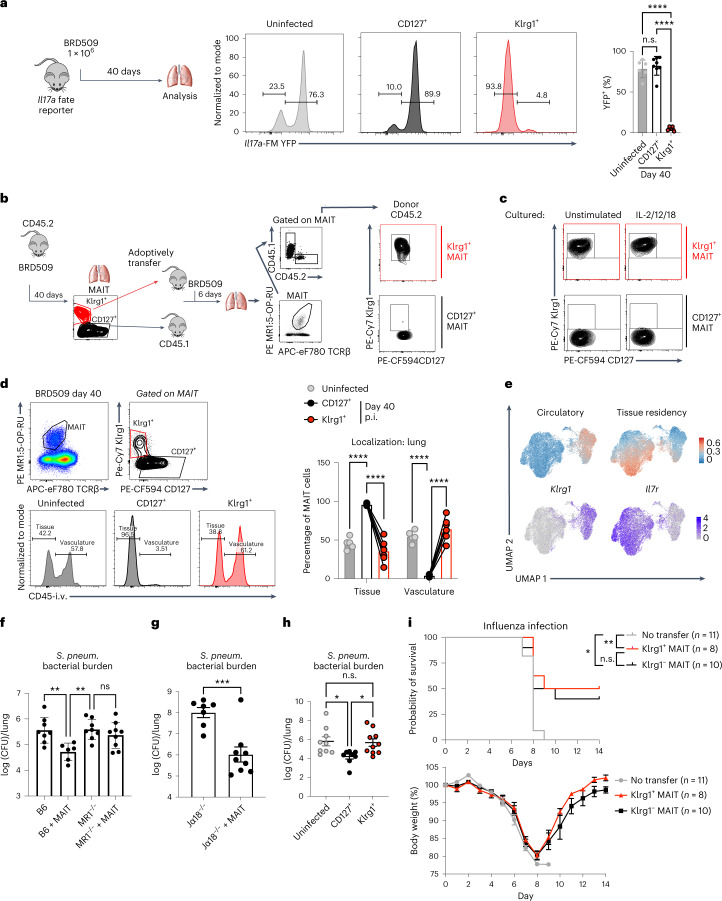
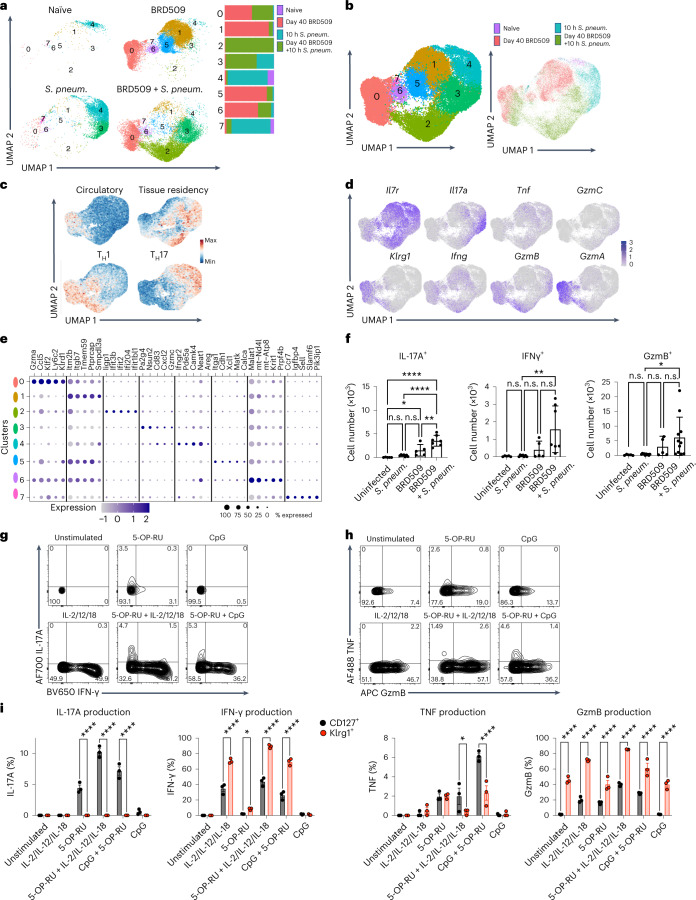
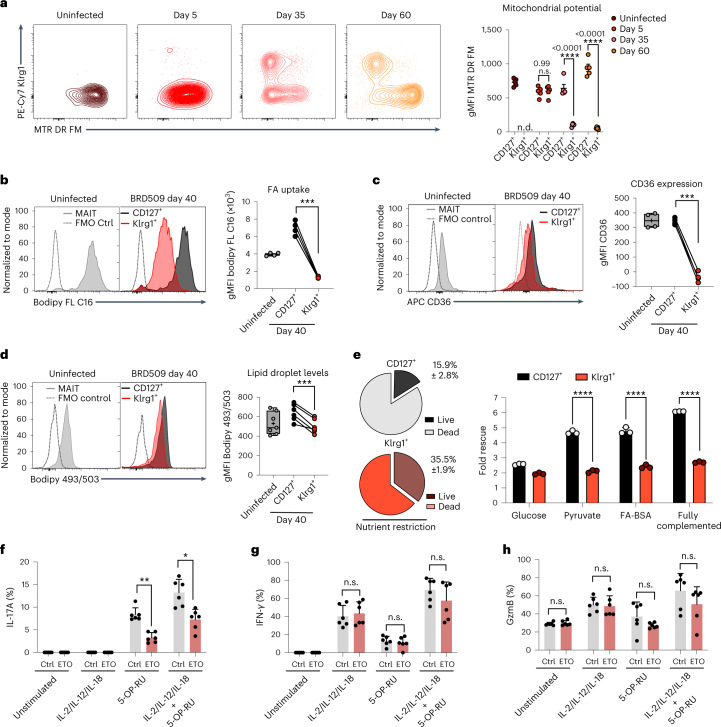
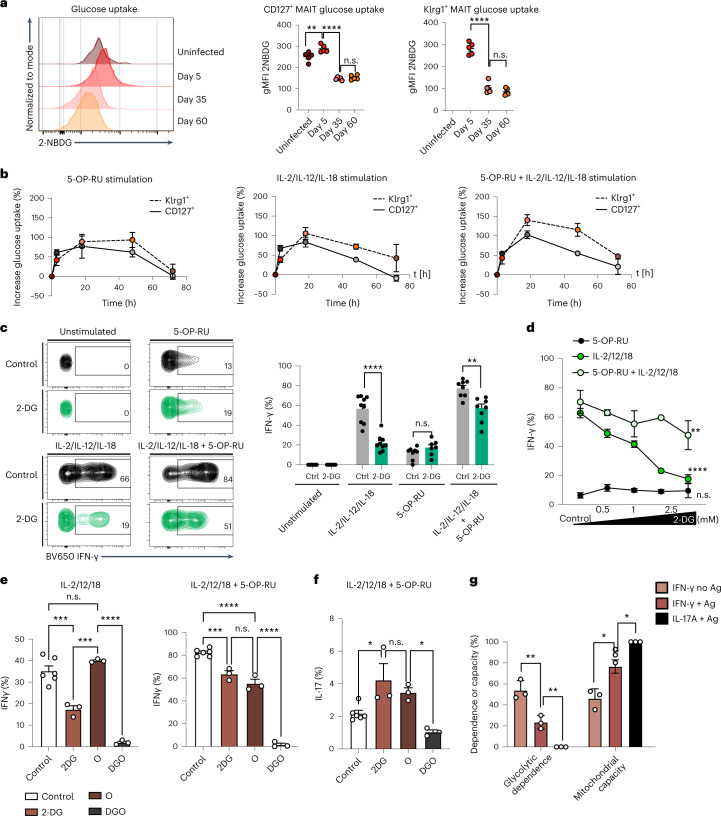
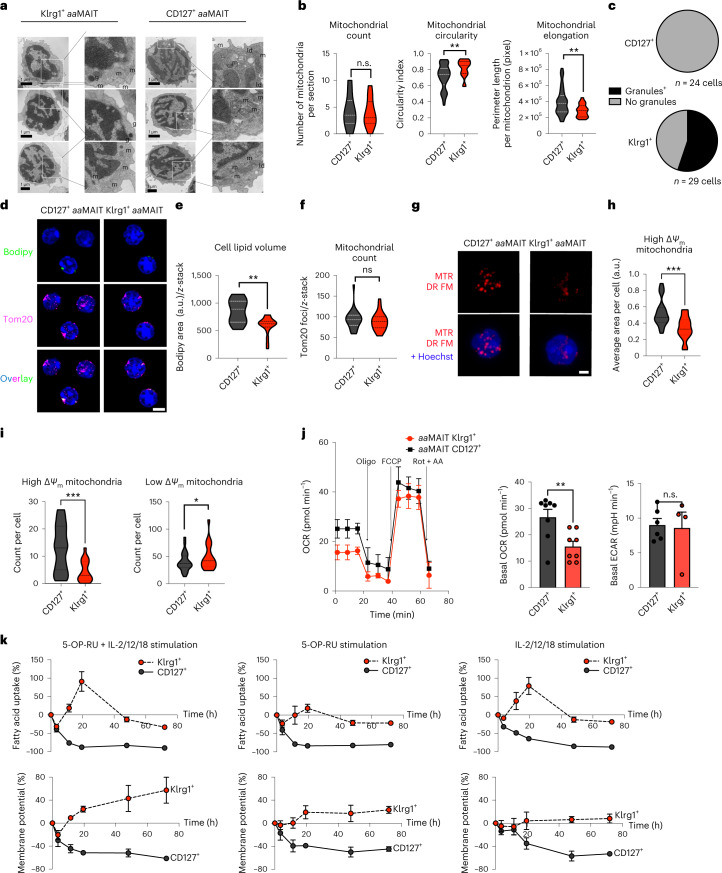
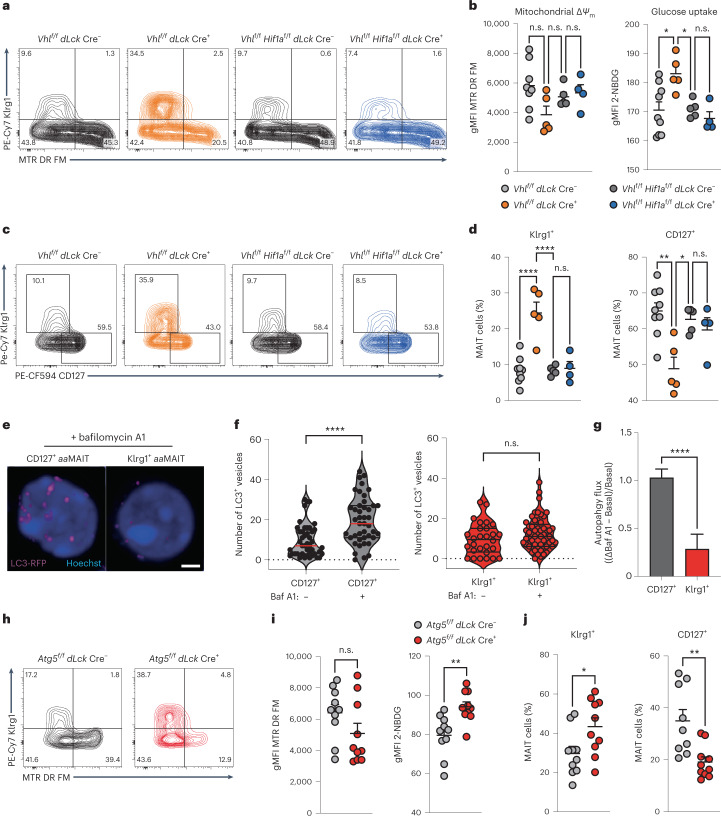
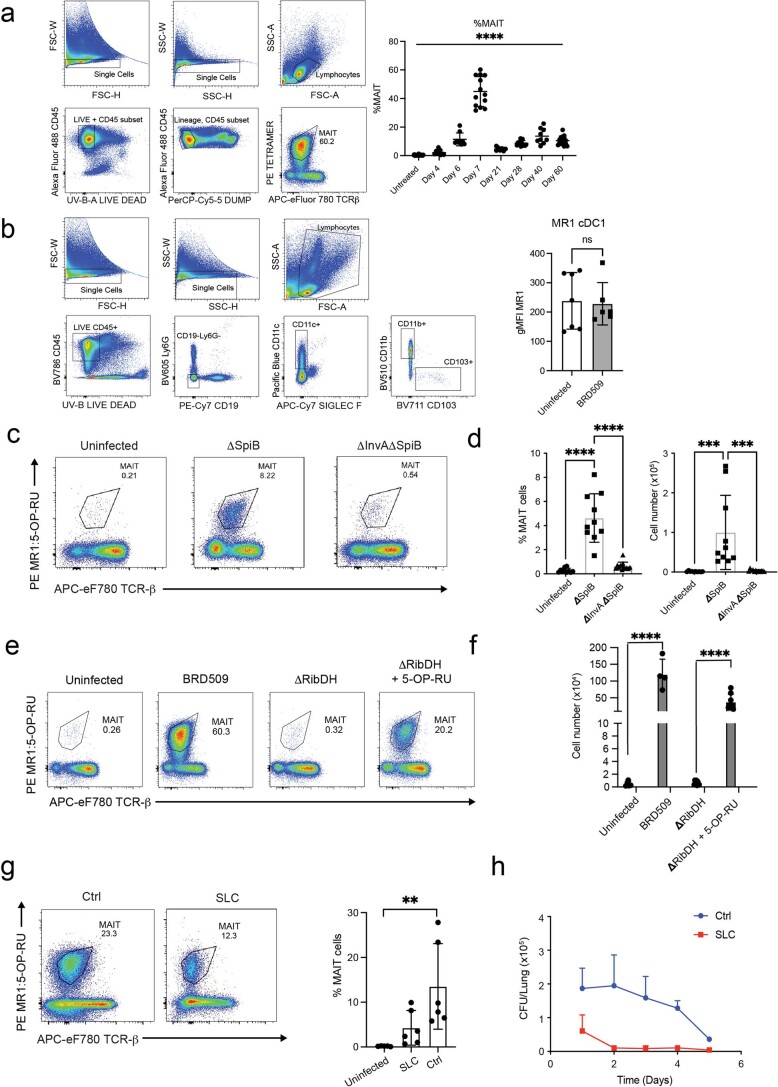
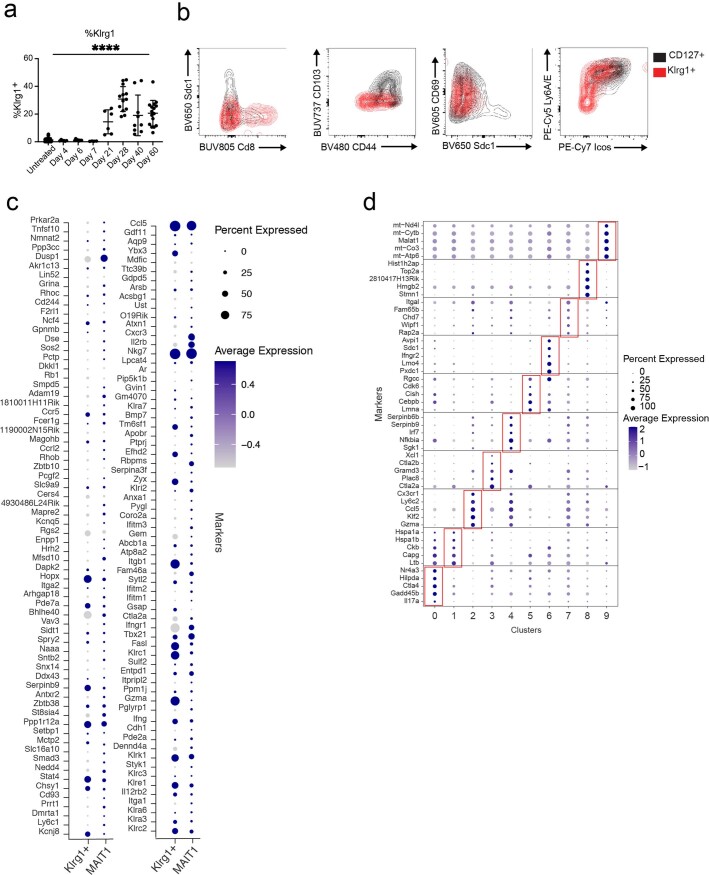
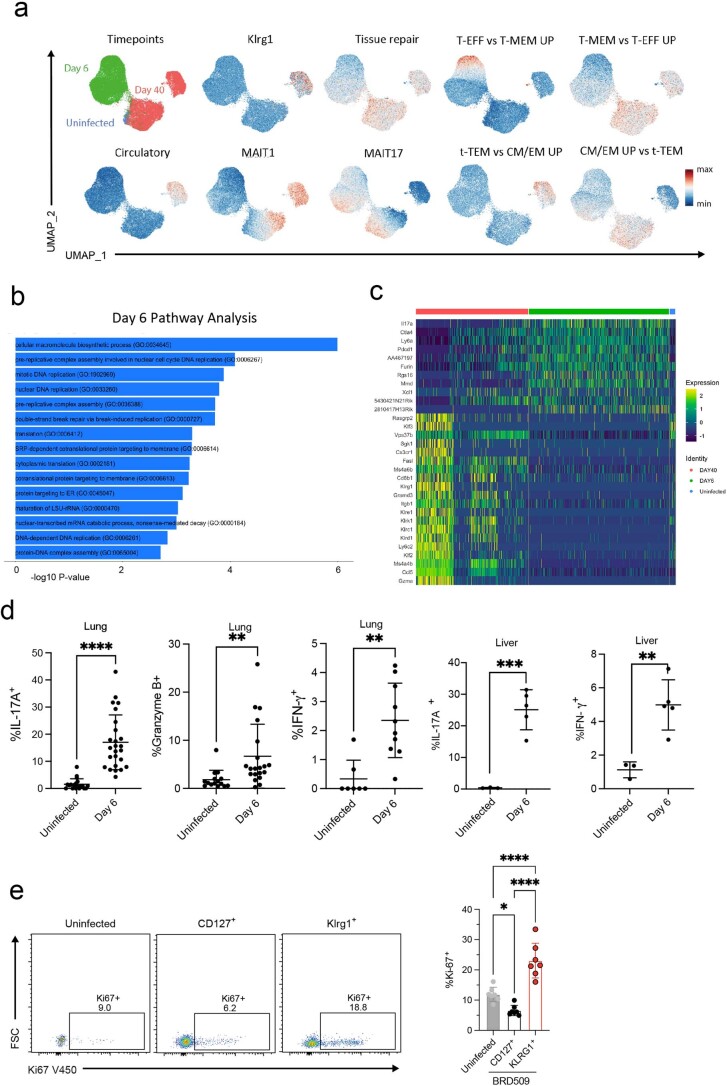
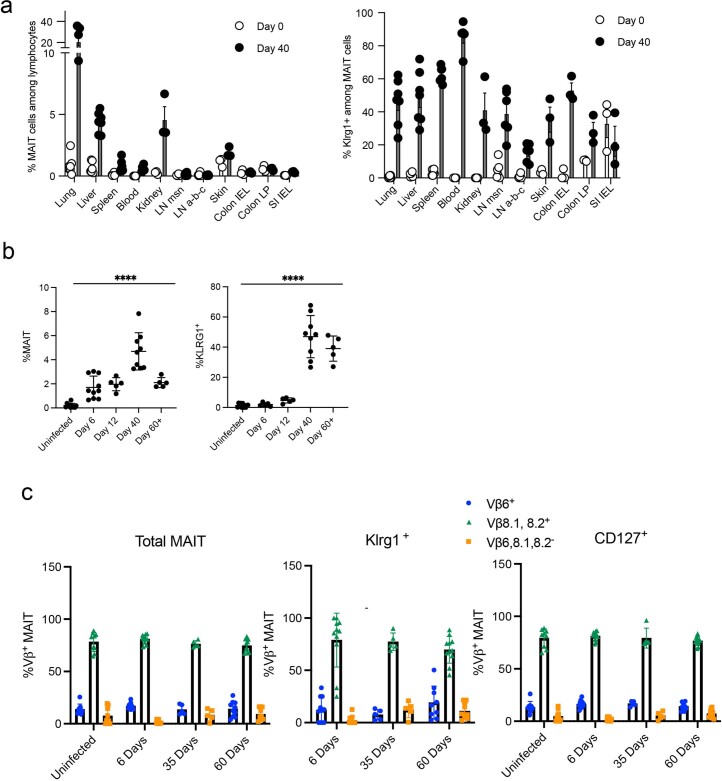
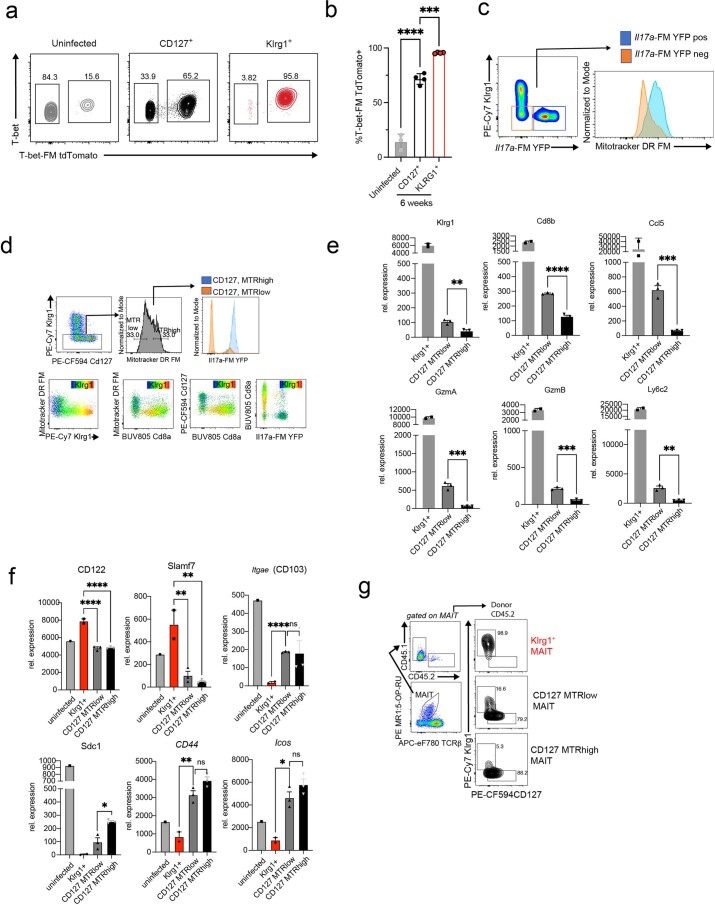
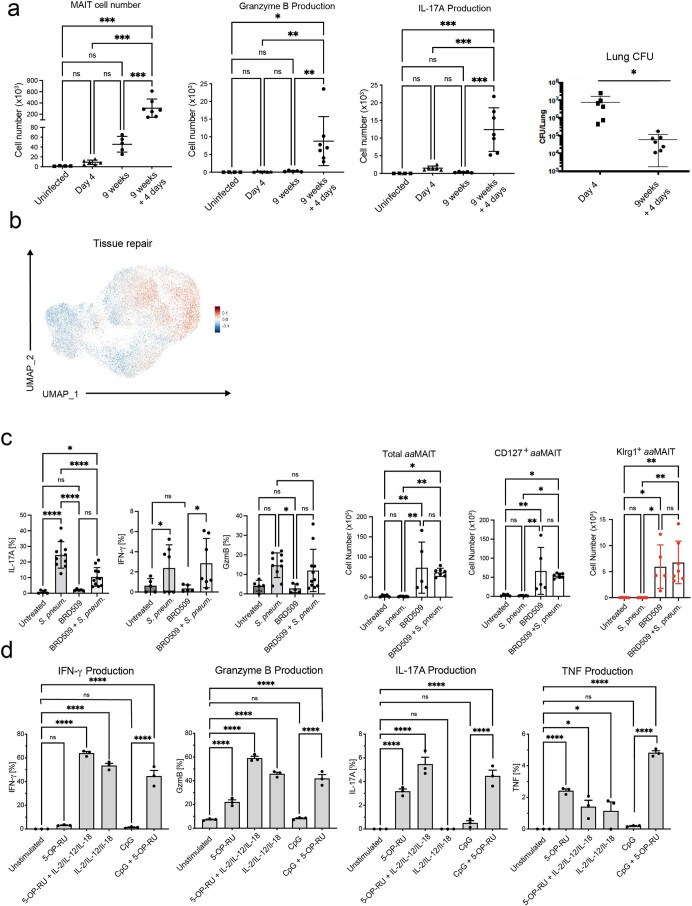
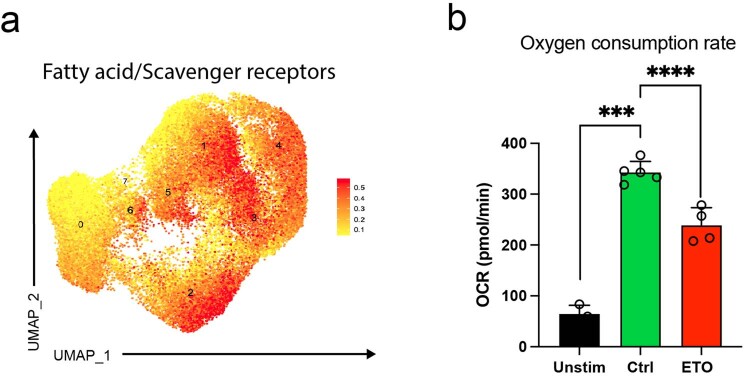
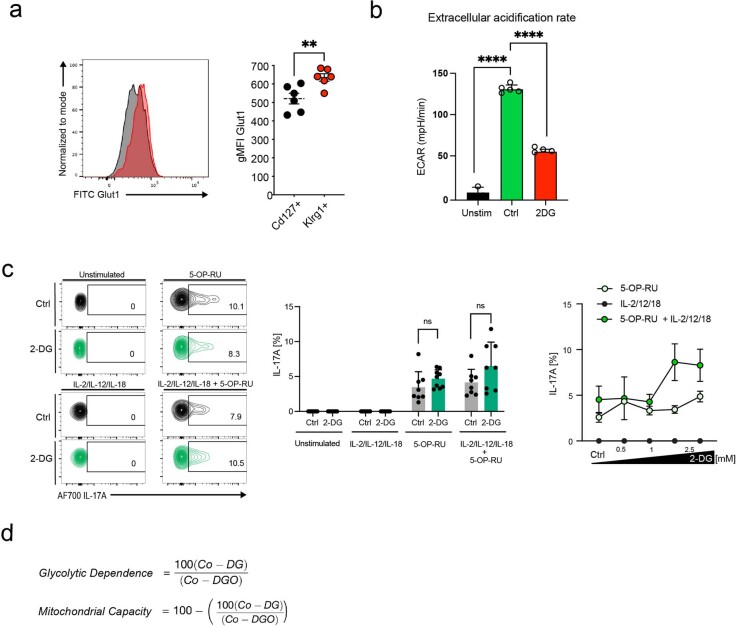
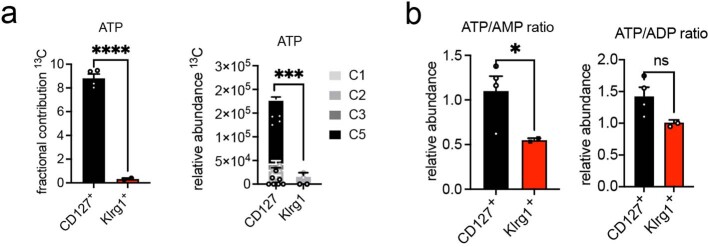
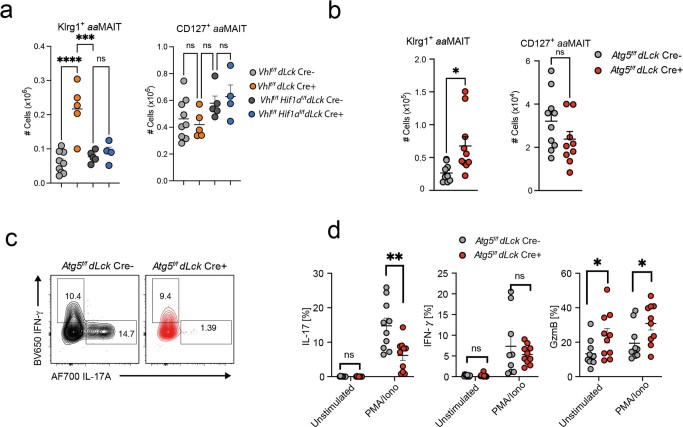
Although mucosal-associated invariant T (MAIT) cells provide rapid, innate-like responses, they are not pre-set, and memory-like responses have been described for MAIT cells following infections. The importance of metabolism for controlling these responses, however, is unknown. Here, following pulmonary immunization with a Salmonella vaccine strain, mouse MAIT cells expanded as separate CD127-Klrg1+ and CD127+Klrg1- antigen-adapted populations that differed in terms of their transcriptome, function and localization in lung tissue. These populations remained altered from steady state for months as stable, separate MAIT cell lineages with enhanced effector programmes and divergent metabolism. CD127+ MAIT cells engaged in an energetic, mitochondrial metabolic programme, which was critical for their maintenance and IL-17A synthesis. This programme was supported by high fatty acid uptake and mitochondrial oxidation and relied on highly polarized mitochondria and autophagy. After vaccination, CD127+ MAIT cells protected mice against Streptococcus pneumoniae infection. In contrast, Klrg1+ MAIT cells had dormant but ready-to-respond mitochondria and depended instead on Hif1a-driven glycolysis to survive and produce IFN-γ. They responded antigen independently and participated in protection from influenza virus. These metabolic dependencies may enable tuning of memory-like MAIT cell responses for vaccination and immunotherapies.


Conflict of interest statement

The authors declare that they have no competing interests.

Figures

Fig. 1
Fig. 1. A Salmonella vaccine strain induces two aaMAIT cell subsets.
MAIT cells from lungs of C57BL/6J mice were analysed at the indicated times post BRD509 vaccination by flow cytometry. a, Representative plots (left) and quantification (right) of MR1:5-OP-RU Tetramer+ TCR-β+ MAIT cells. n = 36, 9, 9, 13, 7, 11, 9 and 16 mice per group, combined from 12 independent experiments. Statistical significance assessed via one-way analysis of variance (ANOVA), ****P < 0.0001. b, Representative histograms (top) of expression of MR1 by lung cDC2 after infection at the indicated times (left) or with the indicated Salmonella strains (right). Quantification (bottom) of MR1, CD86 and CD80 expression by cDC2. n = 13, 8, 4, 7, 7, 8, 5, 6, 9 and 8 mice per group, combined from two independent experiments, statistical significance assessed via one-way ANOVA with Tukey’s multiple comparison test, ****P < 0.0001 for MR1 on DC or unpaired t-test, ***P = 0.0007 (CD86), ***P = 0.0008 (CD80). c, UMAP representations of scRNA-seq data from pulmonary MAIT cells at day 0 and day 40 post BRD509 vaccination. MAIT cells sorted from lungs pooled from ten mice per timepoint in one experiment. d, Th1 and Th17 gene signature plots (left) and feature plots for the indicated genes. e, Representative plots (left) and quantification (right) of expression of Klrg1 by lung MAIT cells at indicated times post BRD509 vaccination. n = 28, 6, 8, 4, 7, 11, 9 and 16 mice per group, respectively, combined from nine independent experiments, statistical significance via one-way ANOVA, ****P < 0.0001. f,g, Representative plots (f) and quantification (g) of RORγt and T-bet by lung MAIT cells at indicated times post BRD509 vaccination. RORγt: n = 11 (untreated), n = 6 (day 6), n = 13 (day 60), combined from three independent experiments; RORγt subsets: n = 20 (untreated), n = 25 (day 60), combined from five independent experiments. T-bet: n = 11 (untreated), n = 6 (day 6), n = 13 (day 60), combined from three independent experiments, statistical significance via one-way ANOVA with Tukey’s multiple comparisons test; left (*P = 0.0267, **P = 0.0034), left middle (**P = 0.0045), middle (****P < 0.0001, **P = 0.0013), right (*P = 0.0449, ****P < 0.0001). h, Representative cytokine production by intracellular flow cytometry by MAIT cell populations at indicated timepoints in response to PMA and ionomycin. All data displayed as mean ± s.d. Source numerical data are available in source data. n.s., not significant. Source data
Fig. 2
Fig. 2. Stable aaMAIT cell subsets differ in localization and protective capacity.
a, Il17a-FM YFP mice for FM Il17a expression were analysed at indicated times post BRD509 vaccination. Experimental setup (left). aaMAIT cell YFP expression is shown in representative histograms (middle) and quantified as percentage of YFP+ cells (right). n = 6 (untreated), n = 8 (day 40) mice per group, combined from two independent experiments. Data displayed as mean ± s.d.; statistical significance assessed via ANOVA with Tukey’s multiple comparisons test, ****P < 0.0001. b, Experimental setup and gating (left). The indicated populations of CD45.2 donor lung aaMAIT cells at day 40 post vaccination were sorted and transferred into CD45.1 recipient mice. After gating on MR1:5-OP-RU tetramer+ TCRβ+ MAIT cells and CD45.2 (donor), Klrg1 and CD127 expression was plotted in recipient mice 6 days post vaccination with BRD509 (right). Representative data shown from one of two independent experiments. c, Populations of aaMAIT cells were gated as in b, sorted and cultured for 72 h under indicated stimulation conditions and analysed for expression of Klrg1 and CD127. Representative data shown from one of two independent experiments. d, Vascular localization of indicated aaMAIT cell subsets at indicated times post BRD509 vaccination represented as percentage of cells accessible to staining with intravenously injected CD45 antibody 3 min before tissue collection. Gating (left) and quantification (right). Paired t-test, n = 5 (untreated) n = 6 (day 40) mice per group, ****P < 0.0001. p.i., post infection. e, UMAP presentation of circulatory and tissue residency signatures from scRNA-seq data from pulmonary MAIT cells at day 0 and day 40 post BRD509 vaccination. fi, Donor mice were vaccinated with BRD509. Total MAIT cells were sorted at day 7 (f and g) or subsets were sorted at day 40 (h and i). MAIT cells were adoptively transferred into recipient mice, and recipients were infected with S. pneumoniae (fh) or influenza H1N1 (i). fh show bacterial burden in lung 18 h post infection. In f, n = 8, 6, 8 and 9 mice per group, respectively, combined from two independent experiments, data displayed as mean ± s.d., one-way ANOVA with Tukey’s multiple comparisons test, **P = 0.0094, **P = 0.0068, respectively. In g, n = 7 and 9 mice per group, respectively, unpaired t-test, ***P = 0.0007, combined from two independent experiments. In h, n = 9, 8 and 10 mice per group, respectively, combined from two independent experiments, one-way ANOVA with Tukey’s multiple comparisons test, *P = 0.0274, *P = 0.0397, respectively. In i, n = 11, 8 and 10 mice per group, combined from two independent experiments. Data displayed as mean ± s.e.m. Survival represented as Kaplan–Meier plot (top) and weight loss (bottom) following influenza infection of recipient mice. Log-rank (Mantel–Cox) test *P = 0.0111, **P = 0.0048. Source numerical data are available in source data. n.s., not significant. Source data
Fig. 3
Fig. 3. Effector response by re-activated aaMAIT cells.
ae, Mice were uninfected (naïve), vaccinated with BRD509 and analysed 40 days later (BRD509), or analysed 10 h after S. pneumoniae infection; infected mice were naïve mice (S. pneum.) or vaccinated 40 days previously (BRD509 + S. pneum.). Pulmonary MAIT cells were pooled from ten mice per group and were sorted and analysed by scRNA-seq. UMAP representation of MAIT cell cluster composition separated by infection regimens as indicated (a) and combined UMAP representations (b). Data from uninfected and BRD509 infected mice are the same sequences as those in Fig. 1c. c, UMAP representation of tissue residency, circulatory, Th1 and Th17 gene signatures d, Feature plots of the indicated genes. e, Top five differentially expressed genes of each cluster represented as dot plots, where circle size represents percentage of cells expressing each gene and colour scale depicts relative expression value. f, Cytokine production by MAIT cell subsets in untreated and BRD509-vaccinated mice 16 h following infection with S. pneumoniae or without infection. Number of pulmonary MAIT cells positive for IL-17A, IFN-γ and Granzyme B are shown for each group. Data displayed as mean ± s.d. n = 5, 7, 5 and 7 mice per group, respectively, combined from two independent experiments (left, middle). n = 5, 10, 5 and 11, mice per group, combined from three independent experiments (right). Statistical significance assessed via one-way ANOVA, with Tukey’s multiple comparisons test; ****P < 0.0001, *P = 0.0487, **P = 0.0029 (left); **P < 0.0068 (middle); *P = 0.0283 (right). gi, Cytokine and Granzyme production by pulmonary MAIT cells isolated 40 days after vaccination with BRD509, cultured as pulmonary cell suspensions with or without re-activation as indicated. Protein production determined by intracellular flow cytometry. Representative histograms of total MAIT cell IL-17A and IFN-γ (g) or TNF and Granzyme B (h) and quantification (i) of each cytokine produced by either CD127+ MAIT cells (black) or Klrg1+ MAIT cells (red). n = 3 mice per group, representing one of two independent experiments. Two-way ANOVA corrected for multiple comparisons, left: ****P < 0.0001; centre left: *P = 0.0305, ****P < 0.0001; centre right: *P = 0.0283, **** < 0.0001; right: ****P < 0.0001. Data displayed as mean ± s.e.m. Source numerical data are available in source data. n.s., not significant. Source data
Fig. 4
Fig. 4. CD127+aaMAIT cells depend on FA uptake and oxidation.
ad, Mouse lung aaMAIT cell subsets were analysed at steady state or at the indicated times post BRD509 vaccination. Representative histograms (left) and quantification (right) are plotted as geometric mean fluorescence intensity (gMFI). Mitochondrial membrane potential (a) quantified by MTR DR FM intensity at the indicated times post vaccination. n.d., Klrg1+ MAIT cells not detected. Two-way ANOVA, n = 5 mice per group from one of two independent experiments. Bodipy-FL C16 uptake of fluorescently labelled FA (b). Paired two-tailed t-test, ***P = 0.00014; n = 4 mice per group, n = 2 independent experiments. Surface expression of the scavenger receptor CD36 (c). Paired two-tailed t-test, ***P = 0.0006, n = 4 mice per group, n = 2 independent experiments. Neutral lipid droplet content quantified by Bodipy 493/503 fluorescence (d). Paired two-tailed t-test, ***P = 0.00075. n = 7 and 6 mice per group, n = 2 independent experiments. e, Left: lung MAIT cells at 40 days post BRD509 vaccination were subjected to nutrient restriction for 48 h, and percentage survival was measured via flow cytometry by viability dye positivity. Right: fold rescue of the percentage survival afforded by the indicated nutrient supplementations for CD127+ (black) or Klrg1+ (red) aaMAIT cells (right), ****P < 0.0001. n = 3 mice per group from one of two experiments. fh, Pulmonary aaMAIT cells were isolated 40 days after vaccination with BRD509, cultured as cell suspensions for 18 h, with or without re-activation as indicated, and assessed for cytokine/granzyme production. FA oxidation/OXPHOS inhibition by Etomoxir (ETO, 90 μM). Two-tailed unpaired t-tests with false discovery rate testing: IL17A **P = 0.0050, *P = 0.02863; IFNγ: n.s.P = 0.659194, n.s.P = 0.581563, n.s.P = 0.258063; GzmB: n.s.P = 0.534601, n.s.P = 0.828580, n.s.P = 0.166802, n.s.P = 0.206856. n = 6 mice per group from one experiment. All data displayed as mean ± s.e.m. Source numerical data are available in source data. n.s., not significant. Source data
Fig. 5
Fig. 5. Klrg1+aaMAIT cells depend on glucose consumption.
a, Pulmonary MAIT cells were assessed for uptake of fluorescent glucose 2-NBDG at the indicated timepoints post BRD509 vaccination. Representative histograms (left) and quantification (right). **P = 0.002736, ****P < 0.0001. n = 5 mice per group from one of two independent experiments. bd, Pulmonary MAIT cell subsets were isolated from mice 40 days post BRD509 vaccination and analysed for metabolic and functional parameters during culture for 18 h with or without re-activation with 5-OP-RU and/or IL-2, IL-12 and IL-18, as indicated. Kinetics of fluorescent glucose 2-NBDG uptake (added for last 30 min) at indicated durations of re-activation in minutes and quantified as percentage increase over baseline (b). n = 6 mice per group, n = 2 experiments. Representative histograms (left) and quantification (right) (c) of IFN-γ production following 18 h re-activation. Glycolysis was inhibited by 2-deoxy-glucose (2-DG, green colour). ****P < 0.0001, n.s.P = 0.142985, **P = 0.001908; multiple two-tailed unpaired t-tests. n = 9, 9, 8 and 8 independent samples over n = 2 experiments. Dose and activation mode (TCR and/or cytokines) dependence of the concentration of 2-DG on IFN-γ production at 18 h re-activation (d). **P = 0.0085, ****P < 0.0001; ANOVA with Dunnett’s post-test for multiple comparisons. n = 3 independent samples per group from one experiment. eg, Metabolic inhibition of effector functions was assessed in pulmonary aaMAIT cells isolated from mice 40 days post BRD509 vaccination. Dependence and capacity were calculated according to Extended Data Fig. 8d. Oligomycin A (O); 2-DG plus Oligomycin A (DGO). Ordinary one-way ANOVAs with Tukey’s multiple comparisons testing. Left: ***P = 0.0004, ***P = 0.0002, ****P < 0.0001; right: ***P = 0.0003, ****P < 0.0001, n.s.P = 0.1411 (e); *P = 0.0247, n.s.P = 0.6949, *P = 0.0210 (f); **P = 0.009319, **P = 0.003056, *P = 0.029, *P = 0.0106 (g). n = 6, 3, 3 and 3 from one of two experiments (e and f) or n = 3 from one of two experiments (g). All data displayed as mean ± s.e.m. Source numerical data are available in source data. n.s., not significant. Source data
Fig. 6
Fig. 6. Klrg1+aaMAIT cells have abundant but dormant mitochondria that are rapidly responsive to activation.
Sorted mouse pulmonary aaMAIT cell subsets were analysed for mitochondrial content and function at >40 days post BRD509 vaccination. a, Representative images. m, mitochondria; ld, lipid droplet; g, granule. Scale bar, 1 μm. b,c, Quantification of mitochondrial number and morphology (b) and cytotoxic granule count (c) from transmission electron micrograph sections of aaMAIT cell subsets. n.s.P = 0.504661. **P = 0.003697, **P = 0.003851; unpaired two-tailed t-tests. In b, n = 22, 22, 21, 54, 22 and 54 cells from five pooled mice per each group. In c, n = 24 and 29 cells per group. df, Representative images (d) and quantification (e and f) of Bodipy493/503-positive lipid droplets (green) and mitochondrial Tom20 protein (purple) from z-stack composite airy-scan confocal micrographs of sorted aaMAIT cell subsets. Hoechst 33342 demarcates nucleus (blue). Scale bar, 5 μm; **P = 0.00130, n.s.P = 0.9; Mann–Whitney, two-tailed. n = 25, 20, 25 and 20 cells per group, pooled from five mice per group over two independent experiments. gi, Representative images (g) and quantification (h and i) of mitochondrial ΔΨm by MTR DR FM intensity. Hoechst 33342 demarcates nucleus (blue, in bottom row combined channel images). Scale bar, 5 μm. Quantification represents the area (h) and count (i) of mitochondria that have high or low ΔΨm signal, respectively. n = 27 and 20 cells per group, pooled from five mice per group over two independent experiments. ***P = 0.0005 (h), ***P = 0.0004, *P = 0.047 (i); all Mann–Whitney, two-tailed. j, OCR kinetics (left) in response to injection of Oligomycin (Oligo), FCCP, Rotenone (Rot) and Antimycin A (AA) measured by Seahorse Bioanalyzer in sorted subsets of pulmonary aaMAIT cell subsets 40 days after vaccination with BRD509. OCR (middle) and basal ECAR (right) were measured without drug treatments or stimulation. **P = 0.0072, n.s.P = 0.84; unpaired, two-tailed t-tests. n = 8, 7, 6 and 4 independent samples per group, pooled from ten mice per group from one of two experiments. k, Quantification of mitochondrial ΔΨm by MTR DR FM and uptake of Bodipy-FL C16 FA in MAIT cell subsets isolated from lungs 40 days post vaccination with BRD509 and cultured as pulmonary cell suspensions for 18 h with or without re-activation with antigen (5-OP-RU), cytokines (IL-2/-12/-18) or the combination. n = 6, 3 and 3 independent samples per group from one experiment. All data displayed as mean ± s.e.m. Source numerical data are available in source data. n.s., not significant. Source data
Fig. 7
Fig. 7. Oxygen sensing and autophagy facilitate CD127+aaMAIT.
Pulmonary aaMAIT cells at >40 days post BRD509 vaccination from Vhlf/f dLck Cre+ and Vhlf/f Hif1af/f dLck Cre+ mice were analysed. a,b, Representative histograms (a) and quantification (b) of mitochondrial ΔΨm (MTR DR FM) and labelled glucose uptake. In b, left: n.s.P = 0.072, n.s.P = 0.74, n.s.P = 0.92; right: *P = 0.0391, *P = 0.0118, n.s.P = 0.8829, ordinary ANOVAs with Tukey’s multiple comparisons testing. n = 8, 5, 5 and 4 mice per group from n = 2 experiments. c,d, Representative histograms (c) and quantification (d) of pulmonary CD127+ and Klrg1+ aaMAIT cell ratios from mice with the indicated genotypes. n.s.P = 0.9962, ****P < 0.0001, **P = 0.0012, *P = 0.0140, n.s.P = 0.0864; ordinary one-way ANOVAs with Tukey’s multiple comparisons testing. n = 8, 5, 5 and 4 mice per group from n = 2 experiments. e, Representative confocal z-stack projections of LC3-RFP in sorted aaMAIT cells cultured in the presence of the autophagy flux inhibitor Bafilomycin A1 (Baf A1). f,g, Quantification of autophagosome buildup in presence of Baf A1 in sorted aaMAIT cell subsets (f) and calculation of autophagy flux as (ΔBaf A1 − Basal)/Basal) (g). ****P < 0.0001, Mann–Whitney, two-tailed. In f, n = 70, 62, 60 and 29; in g, n = 45 and 44. h,i, Representative histograms (h) and quantification (i) of mitochondrial ΔΨm (MTR DR FM) and labelled glucose uptake from Atg5f/f dLck Cre+ mice and Cre-negative littermates. n.s.P = 0.129, **P = 0.0027, unpaired, two-tailed t-test. n = 10 mice from n = 2 experiments. j, Quantification of pulmonary CD127+ and Klrg1+ aaMAIT cell ratio from the indicated genotypes. *P = 0.029, **P = 0.0033; unpaired, two-tailed t-test. n = 10 mice from n = 2 experiments. All data displayed as mean ± s.e.m. Source numerical data are available in source data. n.s., not significant. Source data
Extended Data Fig. 1
Extended Data Fig. 1. Invasive Salmonella strains induce an effector response.
a) Gating strategy for MAIT cells in lung (left) and quantification of MAIT cells expression at different times post BRD509 (right). n = 36, 9, 9, 13, 7, 13, 9, 16, mice per group, respectively, combined from 12 independent experiments. One way ANOVA, ****P < 0.0001. b) Gating strategy for CD11bCD103+ conventional dendritic cells (cDC1) and CD11b+ CD103- (cDC2) (left), and MR1 quantification as geometric MFI in cDC1 (right). n = 7 (untreated), n = 6 (BRD509), unpaired two-tailed t test. c) Representative flow cytometric analysis and (d) Quantification of MAIT cells 6 days after infection with invasion mutant (ΔInvAΔSpiB) or control strain (ΔSpiB). Combined from 3 independent experiments, n = 10, 10, 12 mice per group, respectively. One-way ANOVA, with Tukey’s multiple comparisons test, ****P < 0.0001 (left), ***P = 0.0006, ***P = 0.0005, (right). e) Flow cytometric analysis and (f) quantification of MAIT cells in lung 7 days after infection with indicated bacterial strains, or ΔRibDH in combination with 5 nmol 5-OP-RU. n = 5, 4, 8, 8 mice per group, respectively, combined from 2 independent experiments. One-way ANOVA, with Tukey’s multiple comparisons test, ****P < 0.0001. (g) Representative flow cytometric analysis and quantification of lung MAIT cells 4 weeks post infection with Salmonella strain ELH1301 expressing a synchronized lysis circuit (SLC) and control strain (Ctrl). N = 5, 6, 6 mice per group, respectively, combined from two independent experiments, One-way ANOVA, **P = 0.0082. h) Growth kinetics of SLC and control strains in mouse lung, 3 mice per group, one experiment. All error bars represent mean ± S.D. Source numerical data are available in source data. Source data
Extended Data Fig. 2
Extended Data Fig. 2. mRNA and protein marker phenotypes of aaMAIT cell subsets.
a) % of Klrg1+ MAIT cells at indicated timepoints. n = 28, 6, 8, 4, 6, 13, 9, 16, mice per group, respectively, combined from 9 independent experiments. One-way ANOVA, ****P < 0.0001. b) Protein expression of the indicated proteins measured by flow cytometry in subsets of day 40 aaMAIT cells. c) aaMAIT cell clusters 2 and 4 with a Th1 gene expression were compared with steady state MAIT1 cells from publicly available data for expression of MAIT1 signature genes,. d) Top 5 differentially expressed genes of each cluster represented as dot plots, where circle size represents % of cells expressing each gene and color scale depicts relative expression value. Source numerical data are available in source data. Source data
Extended Data Fig. 3
Extended Data Fig. 3. Day40 aaMAIT cell transcriptional and functional phenotype.
a) UMAP representation of day 0 and day 40 scRNA-seq data from Fig. 1c but including day 6 after infection. Expression of key genes and gene signatures as in Fig. 1d. GO terms and C7 datasets: GSE1000002_1582_200_UP, GSE1000002_1582_200_DN and Milner et al. b) Ingenuity pathway analysis of day 6 DE genes, ordered by -log10 P value. c) Heatmap representation of top DE genes across indicated timepoints. d) Cytokine production by intracellular flow cytometry at day 6 post BRD509 vaccination by lung and liver MAIT cells, cultured with Brefeldin A for 2 hrs but without restimulation in vitro. Data points indicate individual mice, statistics assessed via unpaired two-tailed t test. IL-17A: n = 19 (uninfected), n = 25 (day 6) mice per group, combined from 5 independent experiments, ****P < 0.0001. Granzyme B: n = 15 (uninfected), n = 20 (day 6), combined from 4 independent experiments, **P = 0.0099. IFN-γ: n = 7 (untreated), n = 10 (day 6), combined from 2 independent experiments, **P = 0.0017. Liver cytokines: n = 3 (untreated), n = 5 (day 6), ***P = 0.0006, **P = 0.0055. e) Ki-67 expression in untreated pulmonary MAIT cells and aaMAIT cells 40 days post vaccination with BRD509. n = 7 mice per group, combined from 2 independent experiments. Statistical significance via one-way ANOVA with Tukey’s multiple comparisons test. *P = 0.0388, ****P < 0.0001. All error bars represent mean ± S.E.M. Source numerical data are available in source data. Source data
Extended Data Fig. 4
Extended Data Fig. 4. aaMAIT cell location, clonotype and expansion kinetics.
a) % of MAIT cells (left) and Klrg1+ MAIT cells (right) at day 0 and 40 post BRD509 vaccination in the indicated tissues. b) Kinetics of MAIT cell expansion (left) and Klrg1+ MAIT cells (right) at indicated timepoints post vaccination in the liver. n = 11, 10, 5, 9, 5 mice per group, respectively, combined from 3 independent experiments; one-way ANOVA ****P < 0.0001 (left). n = 11, 5, 5, 9, 5 mice per group, respectively, combined from 3 independent experiments, one-way ANOVA ****P < 0.0001(right). c) Prevalence of Vβ6, Vβ8.1, 8.2, or Vβ6,8.1,8.2 MAIT cells in the lung at steady state (n = 9) and at days 6 (n = 11), 35 (n = 5) and 60 (n = 10) post vaccination in total MAIT cells (left), Klrg1+ (center) or CD127+ aaMAIT cells (right). All data displayed as mean ± S.D. Source numerical data are available in source data. Source data
Extended Data Fig. 5
Extended Data Fig. 5. MTRlow KIrg1aaMAIT cells may be precursors to stable aaMAIT cell subsets.
a,b) Representative histograms (a) and quantification (b) of T-bet-TdTomato fate mapper and current T-bet protein expression in indicated pulmonary MAIT cells subsets at baseline or at >40 days post BRD509 vaccination. Data displayed as mean ± S.D., n = 3, 4, 4 mice per group, respectively, representative of one experiment. Statistical significance via one-way ANOVA with Tukey’s multiple comparisons test, ****P < 0.0001, ***P < 0.0002. c) aaMAIT cells that are Klrg1 from IL17a-FM YFP mice were gated as shown at day 40 post vaccination and tested for mitochondrial ΔΨm (MitoTracker DR FM). Data representative of n = 4 mice. d) Klrg1 day 40 aaMAIT cells were separated into top/bottom 33% based on mitochondrial ΔΨm (MitoTracker DR FM) and tested for IL17a-FM YFP expression (top row). Day40 aaMAIT cell expression of indicated markers, with expression of Klrg1 overlayed as a color scale. Data representative of n = 6 mice and two independent experiments. e) Relative expression measured by bulk RNA-seq of the indicated genes in Day 40 Klrg1+ aaMAIT cells and CD127+, MTRlow and MTRhigh aaMAIT cells. Each datapoint reflects an individual mouse from one experiment. Unpaired two-tailed t tests; Klrg1 **P = 0.006353, Cd8b ****P = 0.000078, Ccl5 ***P = 0.000731, GzmA ***P = 0.000742, GzmB ***P = 0.000332, Ly6c2 **P = 0.001577. Data displayed as mean ± s.e.m. f) Relative expression measured by bulk RNA-seq of the indicated genes in naïve MAIT cells, day 40 Klrg1+ aaMAIT cells and CD127+, MTRlow and MTRhigh aaMAIT cells. Each datapoint reflects an individual mouse from one experiment. One-way ANOVA CD122 ****P < 0.0001, Slamf7 **P = 0.0047, **P = 0.0021, Itgae ****P < 0.0001, Scd1 *P = 0.009193, Cd44 **P = 0.0079, Icos *P = 0.0127. Data displayed as mean ± s.e.m. g) The indicated populations of CD45.2 donor lung aaMAIT cells at day 40 post vaccination were sorted and transferred into CD45.1 recipient mice. After gating on MR1:5-OP-RU tetramer+ TCRβ+ MAIT cells and CD45.2 (=donor) markers (left), Klrg1 and CD127 expression was plotted in recipient mice 14 days post vaccination with BRD509 (right). Representative data shown from one of two independent experiments. Source numerical data are available in source data. Source data
Extended Data Fig. 6
Extended Data Fig. 6. Re-activated aaMAIT cells provide protective responses.
a) Number of total MAIT cells, granzyme B+ and IL-17A+ MAIT cells at baseline and at indicated times after BRD509 vaccination or 4 days after re-infection. CFU per lung is shown on the right. Data displayed as mean ± S.D., n = 4, 6, 5, 7 mice per group, one experiment. Statistical significance via one-way ANOVA with Tukey’s multiple comparisons test. ***P = 0.0003 (uninfected vs 9w + 4d), ***P = 0.0001 (4d vs 9w + 4d), ***P = 0.0009 (9w vs 9w + 4d) (Left). *P = 0.0124, **P = 0.0055 (4d vs 9w + 4d), **P = 0.0092 (9w vs 9w + 4d) (GrB). ***P = 0.0002 (uninfected vs 9w + 4d), ***P = 0.0002 (4d vs 9w + 4d), ***P = 0.0001 (9w vs 9w + 4d) (IL-17A). *P = 0.0456 (right) b) Feature plot UMAP representation of a module score for “Tissue repair” derived from the TiRe database c) Cytokine production by MAIT cell subsets in untreated and BRD509 vaccinated mice following infection with S. pneumoniae URF918, 16 hrs post infection. % of pulmonary MAIT cells positive for IL-17A, IFN-γ and Granzyme B are shown for each group (left). Abundance of indicated populations of MAIT cells quantified as absolute count (right). Data displayed as mean ± S.D. n = 5, 10, 5, 11 mice per group, respectively combined from 3 independent experiments (IL-17A, GzmB). n = 5, 7, 5, 7 mice per group, respectively, combined from 2 independent experiments (IFN-γ). Statistical significance assessed via one-way ANOVA with Tukey’s multiple comparisons test, ****P < 0.0001, *P = 0.0328 (IL-17A); *P = 0.0414 (GrB). Cell counts: n = 5, 7, 5, 7 mice per group, respectively, combined from 2 independent experiments. Statistical significance assessed via one-way ANOVA with Tukey’s multiple comparisons test. Total aaMAIT: **P = 0.0054(Untreated vs BRD509), *P = 0.0126(Untreated vs BRD509 + S.pneum.), **P = 0.0022(S.pneum. vs BRD509), **P = 0.0047 (BRD509 vs BRD509 + S.pneum.). CD127+ aaMAIT: **P = 0.0087(Untreated vs BRD509), *P = 0.0249 (Untreated vs BRD509 + S.pneum.), **P = 0.0036(S.pneum. vs BRD509), **P = 0.0101(S.pneum. vs BRD509 + S.pneum.). Klrg1+ aaMAIT: *P = 0.0207(Untreated vs BRD509), **P = 0.0040 (Untreated vs BRD509 + S.pneum.), *P = 0.0115(S.pneum. vs BRD509), **P = 0.0017(S.pneum. vs BRD509 + S.pneum.). d) Cytokine production by pulmonary aaMAIT cells isolated 40 days after vaccination with BRD509, cultured as cell suspensions for 18 hrs with or without re-activation as indicated. Cytokine production determined by intracellular staining and plotted as % of MAIT cells positive for IFN-γ, Granzyme B, IL-17A and TNF. n = 3 mice per group, representing 1 of 2 independent experiments. One-way ANOVA with Tukey’s test for multiple comparisons; IFNγ: ****P < 0.0001, n.sP = 0.8945. GzmB: n.sP = 0.9994, ****P < 0.0001 IL17: n.sP > 0.9, ****P < 0.0001. TNF: ****P < 0.0001. *P = 0.044, *P = 0.034, n.sP > 0.5. Data displayed as mean ± s.e.m. Source numerical data are available in source data. Source data
Extended Data Fig. 7
Extended Data Fig. 7. CD127+aaMAIT cells express transcripts for scavenger receptors.
a) UMAP representation of gene signature analysis for fatty acid/scavenger receptor genes from GO_term 20220131-155727scavenger_receptors. Analysis of the combined sequence data from unstimulated lung MAIT cells, aaMAIT cells, and these two populations 10 hrs after stimulation with S. pneumoniae, as shown in Fig. 3. b) Effect of etomoxir on the baseline oxygen consumption rate (OCR) as detected by Seahorse Bioanalyzer. Spleen CD8+ T cells from mice at day 40 post BRD509 vaccination were analyzed at baseline (Unstim) and when activated (CD3/28) in the presence (ETO) or absence (Ctrl) of etomoxir. Same concentration of ETO as in Fig. 4f–h, showing an on-target effect of the drug. n = 3,5,4 mice per group from one experiment. Two-tailed, unpaired t tests, ***P = 0.00071, ****P < 0.0001. Data displayed as mean ± s.e.m. Source numerical data are available in source data. Source data
Extended Data Fig. 8
Extended Data Fig. 8. MAIT cell IL-17A is not highly dependent on glucose.
a) Pulmonary aaMAIT cells were isolated from mice 40 days post BRD509 vaccination and analyzed for Glut1 expression by flow cytometry. Representative histogram (left) and quantification as gMFI (right) in indicated aaMAIT cell subsets. n = 6 mice/group combined from two experiments. Unpaired, two tailed t test, **P = 0.00873. b) Extracellular acidification rate (ECAR) as detected by the Seahorse Bioanalyzer in spleen CD8+ T cells from mice at day 40 post BRD509 vaccination at baseline (Unstim) and in activated cells (CD3/28) in presence or absence of 2-Deoxyglucose (2-DG) with the concentration identical to Fig. 5c, showing an on-target effect. n = 3,5,4 mice per group from one experiment. Two-tailed, unpaired t tests, ****P < 0.0001. c) Pulmonary aaMAIT cells were isolated from mice >40 days post BRD509 vaccination and analyzed for metabolic and functional parameters during culture as pulmonary cell suspensions for 18 hrs with or without re-activation with 5-OP-RU and/or IL-2, IL-12, IL-18, as indicated. Representative histograms (left) and quantification (middle) of IL-17A production following 18 hrs re-activation. Glycolysis was inhibited by 2-deoxy-glucose (2-DG, green color). Each datapoint reflects an individual mouse, combined from two experiments. One way ANOVA, n.sP = 0.1821, n.sP = 0.1143. Right: Dose response and tests of activation mode dependence, TCR and/or cytokines, of 2-DG effect on IL-17A production with the indicated concentrations of 2-DG during 18 hrs of re-activation. d) Formulas applied for calculation of metabolic capacities and dependencies. Co = control, O = with oligomycin, DG = 2-DG, DGO = 2-DG plus oligomycin. All data displayed as mean ± s.e.m. Source numerical data are available in source data. Source data
Extended Data Fig. 9
Extended Data Fig. 9. Lower ATP in Klrg1+aaMAIT cells.
a) Fractional contribution of 13C to ATP after labeling for 18 hrs in absence of re-activation was quantified by mass spectrometry in CD127+ and Klrg1+ aaMAIT cells (>40 days after vaccination with BRD509). n = 4,2 from one experiment. Left: Unpaired two-tailed t test, ****P = 0.000098. Right: Mixed effect model, ***P = 0.0002. b) Relative abundances of ATP/ADP/AMP quantified by mass spectrometry in CD127+ or Klrg1+ MAIT cells. n = 4,2 from one experiment. Unpaired, two-tailed t-test, *P = 0.0212, n.sP = 0.150. All data displayed as mean ± s.e.m. Source numerical data are available in source data. Source data
Extended Data Fig. 10
Extended Data Fig. 10. Oxygen sensing and autophagy facilitate CD127+aaMAIT and IL-17 production.
a-b) Absolute numbers of Klrg1+ and CD127+ aaMAIT cells in lungs of mice with indicated genotypes at day40 post BRD509 vaccination. Each datapoint reflects an individual mouse from one of two experiments. a) Left: ****P < 0.0001, n.sP = 0.9668. Right: n.sP = 0.948, n.sP = 0.308, n.sP = 0.953. One-way ANOVA with Tukey´s multiple comparison testing. b) Left: *P = 0.0115, Right: n.sP = 0.145. Unpaired two-tailed t tests. c-d) Pulmonary aaMAIT cell subsets were isolated from mice and analyzed for cytokine production by intracellular flow cytometry following PMA/Ionomycin. Representative histograms and quantification of IL-17A and IFN-γ production. Each datapoint reflects an individual mouse from one of two experiments. Unpaired two-tailed t tests. **P = 0.00435, *P = 0.0294, *P = 0.0211. All data displayed as mean ± s.e.m. Source numerical data are available in source data. Source data

Comment in

References

    1. Godfrey DI, Koay HF, McCluskey J, Gherardin NA. The biology and functional importance of MAIT cells. Nat. Immunol. 2019;20:1110–1128. doi: 10.1038/s41590-019-0444-8. - DOI - PubMed
    1. Legoux F, Salou M, Lantz O. MAIT cell development and functions: the microbial connection. Immunity. 2020;53:710–723. doi: 10.1016/j.immuni.2020.09.009. - DOI - PubMed
    1. Kjer-Nielsen L, et al. MR1 presents microbial vitamin B metabolites to MAIT cells. Nature. 2012;491:717–723. doi: 10.1038/nature11605. - DOI - PubMed
    1. Corbett AJ, et al. T-cell activation by transitory neo-antigens derived from distinct microbial pathways. Nature. 2014;509:361–365. doi: 10.1038/nature13160. - DOI - PubMed
    1. Cerwenka A, Lanier LL. Natural killer cell memory in infection, inflammation and cancer. Nat. Rev. Immunol. 2016;16:112–123. doi: 10.1038/nri.2015.9. - DOI - PubMed

Publication types