. 2023 Jul;3(7):846-865.
doi: 10.1038/s43587-023-00420-2. Epub 2023 May 25.

Senescence-induced immune remodeling facilitates metastatic adrenal cancer in a sex-dimorphic manner

Affiliations

Senescence-induced immune remodeling facilitates metastatic adrenal cancer in a sex-dimorphic manner

Kate M Warde et al. Nat Aging. 2023 Jul.

Abstract

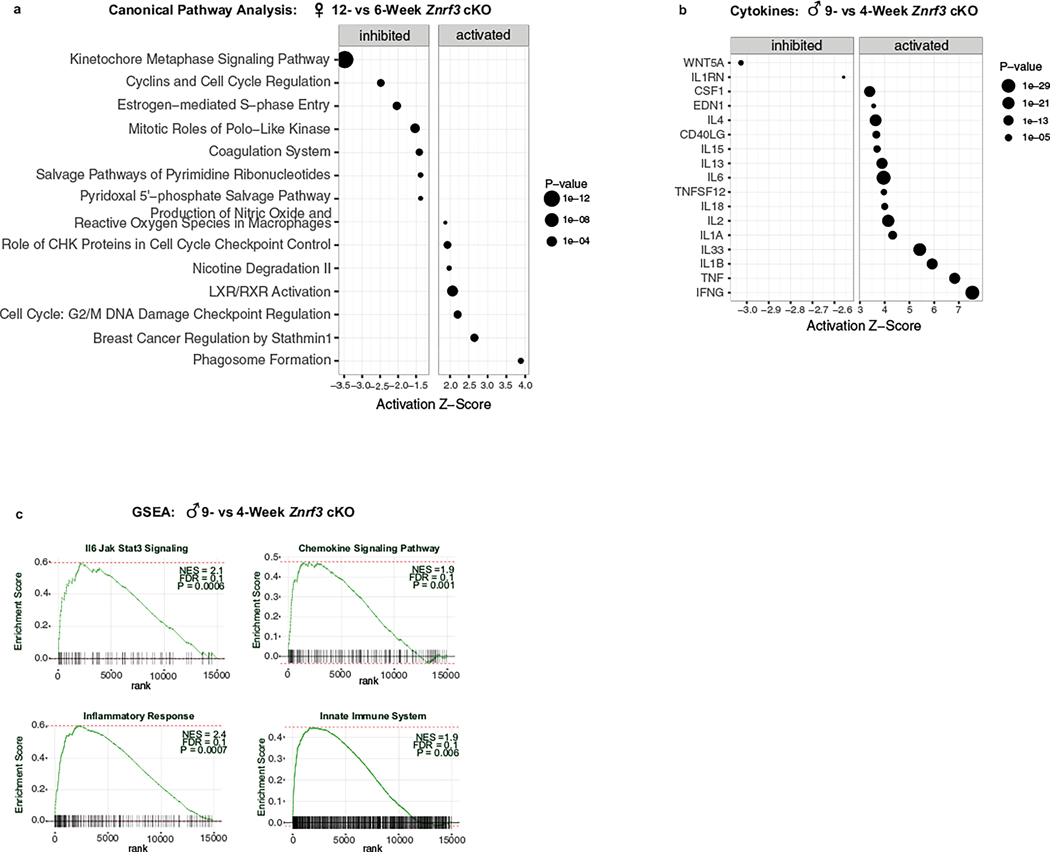
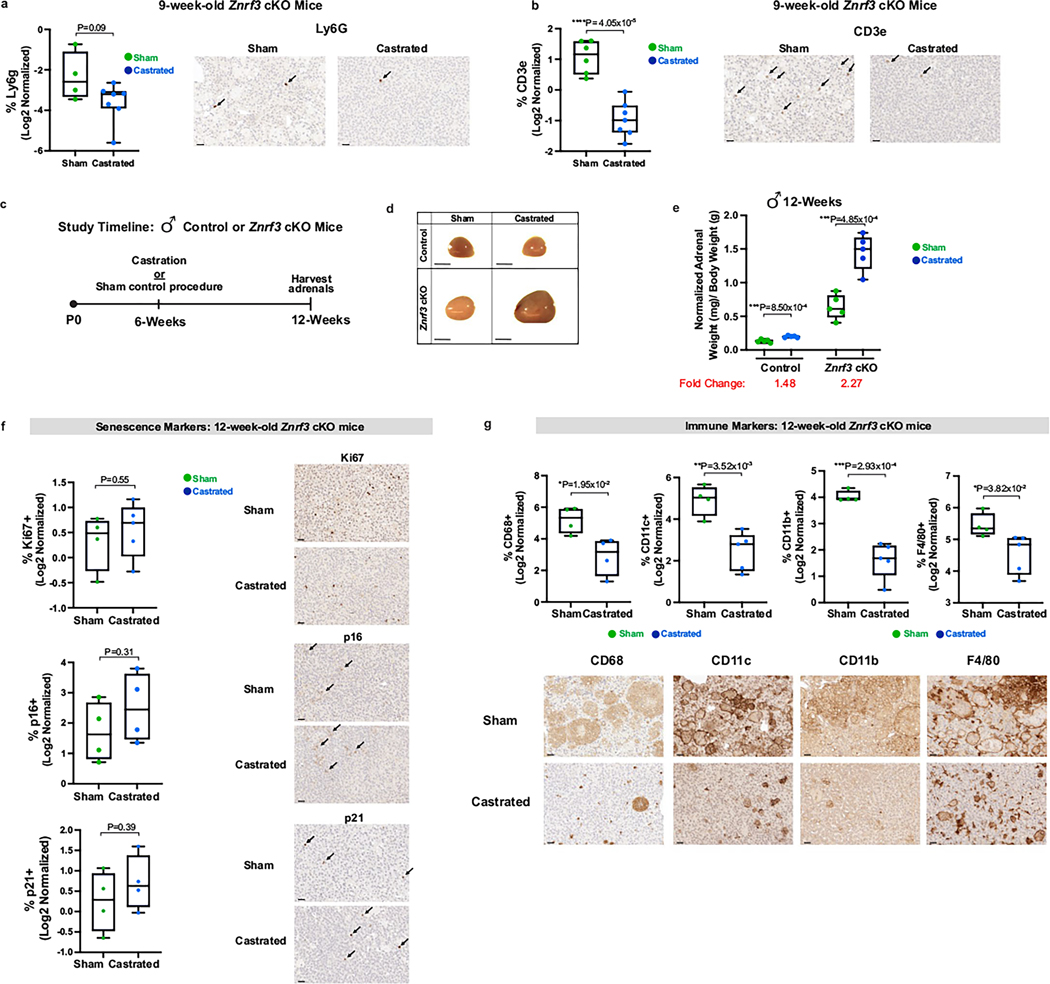
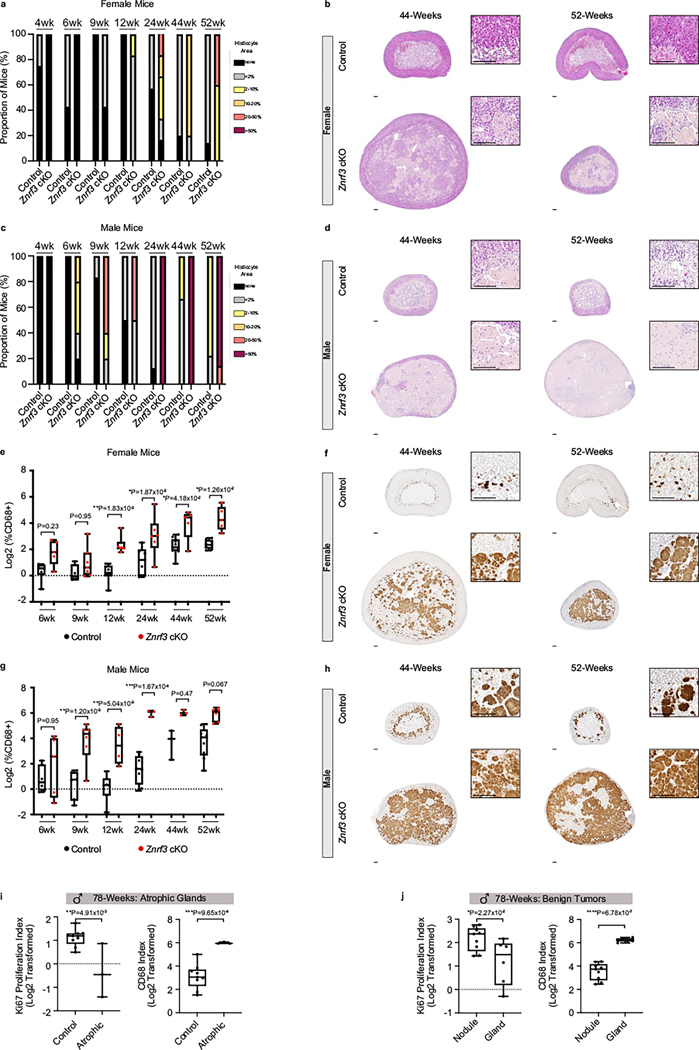
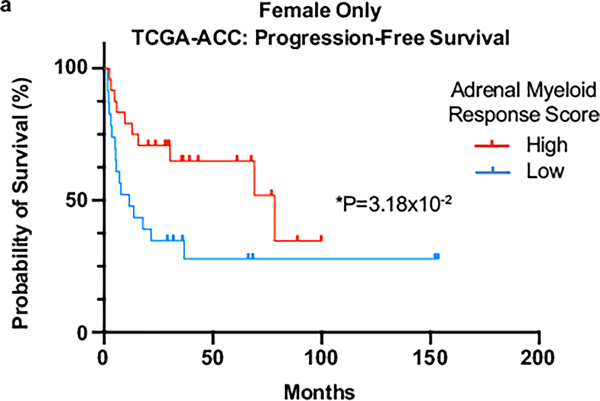
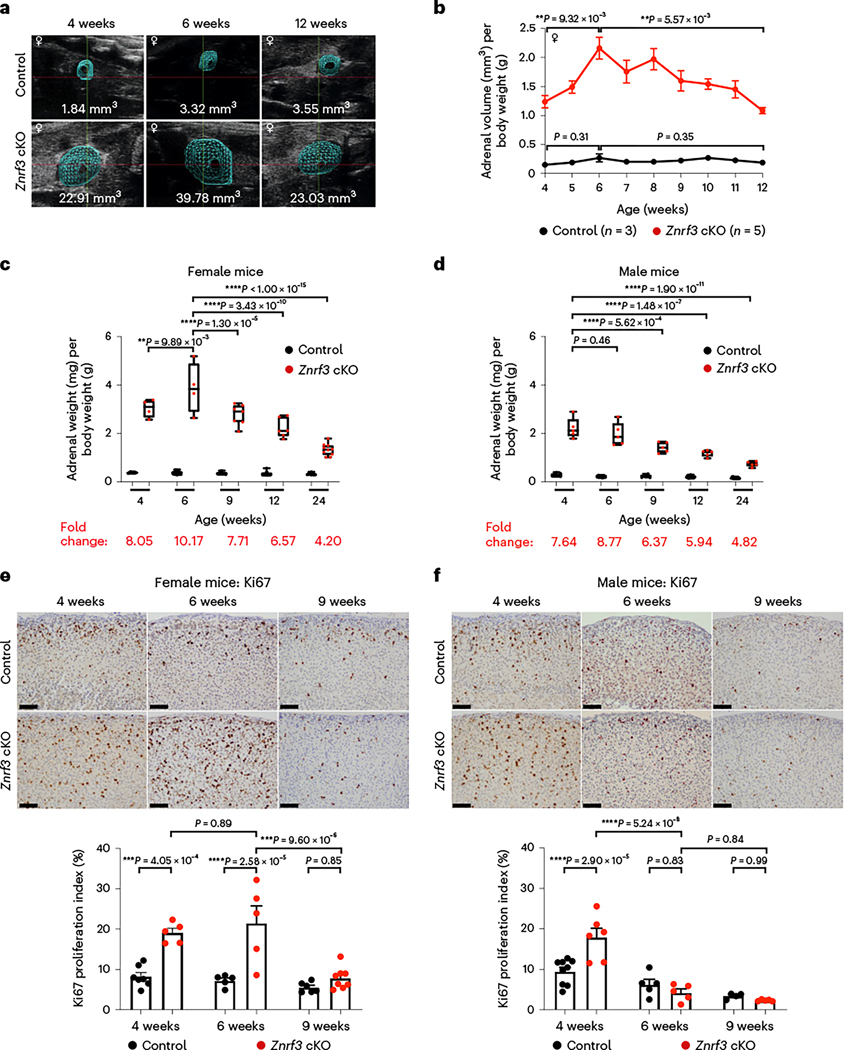
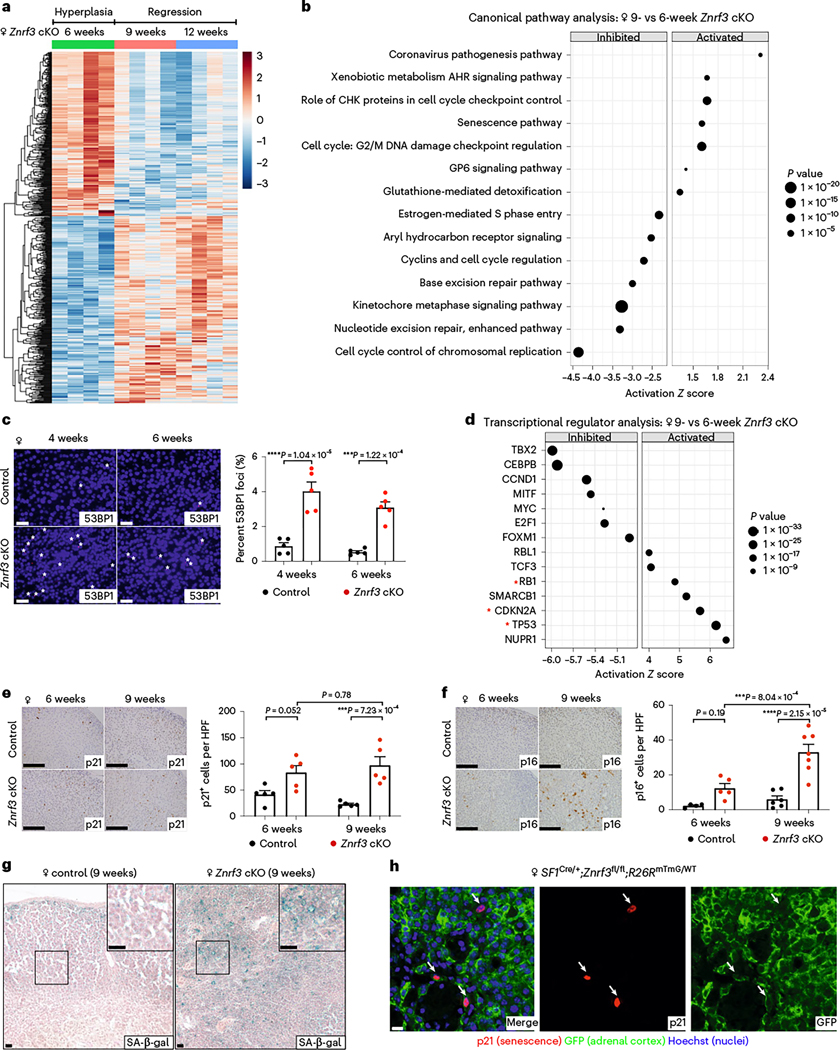
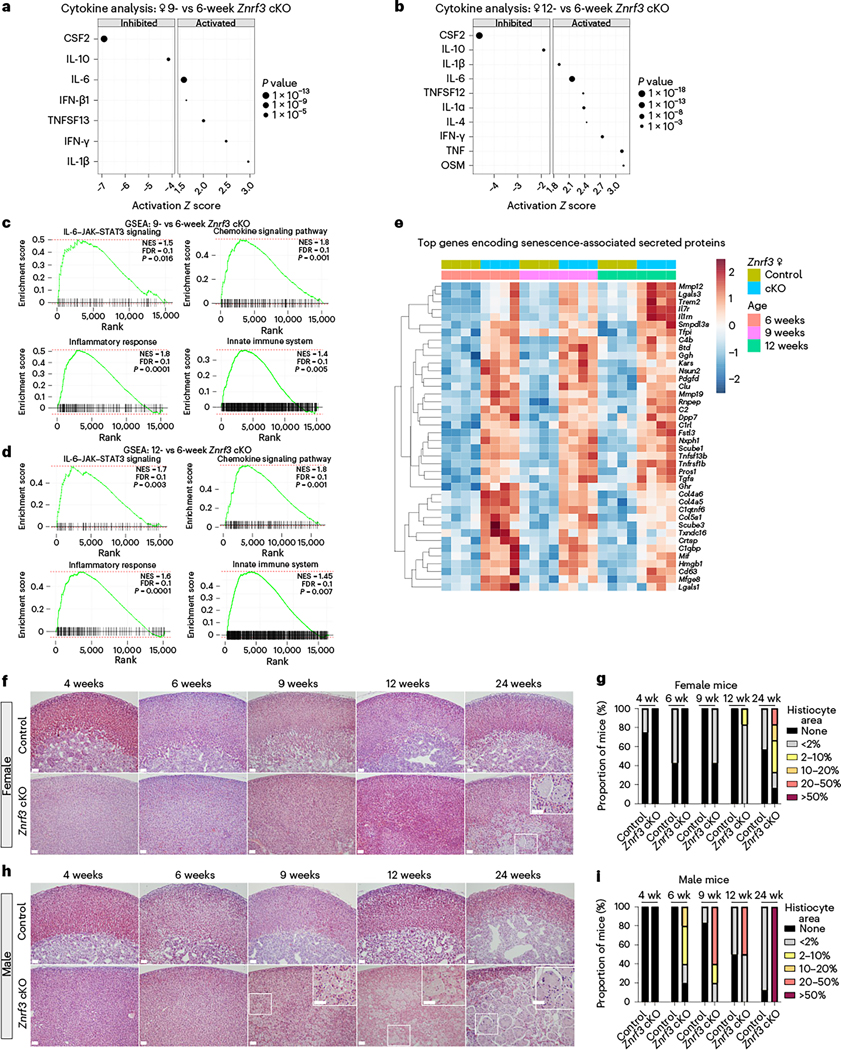
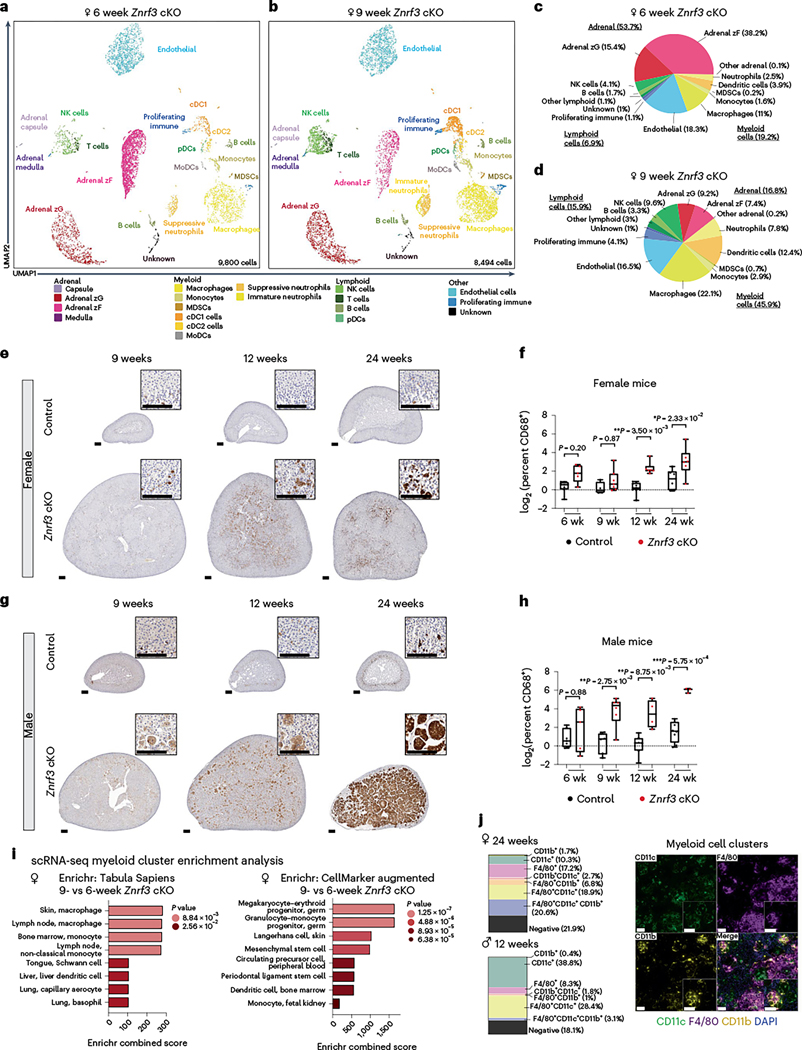
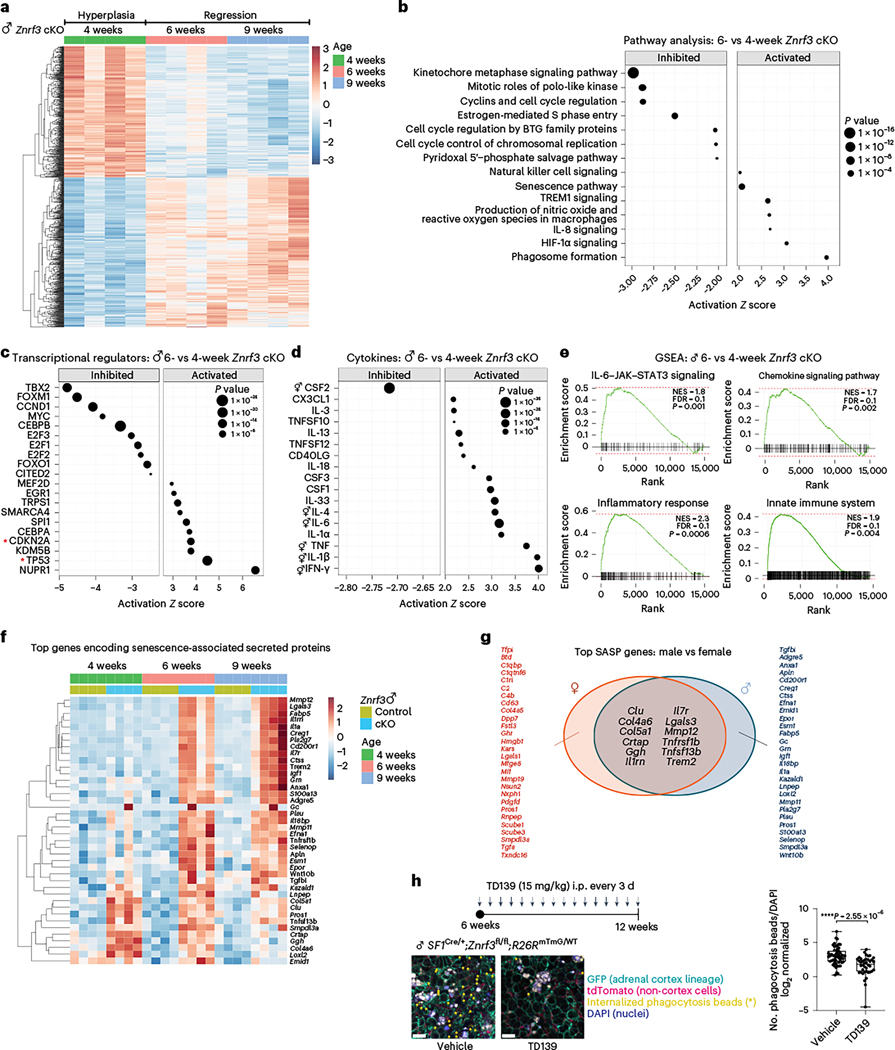
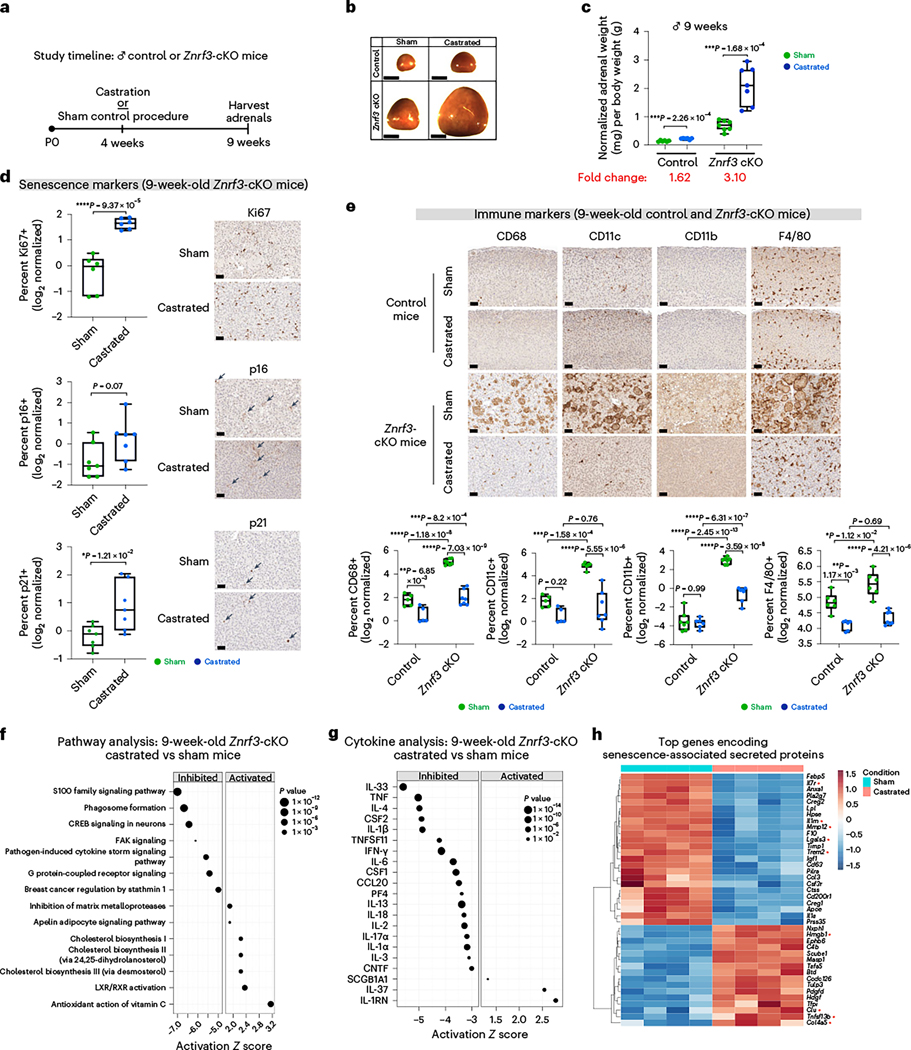
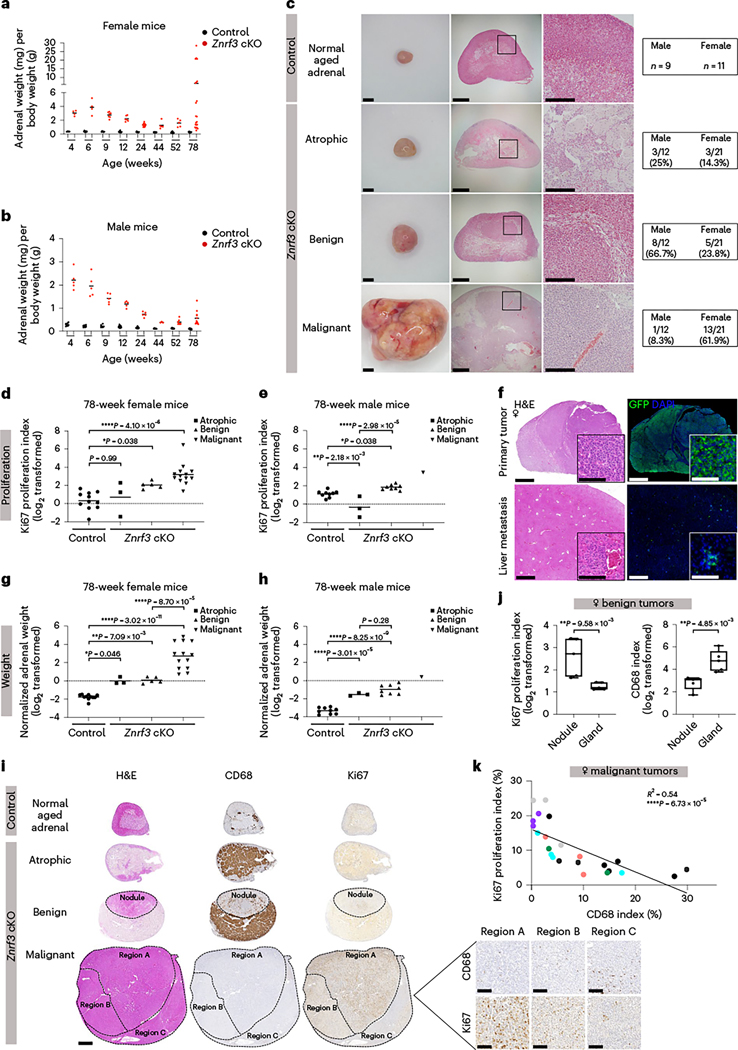
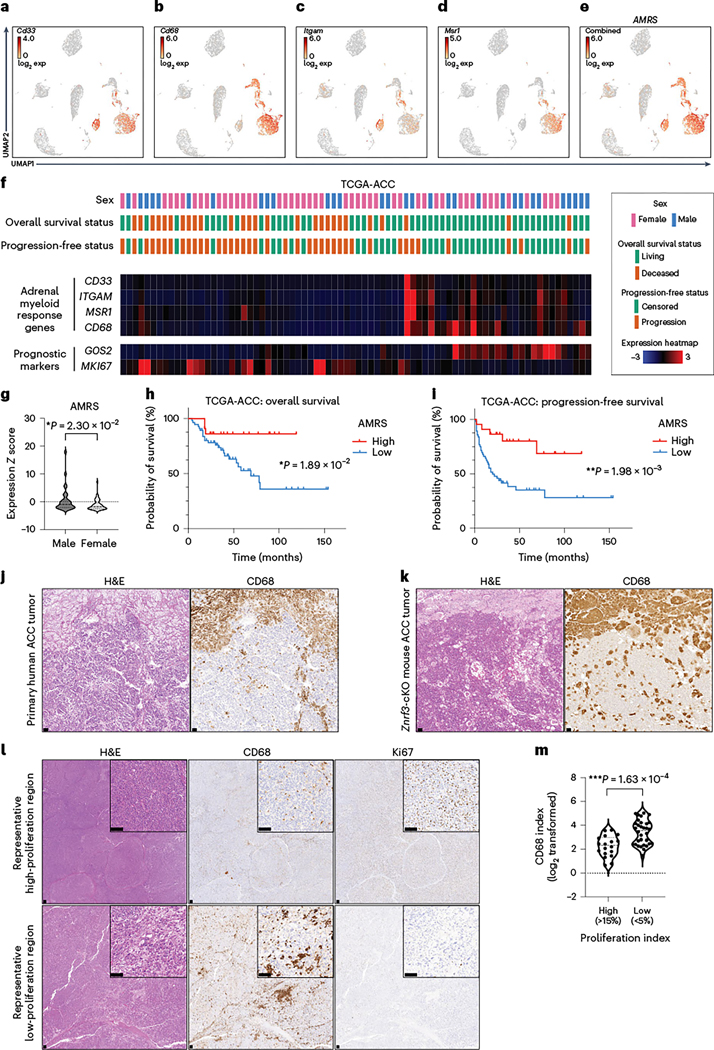
Aging markedly increases cancer risk, yet our mechanistic understanding of how aging influences cancer initiation is limited. Here we demonstrate that the loss of ZNRF3, an inhibitor of Wnt signaling that is frequently mutated in adrenocortical carcinoma, leads to the induction of cellular senescence that remodels the tissue microenvironment and ultimately permits metastatic adrenal cancer in old animals. The effects are sexually dimorphic, with males exhibiting earlier senescence activation and a greater innate immune response, driven in part by androgens, resulting in high myeloid cell accumulation and lower incidence of malignancy. Conversely, females present a dampened immune response and increased susceptibility to metastatic cancer. Senescence-recruited myeloid cells become depleted as tumors progress, which is recapitulated in patients in whom a low myeloid signature is associated with worse outcomes. Our study uncovers a role for myeloid cells in restraining adrenal cancer with substantial prognostic value and provides a model for interrogating pleiotropic effects of cellular senescence in cancer.


Conflict of interest statement

Competing interests

The authors declare no competing interests.

Figures

Extended Data Fig. 1 |
Extended Data Fig. 1 |. Ultrasound imaging provides an accurate measure of adrenal size in real-time.
(a) Images of adrenal ultrasound area, ultrasound volume, and gross histology from representative animals with adrenals of varying size. Scale bars, 1 mm. (b) Adrenal area and (c) adrenal volume are significantly correlated with adrenal weight. Ultrasound imaging was performed 24-hours prior to necropsy. All data shown is from female mice. Each dot represents an individual animal. Statistical analysis was performed using simple linear regression.
Extended Data Fig. 2 |
Extended Data Fig. 2 |. Znrf3 cKO adrenals activate cellular senescence during adrenal regression.
(a, b) Apoptotic cell death as measured by cleaved caspase 3 (CC3) is not significantly increased in female or male Znrf3 cKO adrenals compared to controls during the initial phase of tissue regression. Quantification of CC3-positive cells was performed using QuPath digital image analysis based on the number of positive cells and normalized to total adrenal cortex nuclei. Arrows indicate CC3-positive cells. Dashed line indicates histological boundary between adrenal cortex and medulla. Scale bars, 100 μm. (c) DNA damage as measured by 53BP1 foci is significantly increased in male Znrf3 cKO adrenals compared to controls at 4- and 6-weeks of age. Quantification of 53BP1 foci was performed using QuPath digital image analysis based on the number of positive foci and normalized to total nuclei. Asterisks indicate 53BP1-positive foci. Scale bars, 10 μm. (d) p21, (e) p16INK4a, and (f) senescence-associated beta-galactosidase (SA-β-gal) are significantly increased in 9-week male Znrf3 cKO adrenals compared to controls. Scale bars, 100 μm. Quantification of p21 and p16INK4a IHC was performed using QuPath digital image analysis based on the number of positive cells per high powered field (HPF). Representative SA-β-gal images obtained from analysis of 3 independent mice is shown. Each dot represents an individual animal. Error bars represent mean ± s.e.m. Statistical analysis was performed using two-way ANOVA followed by Tukey’s multiple comparison’s test.
Extended Data Fig. 3 |
Extended Data Fig. 3 |. Senescent female Znrf3 cKO adrenal glands activate production of cytokines and growth factors.
(a) URA using RNA-seq data predicts significantly activated and inhibited cytokines in 9-week and (b) week female Znrf3 cKO adrenal tissue compared to 6-week, p < 0.05. (c) URA predicts significantly activated and inhibited growth factors in 9-week and (d) 12-week female Znrf3 cKO adrenal tissue compared to 6-week, p < 0.05. Data is representative of 4 biological replicates per group, statistical analysis in IPA was performed using a right-tailed fishers exact test, p < 0.05.
Extended Data Fig. 4 |
Extended Data Fig. 4 |. Sex- and stage-specific differences in gene expression in control and Znrf3 cKO adrenals.
Bulk RNA-seq analysis reveals the top DEGs based on (a-c) sex or (d-f) phenotypic stage in control and Znrf3 cKO adrenals. Heatmaps of the top 50 DEGs are shown, statistical analysis was perform using the Wald test, p adj <0.05. Known sex-linked genes were excluded from the analysis.
Extended Data Fig. 5 |
Extended Data Fig. 5 |. Inflammation and cytokine production in male senescent Znrf3 cKO adrenal glands is further enhanced at 9-weeks.
(a) IPA identifies the most significantly altered canonical pathways in 12- vs 6-week female Znrf3 cKO adrenals. Similar pathways are altered earlier in male Znrf3 cKOs, consistent with the more accelerated phenotype in males. (b) IPA identified the top activated and inhibited cytokines in 9- vs 4-week male Znrf3 cKO adrenals, p < 0.05. (c) GSEA for inflammatory signatures (IL6/JAK/STAT3 signaling, chemokine signaling, the inflammatory response, and the innate immune system) identifies positively enriched genes in 9- vs 4-week male Znrf3 cKO mice. Data is representative of 4 biological replicates per group and, statistical analysis in IPA was performed using a right-tailed fishers exact test, p < 0.05.
Extended Data Fig. 6 |
Extended Data Fig. 6 |. Androgen deprivation restricts immune infiltration in early and late models of castration in male adrenals.
Markers of (a) neutrophils (Ly6g) and (b) T cells (CD3e) are reduced in castrated male Znrf3 cKO mice compared to sham controls. Scale bars 20μM. Castration was performed at 4-weeks of age and analysis was performed at 9-weeks of age. To further tease apart a role for androgens in the early (cell cycle arrest) versus late (immune) senescent response, (c) male Znrf3 cKO mice were castrated at 6-weeks of age when hyperproliferation has normally already been suppressed. (d-e) At 12-weeks of age, adrenal glands from castrated mice were significantly larger than sham-operated controls. (d) Representative gross histology images. Scale bars 1 mm. (e) Normalized adrenal weight. Relative fold change is indicated below each group. (f) Senescence markers (Ki67, p16, and p21) and (g) myeloid immune markers (CD68, CD11c, CD11b, and F4/80) in adrenals from sham versus castrated animals. Representative images are shown for each group. Scale bars 20 μM. Quantification was performed using QuPath digital image analysis based on the number of positive cells normalized to total nuclei. Each dot represents an individual animal. Box and whisker plots indicate the median (line) within the upper (75%) and lower (25%) quartiles, and whiskers represent the range. Statistical analysis was performed using two-tailed Student’s t-test.
Extended Data Fig. 7 |
Extended Data Fig. 7 |. Immune cell recruitment in the adrenal gland is sex- and age-dependent.
(a, b) Histological evaluation of female control and Znrf3 cKO adrenal tissue based on H&E. Female Znrf3 cKOs continue to accumulate histiocytes with advanced aging at 44- and 52-weeks of age. (c-d) Male Znrf3 cKOs sustain high levels of histiocytes previously observed as early as 24-weeks of age. Quantification was performed using QuPath digital analysis based on the proportion of histiocyte area normalized to total adrenal cortex area. Scale bars, 100 μm. Data from 4- to 24-weeks of age was previously shown in Fig. 3f-i, and is included as reference. (e-f) In situ validation of myeloid cell accumulation based on IHC for CD68 in control and Znrf3 cKO adrenal tissue from female and (g-h) male cohorts at 44- and 52-weeks of age. Data from 4- to 24-weeks of age was previously shown in Fig. 4e-h, and is included as reference. Quantification was performed using QuPath digital analysis based on the number of positive cells normalized to total nuclei. Each dot represents an individual animal. Box and whisker plots indicate the median (line) within the upper (75%) and lower (25%) quartiles, and whiskers represent the range. Statistical analysis was performed on log2 transformed data using two-way ANOVA followed by Tukey’s multiple comparison’s test. Scale bars, 100 μm. (i) At 78-weeks of age, atrophic Znrf3 cKO adrenal glands have a significantly lower Ki67-index and higher CD68-index compared to age-matched controls. (j) In 78-week-old benign Znrf3 cKO adrenals, nodules have a significantly higher Ki67-index and lower CD68-index compared to the background gland. Each dot represents an individual animal. Box and whisker plots represent mean with variance across quartiles. Statistical analysis was performed using two-tailed Student’s t-test.
Extended Data Fig. 8 |
Extended Data Fig. 8 |. A low myeloid response score (MRS) is associated with worse patient outcome in female ACC.
(a) Low adrenal myeloid response score (AMRS) is associated with shorter progression-free survival in female TCGA-ACC patients. Statistical analysis was performed using Log-rank Mantel-Cox test.
Fig. 1 |
Fig. 1 |. Following an initial phase of significant hyperplasia, ZNRF3-deficient adrenal glands regress over time.
a, Ultrasound imaging provides a non-invasive method for measuring adrenal size in real time. Representative three-dimensional ultrasound images from a female control and a Znrf3-cKO mouse are shown at 4 weeks (initiation of study), 6 weeks (maximum volume) and 12 weeks (end of study) of age. b, Weekly ultrasound monitoring in female control and Znrf3-cKO mice identifies a phenotypic switch from hyperplasia to regression at 6 weeks of age. Statistical analysis was performed using one-way ANOVA followed by Tukey’s post hoc test. Error bars represent mean ± s.e.m. c, Adrenal weight measurements over time confirm significant adrenal regression in female Znrf3-cKO mice beginning after 6 weeks of age. d, In males, adrenal weight peaks earlier than females at 4 weeks and progressively declines with increased age. c,d, Each dot represents an individual animal. Box-and-whisker plots indicate the median (line) within the upper (75%) and lower (25%) quartiles, and whiskers represent the range. e, Proliferation as measured by Ki67 is significantly increased in adrenals of 4- and 6-week-old female Znrf3-cKO mice compared to controls. At the onset of adrenal regression (9 weeks), proliferation is significantly reduced in ZNRF3-deficient adrenals. f, Male Znrf3-cKO mice similarly exhibit hyperproliferation at 4 weeks of age. However, proliferation returns to baseline by 6 weeks, which is earlier than in females. e,f, Each dot represents an individual animal. Error bars represent mean ± s.e.m. Statistical analysis was performed using two-way ANOVA followed by Tukey’s multiple-comparison test. Scale bars, 100 μm.
Fig. 2 |
Fig. 2 |. The switch from hyperplasia to regression is marked by activation of cellular senescence.
a, Bulk RNA-seq reveals a significant change in gene expression signature during the switch from hyperplasia to regression. Heatmap of significant DEGs in adrenals from female Znrf3-cKO animals at 6, 9 and 12 weeks of age (Padj < 0.05). b, IPA identifies the most significantly altered canonical pathways in 9-versus 6-week-old female Znrf3-cKO adrenals; statistical analysis was performed using a right-tailed Fisher’s exact test (P < 0.05). AHR, aryl hydrocarbon receptor; CHK, Csk homologous kinase; GP6, Glycoprotein VI. c, DNA damage as measured by 53BP1 foci is significantly increased in female Znrf3-cKO adrenals compared to those of controls at 4 and 6 weeks of age. Quantification of 53BP1 foci was performed using QuPath digital image analysis based on the number of positive foci and normalized to total nuclei. Asterisks indicate 53BP1-positive foci. Scale bars, 10 μm. d, IPA of the most significantly activated or inhibited transcriptional regulators in adrenals of 9-versus 6-week-old female Znrf3-cKO animals. Red asterisks highlight transcriptional regulators associated with cellular senescence. p21 (e), p16INK4a (f) and SA-β-gal (g) are significantly increased in adrenals of 9-week-old female Znrf3-cKO animals compared to those of controls. Scale bars, 100 μm. Quantification of p21 and p16INK4a IHC was performed using QuPath digital image analysis based on the number of positive cells per high-powered field (HPF). Representative SA-β-gal images obtained from analysis of three independent mice are shown. h, Co-staining of p21 and GFP in 9-week-old female Znrf3-cKO mice containing the R26RmTmG lineage reporter tool confirms that p21-positive senescent cells are GFP-positive adrenal cortex cells. Representative images obtained from analysis of five female and seven male animals are shown. Scale bar, 10 μm. WT, wild type. b,d, IPA analysis includes four biological replicates per group. Statistical tests were performed using IPA (P < 0.05). c,e,f, Error bars represent mean ± s.e.m. Each dot represents an individual animal. Statistical analysis was performed using two-way ANOVA followed by Tukey’s multiple-comparison test.
Fig. 3 |
Fig. 3 |. Senescent Znrf3-cKO adrenal glands develop a functional SASP.
URA using bulk RNA-seq data predicts significantly activated and inhibited cytokines in adrenal tissue from Znrf3-cKO animals at 9 weeks (a) and 12 weeks (b) compared to 6 weeks. Data are representative of four biological replicates per group. Statistical analysis in IPA was performed using a right-tailed Fisher’s exact test (P < 0.05). c,d, GSEA for inflammatory signatures (IL-6–Janus kinase ( JAK)–signal transducer and activator of transcription 3 (STAT3) signaling, chemokine signaling, the inflammatory response and the innate immune system) identifies positively enriched pathways in adrenal tissue from Znrf3-cKO animals at 9 weeks (c) and 12 weeks (d) compared to 6 weeks. FDR, false discovery rate; NES, normalized enrichment score. e, Heatmap representing supervised hierarchical clustering of the 40 most significant DEGs that encode secreted proteins compared to controls; statistical analysis was performed using the Wald test (Padj < 0.05). f,g, Histological evaluation of adrenal tissue from female control and Znrf3-cKO animals based on H&E staining. Female Znrf3-cKO animals accumulate histiocytes (inset) between 12 and 24 weeks (wk) of age. h,i, Histiocytes (insets) accumulate earlier and occupy a larger proportion of the adrenal gland in male Znrf3-cKO animals than in female animals. Quantification was performed using QuPath digital analysis based on the proportion of histiocyte area normalized to the total adrenal cortex area. Scale bars, 100 μm.
Fig. 4 |
Fig. 4 |. scRNA-seq reveals activation of innate and adaptive immune systems in response to cellular senescence and the SASP.
Uniform manifold approximation and projection (UMAP) plots with cluster identification of cell types in adrenal glands of female Znrf3-cKO animals at 6 weeks (9,800 cells) (a) compared to 9 weeks (8,494 cells) (b). Adrenal zG, adrenal zona glomerulosa; adrenal zF, adrenal zona fasciculata; cDC1, conventional type 1 DC; cDC2, conventional type 2 DC; MDSC, myeloid-derived suppressor cell; MoDC, monocyte-derived dendritic cell; NK, natural killer; pDC, plasmacytoid dendritic cell. c,d, Proportions of major adrenal, myeloid, lymphoid and other populations in 6-week and 9-week Znrf3-cKO samples are visualized according to the percentage of total cells. In situ validation of myeloid cell accumulation based on IHC for CD68 in control and Znrf3-cKO adrenal tissue from female (e,f) and male (g,h) cohorts. Quantification was performed using QuPath digital analysis based on the number of positive cells normalized to total nuclei. Each dot represents an individual animal. Box-and-whisker plots indicate the median (line) within the upper (75%) and lower (25%) quartiles, and whiskers represent the range. Statistical analysis was performed on log2 transformed data using two-way ANOVA followed by Tukey’s multiple-comparison test. Scale bars, 100 μm. i, Enrichment analysis using Enrichr for myeloid cell clusters (macrophages, DCs, monocytes and myeloid-derived suppressor cells) based on significant DEGs between 9- and 6-week Znrf3-cKO mice. Combined score indicates the log (P value) × z score. Padj values are indicated for the respective color groups and were calculated using Fisher’s exact test. j, Multiplex immunofluorescence images of multi-nucleated myeloid clusters based on staining for CD11c (green), F4/80 (purple), CD11b (yellow) and 4,6-diamidino-2-phenylindole (DAPI) (blue). Images shown are from a 24-week-old female Znrf3-cKO animal and are representative of clusters observed in staining of five independent 24-week-old female Znrf3-cKO animals and four 12-week-old male Znrf3-cKO mice. Quantification was performed using QuPath digital analysis on manually annotated fused cell clusters based on the percentage of total nuclei in each cluster and are visualized as parts of a whole. Scale bars, 50 μm.
Fig. 5 |
Fig. 5 |. Senescence-mediated immune activation in male Znrf3-cKO mice is characterized by higher SASP induction.
a, Heatmap of the top 1,000 DEGs in adrenals from Znrf3-cKO animals at 4, 6 and 9 weeks of age (Padj < 0.05). IPA identified the top inhibited (a) and activated (b) canonical pathways, transcriptional regulators (c) and cytokines (d) in adrenals from male Znrf3-cKO animals at 6 versus 4 weeks (P < 0.05). Data are representative of four biological replicates per group, and statistical analysis in IPA was performed using a right-tailed Fisher’s exact test. BTG, B cell translocation gene; HIF-1a, hypoxia-inducible factor 1-alpha; TREM1, triggering receptor expressed on myeloid cells 1. e, GSEA for inflammatory signatures (IL-6–JAK–STAT3 signaling, chemokine signaling, the inflammatory response and the innate immune system) identifies positively enriched pathways in adrenals from male Znrf3-cKO animals at 6 versus 4 weeks. f, Heatmap representing supervised hierarchical clustering of the 40 most significant DEGs that encode secreted proteins in adrenals from male Znrf3-cKO animals compared to those of controls; statistical analysis was performed using the Wald test (Padj < 0.05). g, Comparison of the top SASP genes in males and females identified 12 shared factors induced in both sexes. h, Pharmacological inhibition of galectin 3 (encoded by Lgals3) with the selective inhibitor TD139 significantly reduced phagocytic activity in adrenal tissue from male Znrf3-cKO mice containing the R26RmTmG lineage reporter. Quantification of internalized phagocytosis beads (asterisks) was performed using QuPath digital analysis based on the number of fluorescent beads normalized to DAPI (nuclei) values. Auto-fluorescent lipid content (white) is present in large fused clusters. Three adrenal tissue slices from four independent animals per group were analyzed. i.p., intraperitoneally. Box- and-whisker plots indicate the median (line) within the upper (75%) and lower (25%) quartiles, and whiskers represent the range. Statistical analysis was performed using two-tailed Student’s t-test. Scale bars, 20 μm.
Fig. 6 |
Fig. 6 |. Androgen deprivation restricts immune infiltration in male adrenals.
a, Male control or Znrf3-cKO mice were castrated at 4 weeks of age to lower androgen levels. b,c, At 9 weeks of age, adrenal glands from castrated mice were significantly larger than those from sham-operated controls. b, Representative gross histology images are shown. Scale bars, 1 mm. c, Normalized adrenal weight. Each dot represents an individual animal. Box-and-whisker plots indicate the median (line) within the upper (75%) and lower (25%) quartiles, and whiskers represent the range. Relative fold change is indicated below each group. Senescence markers (Ki67, p16 and p21) (d) and myeloid immune markers (CD68, CD11c, CD11b and F4/80) (e) in adrenals from sham-operated versus castrated animals. Representative images are shown for each group. Scale bars, 20 μm. Quantification was performed using QuPath digital image analysis based on the number of positive cells normalized to total nuclei. Each dot represents an individual animal. Box-and-whisker plots represent mean with variance across quartiles. Statistical analysis was performed using two-tailed Student’s t-test (c,d) or two-way ANOVA (e) followed by Tukey’s multiple-comparison test. IPA of RNA-seq data from adrenals of 9-week-old males identified the top inhibited and activated canonical pathways (f) and cytokines (g) in adrenals from castrated versus sham-operated Znrf3-cKO animals; statistical analysis in IPA was performed using a right-tailed Fishers exact test (P < 0.05). CREB, cAMP response element-binding protein; FAK, focal adhesion kinase; LXR, liver X receptor; RXR, retinoid X receptor. h, Heatmap representing supervised hierarchical clustering of the 40 most significant DEGs that encode secreted proteins in adrenals from castrated compared to sham-operated Znrf3-cKO mice; statistical analysis was performed using the Wald test (Padj < 0.05). Asterisks indicate genes previously identified as shared SASP components common to both male and female Znrf3-cKO animals. Data are representative of four biological replicates per group, and statistical tests were performed using IPA.
Fig. 7 |
Fig. 7 |. Following senescence-mediated remodeling of the tissue microenvironment, metastatic ACC tumors arise in a sex-dimorphic manner.
Adrenal weight measurements in cohorts of female (a) and male (b) control and Znrf3-cKO mice, including at 44, 52 and 78 weeks of age. After 52 weeks, adrenal tumors of varying sizes begin to form. Each dot represents an individual animal. The black line indicates the mean. c, Representative images of the gross histology (left) and H&E staining (middle and right) from each pathology observed at 78 weeks of age. Blinded samples were scored as atrophic, benign or malignant. The respective proportion of each pathology in male compared to female cohorts is indicated. Scale bars, 1 mm (left), 200 μm (middle);, 500 μm (right). d,e, Proliferation as measured by the Ki67 index is significantly higher, with progression to benign and malignant tumors in Znrf3-cKO mice. Each symbol represents an individual animal. The black line indicates the mean. Statistical analysis was performed using one-way ANOVA followed by Tukey’s post hoc test. f, Malignant tumors metastasize to distant sites, including the liver. Representative images are shown from mice expressing the R26RmTmG lineage reporter, which permanently labels adrenal cortex cells with GFP. Scale bars, 100 μm. g,h, Tissue weight is significantly higher, with progression to benign and malignant tumors in Znrf3-cKO mice. Each symbol represents an individual animal. The black line indicates the mean. Statistical analysis was performed using one-way ANOVA followed by Tukey’s post hoc test. i, Representative H&E (left), CD68 (middle) and Ki67 (right) staining in atrophic, benign and malignant adrenals from Znrf3-cKO 78-week-old mice. Scale bars, 500 μm (whole tissue), 100 μm (high-magnification inset). j, In Znrf3-cKO adrenals, benign nodules have a significantly higher Ki67 index and lower CD68 index than the background gland. Each dot represents an individual nodule. Box-and-whisker plots indicate the median (line) within the upper (75%) and lower (25%) quartiles, and whiskers represent the range. Statistical analysis was performed using two-tailed Student’s t-test. k, In malignant tumors, there is a significant inverse correlation between the Ki67 index and the CD68 index. Each dot represents a distinct tumor region. Colors represent distinct regions from the same tumor. Statistical analysis was performed using simple linear regression (n = 23 tumor regions from six animals).
Fig. 8 |
Fig. 8 |. A low myeloid response is associated with worse patient outcome in ACC.
UMAP of scRNA-seq data from adrenal tissue of female Znrf3-cKO animals. Expression of individual myeloid cell markers Cd33 (a), Cd68 (b), Itgam (also known as CD11b) (c) and Msr1 (also known as CD204) (d) is shown. e, The combined expression of these four markers was used to generate an AMRS. Exp, expression. f, Analysis of TCGA-ACC data, including patient demographics and outcome, in accordance with mRNA expression of AMRS genes (CD33, CD68, ITGAM, MSR1) and established prognostic markers (high MKI67 (proliferation) and low G0S2 (recurrent disease)). AMRS is significantly lower in female than in male TCGA patients with ACC (g), and low AMRS is associated with shorter overall (h) and progression-free (i) survival. j, In primary human ACC tumors, CD68+ histiocytes are found in a subset of cases. k, A representative example region is shown relative to a Znrf3-cKO mouse adrenal tumor. l,m, The infiltration of CD68+ myeloid cells in primary human ACC tumors is heterogeneous. Regions with a high Ki67 index (>15%) have a significantly lower CD68 index than regions of low proliferation (Ki67 < 5%). IHC quantification was performed using QuPath digital analysis based on the number of positive cells normalized to total nuclei. Tumor-associated stroma and highly necrotic regions were excluded from analysis. Each dot represents a distinct tumor region (n = 50 tumor regions from 38 patients). Statistical analysis was performed using two-tailed Mann–Whitney test (g), log-rank Mantel–Cox test (h,i) or two-tailed Student’s t-test (m). Scale bars, 100 μm.

Comment in

References

    1. National Cancer Institute. Age and Cancer Risk https://www.cancer.gov/about-cancer/causes-prevention/risk/age (2021).
    1. Siegel RL, Miller KD & Jemal A. Cancer statistics, 2018. CA Cancer J. Clin 68, 7–30 (2018). - PubMed
    1. Rozhok A. & DeGregori J. A generalized theory of age-dependent carcinogenesis. eLife 8, e39950 (2019). - PMC - PubMed
    1. Laconi E, Marongiu F. & DeGregori J. Cancer as a disease of old age: changing mutational and microenvironmental landscapes. Br. J. Cancer 122, 943–952 (2020). - PMC - PubMed
    1. Phillip JM, Aifuwa I, Walston J. & Wirtz D. The mechanobiology of aging. Annu. Rev. Biomed. Eng 17, 113–141 (2015). - PMC - PubMed

Publication types