. 2024 Feb;42(2):293-304.
doi: 10.1038/s41587-023-01767-y. Epub 2023 May 25.

Dictionary learning for integrative, multimodal and scalable single-cell analysis

Affiliations

Dictionary learning for integrative, multimodal and scalable single-cell analysis

Yuhan Hao et al. Nat Biotechnol. 2024 Feb.

Abstract

Mapping single-cell sequencing profiles to comprehensive reference datasets provides a powerful alternative to unsupervised analysis. However, most reference datasets are constructed from single-cell RNA-sequencing data and cannot be used to annotate datasets that do not measure gene expression. Here we introduce 'bridge integration', a method to integrate single-cell datasets across modalities using a multiomic dataset as a molecular bridge. Each cell in the multiomic dataset constitutes an element in a 'dictionary', which is used to reconstruct unimodal datasets and transform them into a shared space. Our procedure accurately integrates transcriptomic data with independent single-cell measurements of chromatin accessibility, histone modifications, DNA methylation and protein levels. Moreover, we demonstrate how dictionary learning can be combined with sketching techniques to improve computational scalability and harmonize 8.6 million human immune cell profiles from sequencing and mass cytometry experiments. Our approach, implemented in version 5 of our Seurat toolkit ( http://www.satijalab.org/seurat ), broadens the utility of single-cell reference datasets and facilitates comparisons across diverse molecular modalities.


Figures

Figure 1.
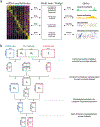
Figure 1.. Integrating across modalities with molecular bridges.
(a) Broad schematic of bridge integration workflow. Two datasets where different modalities are measured (e.g. scRNA-seq and scATAC-seq), can be harmonized via a third dataset where both modalities are simultaneously measured (e.g. 10x multiome). We demonstrate bridge integration using a variety of multi-omic technologies that can be used as bridges, including 10x multiome, Paired-Tag, snmC2T, and CITE-seq, each of which facilitates integration with a different molecular modality. Middle box lists alternative multi-omic technologies that can be used to generate bridge datasets. (b) Mathematical schematic of each of the steps in the bridge integration procedure. A full description is provided in the Supplementary Methods. For clarity, the matrix names illustrated in this schematic are the same as the matrix names defined in the Supplementary Methods.
Figure 2.
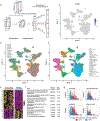
Figure 2.. Mapping scATAC-seq data onto scRNA-seq references
(a) UMAP visualization scRNA-seq reference dataset of human bone marrow, representing 297,627 annotated scRNA-seq profiles. (b) UMAP visualization of an scATAC-seq query dataset from (Granja et al, 2019), representing 26,159 profiles spanning five batches, three of which are enriched for CD34 expressing cells. (c) After bridge integration, query cells are annotated based on the scRNA-seq defined cell ontology, and can be visualized on the same embedding. (d-f) Coverage plots showing chromatin accessibility at selected loci, after grouping query cells by their predicted annotations. In each case, the predicted cell labels agree with the expected accessibility patterns. (g) We constructed a differentiation trajectory and pseudotime ordering of cells undergoing myeloid differentiation. The pseudotime ordering encompasses both scRNA-seq and scATAC-seq cells. (h) Example locus where we observe a ‘lag’ between the gene expression dynamics for MPO and the accessibility dynamics for an upstream regulatory region (denoted by a yellow box in (i)). (i) chromatin accessibility at the MPO regulatory locus. The highlighted region becomes accessible at the multipotent LMPP stage. (j) MPO becomes highly expressed at the RNA level at the myeloid-committed GMP stage. (k) KEGG pathway enrichment for 236 genes where we identified a lag between accessibility and transcriptional dynamics. (l) Smoothed chromatin accessibility levels (red) and lagging expression of associated genes (blue) as a function of pseudotime, for 6 cell cycle-associated genes.
Figure 3.
Figure 3.. Robustness and benchmarking analysis for bridge integration
(a) Per cell-type prediction concordance of bridge integration, based on the number of cells representing each cell type in the multi-omic dataset. Concordance results were obtained by serially downsampling the multi-omic dataset, repeating bridge integration, and comparing resulting query annotations with those derived from the full dataset. Boxplots represent the observed range of values across 21 cell types. (b) Coverage plots for the SIGLEC6 locus, after performing cross-modality annotation with bridge integration, multiVI, and Cobolt. Only cells called as ASDC by bridge integration exhibit celltype-specific accessibility at this locus. Additional loci shown in Supplementary Fig. 2e,f. (c) Ground truth benchmarking analysis. RNA and ATAC profiles from a 10x multiome dataset were unpaired and integrated. Barplots show the average Jaccard similarity between each scATAC-seq cell and its matched scRNA-seq cell. Results are split by individual cell types in Supplementary Fig. 3. Results are also shown for Paired-Tag datasets for three histone modification profiles. In each case, bridge integration achieves the highest Jaccard similarity. (d) scRNA-seq reference of the human motor cortex. (e,f) Mapping of single cell DNA methylation profiles of human cortical cells onto the reference using a snmC2T-seq multi-omic dataset as a bridge. Cells are colored by the methylation-derived annotations from the original study (e), or the scRNA-seq derived labels from bridge integration (f). Reference-derived labels at higher levels of granularity are shown in Supplementary Fig. 3.
Figure 4.
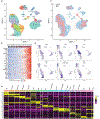
Figure 4.. Utilizing dictionary learning for massively scalable integration
(a) Schematic of atomic sketch integration procedure. After selecting a representative set of cells from each dataset, these cells are integrated and used to reconstruct harmonized profiles for all cells. Matrix notation is consistent with the full mathematical description in Supplementary Methods. (b, c) UMAP visualization of 1,525,710 scRNA-seq profiles spanning 19 studies from the lung and upper airways, which were harmonized using atomic sketch integration in 55 minutes. Cells are colored by their study of origin (b) or annotated cell type after integration (c). (d) Expression of FOXI1, a transcriptional marker of pulmonary ionocytes, in the integrated dataset. (e) Heatmap showing the top transcriptional markers of pulmonary ionocytes that are consistent across multiple studies. Pulmonary neuroendocrine cells (PNEC), the most transcriptionally similar cell type, are shown for contrast. Each column represents a pseudobulk average of all cells from a single cell type and single study. Top transcriptional markers for all cell types are shown in Supplementary Fig. 3. (f) GO ontology enrichment terms for ionocyte markers. (g) Expression distributions of top transcriptional markers recovered from single-cell differential expression analysis (red), or pseudobulk analysis (blue).
Figure 5.
Figure 5.. ‘Community-scale’ integration of sequencing and cytometry immune datasets
(a) UMAP visualization of 3,461,171 human PBMC scRNA-seq profiles spanning 14 studies and 639 individuals after performing atomic sketch integration. (b) Expression of a COVID-19 response module in CD14 monocytes. Each column represents a pseudobulk average of CD14 monocytes from one of 506 individuals. Expression of the module is correlated with disease severity within the individual, which is indicated by the color scale above the heatmap. Responses for additional cell states are shown in Supplementary Fig. 5b. c) Mapping of 5,170,249 additional CyTOF profiles spanning 119 individuals, using a published CITE-seq dataset (Hao et al, 2021) as a multi-omic bridge. Each CyTOF profile is annotated with one of the scRNA-seq defined cell types. (d) Cross-modality integration enables the exploration of cell surface and intracellular protein markers on cell landscapes defined by scRNA-seq. As an example, intracellular FOXP3 levels are highly enriched in annotated Treg cells, validating the accuracy of our mapping. 200,000 cells are shown in each visualization to alleviate overplotting. (e) Heatmap showing the expression of 34 protein markers in the CyTOF dataset. Each column represents a pseudobulk average, after grouping cells by individual and reference-derived annotation.

Comment in

  • Bridging the multi-omics gap.
    Attwaters M. Attwaters M. Nat Rev Genet. 2023 Aug;24(8):488. doi: 10.1038/s41576-023-00632-7. Nat Rev Genet. 2023. PMID: 37340169 No abstract available.

References

    1. Kent WJ BLAT—the BLAST-like alignment tool. Genome research 12, 656–664 (2002). - PMC - PubMed
    1. Langmead B, Trapnell C, Pop M & Salzberg SL Ultrafast and memory-efficient alignment of short DNA sequences to the human genome. Genome Biol 10, R25 (2009). - PMC - PubMed
    1. Li H & Durbin R Fast and accurate short read alignment with Burrows-Wheeler transform. Bioinformatics 25, 1754–1760 (2009). - PMC - PubMed
    1. Hao Y. et al. Integrated analysis of multimodal single-cell data. Cell (2021). - PMC - PubMed
    1. Kang JB et al. Efficient and precise single-cell reference atlas mapping with Symphony. Nat Commun 12, 5890 (2021). - PMC - PubMed