. 2023 May 26;42(1):134.
doi: 10.1186/s13046-023-02713-1.

Therapeutic targeting of P2X4 receptor and mitochondrial metabolism in clear cell renal carcinoma models

Affiliations

Therapeutic targeting of P2X4 receptor and mitochondrial metabolism in clear cell renal carcinoma models

Christofer Rupert et al. J Exp Clin Cancer Res. .

Abstract

Background: Clear cell renal cell carcinoma (ccRCC) is the most common subtype of renal cancer. Large-scale metabolomic data have associated metabolic alterations with the pathogenesis and progression of renal carcinoma and have correlated mitochondrial activity with poor survival in a subset of patients. The aim of this study was to determine whether targeting mitochondria-lysosome interaction could be a novel therapeutic approach using patient-derived organoids as avatar for drug response.

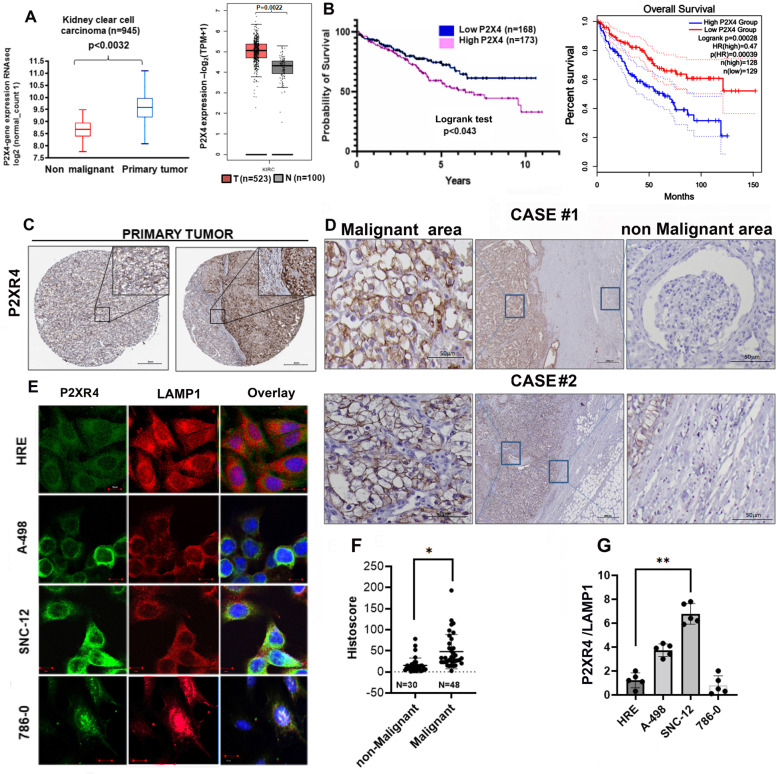
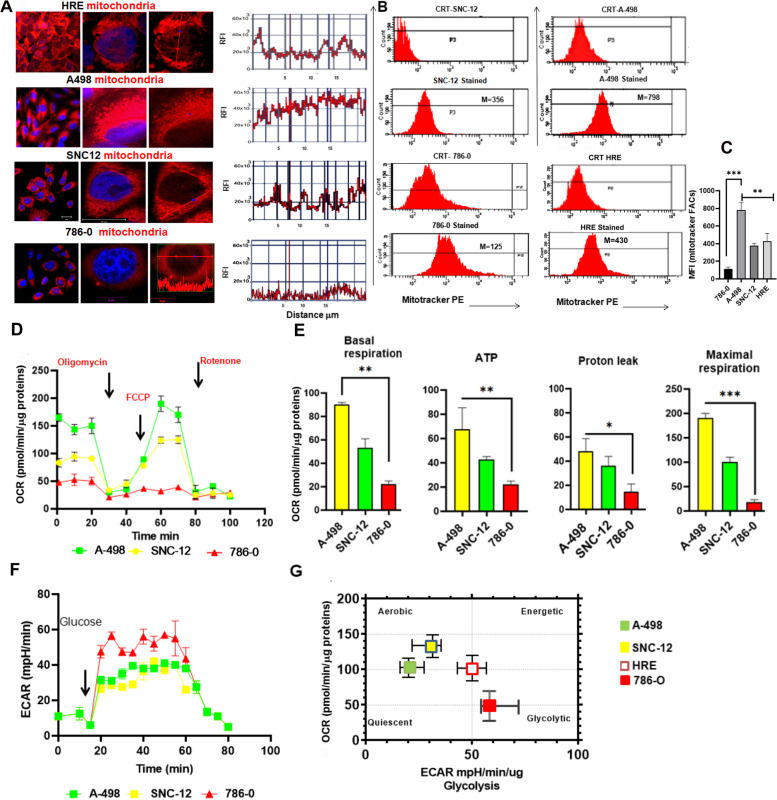
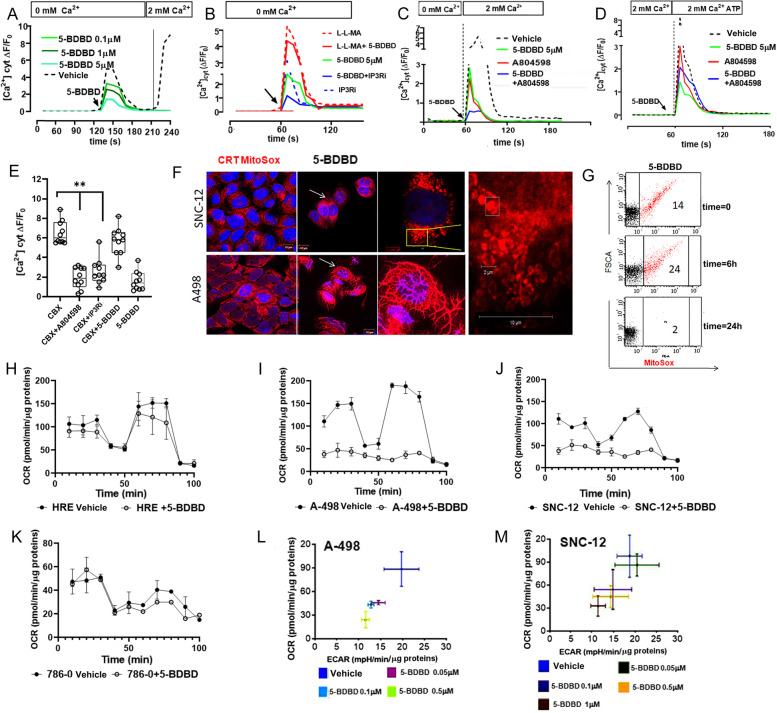
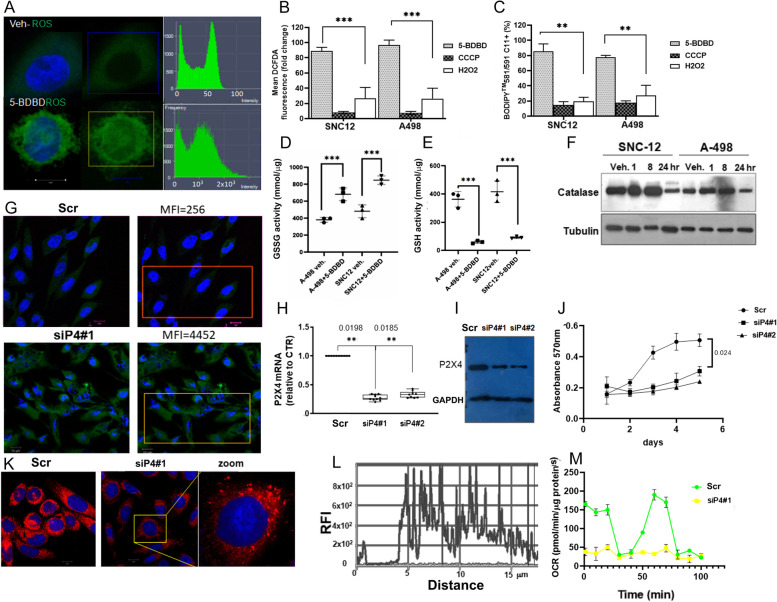
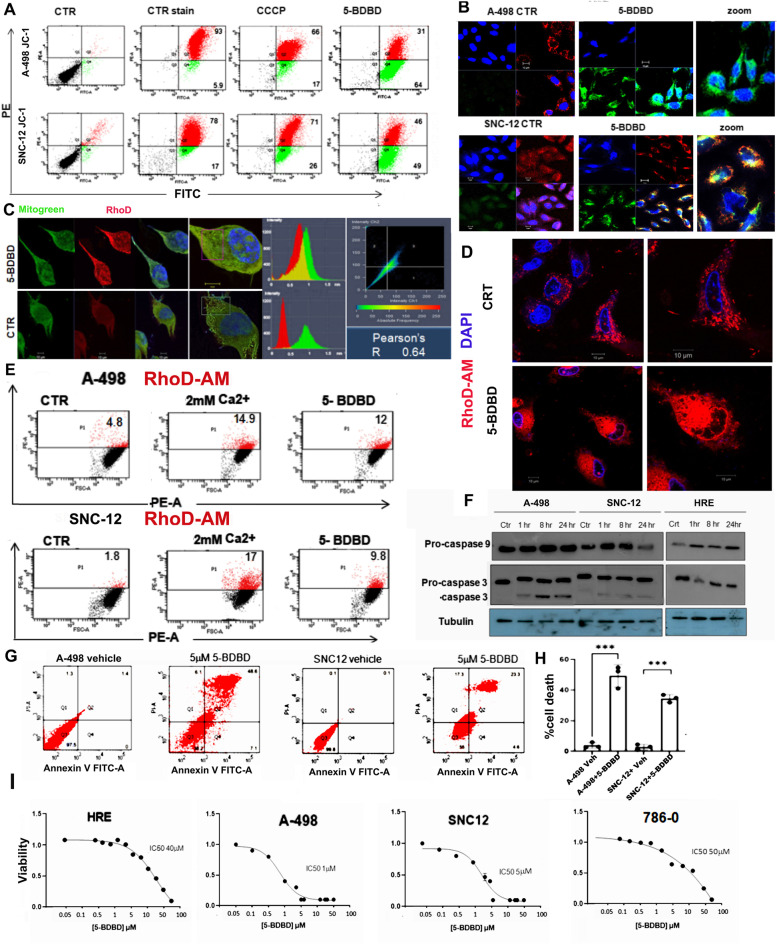
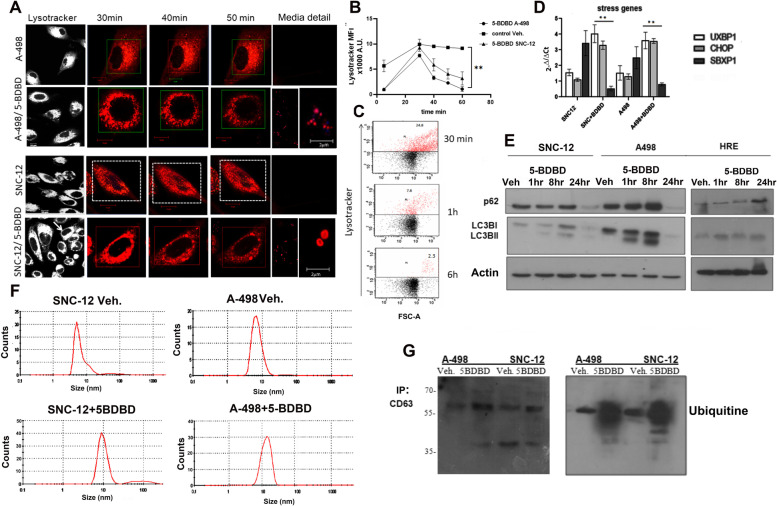
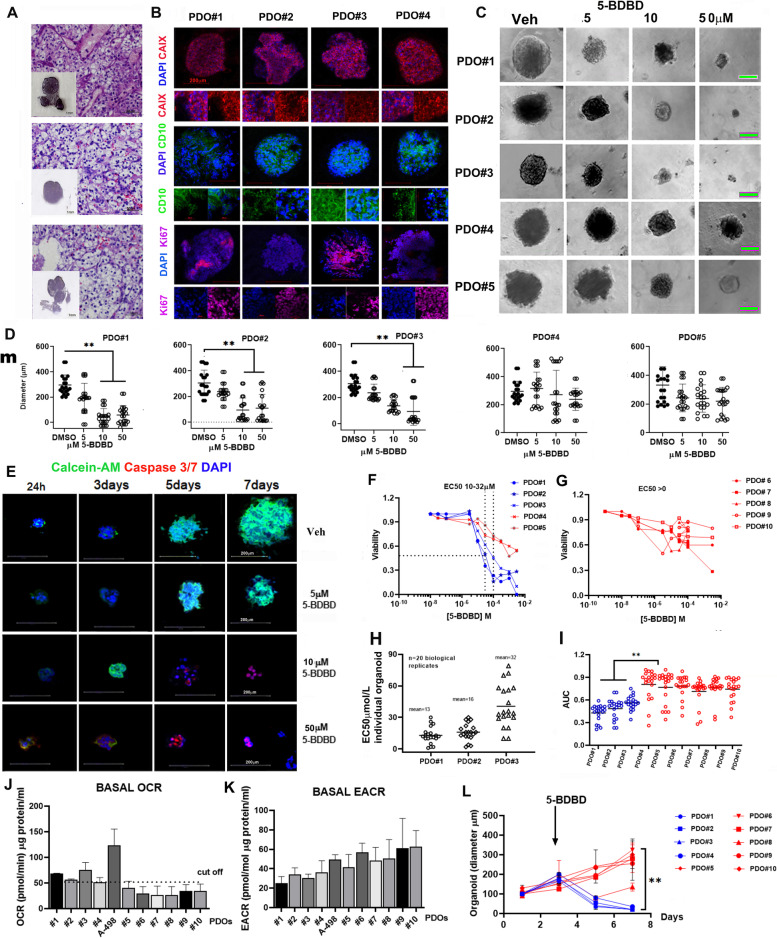
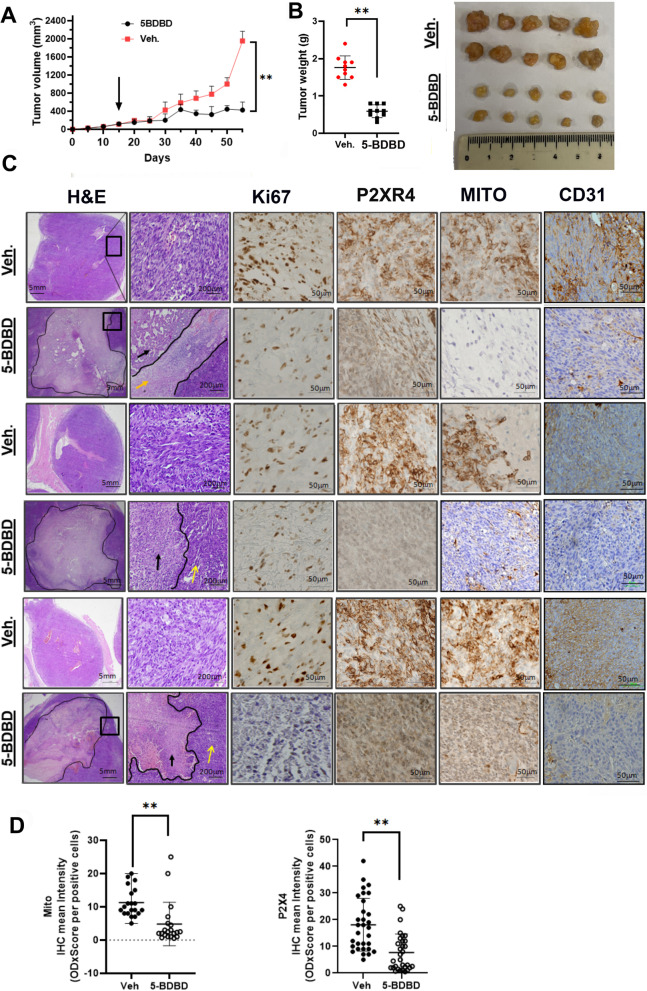
Methods: RNAseq data analysis and immunohistochemistry were used to show overexpression of Purinergic receptor 4 (P2XR4) in clear cell carcinomas. Seahorse experiments, immunofluorescence and fluorescence cell sorting were used to demonstrate that P2XR4 regulates mitochondrial activity and the balance of radical oxygen species. Pharmacological inhibitors and genetic silencing promoted lysosomal damage, calcium overload in mitochondria and cell death via both necrosis and apoptosis. Finally, we established patient-derived organoids and murine xenograft models to investigate the antitumor effect of P2XR4 inhibition using imaging drug screening, viability assay and immunohistochemistry.

Results: Our data suggest that oxo-phosphorylation is the main source of tumor-derived ATP in a subset of ccRCC cells expressing P2XR4, which exerts a critical impact on tumor energy metabolism and mitochondrial activity. Prolonged mitochondrial failure induced by pharmacological inhibition or P2XR4 silencing was associated with increased oxygen radical species, changes in mitochondrial permeability (i.e., opening of the transition pore complex, dissipation of membrane potential, and calcium overload). Interestingly, higher mitochondrial activity in patient derived organoids was associated with greater sensitivity to P2XR4 inhibition and tumor reduction in a xenograft model.

Conclusion: Overall, our results suggest that the perturbed balance between lysosomal integrity and mitochondrial activity induced by P2XR4 inhibition may represent a new therapeutic strategy for a subset of patients with renal carcinoma and that individualized organoids may be help to predict drug efficacy.

Keywords: Drug screening; Lysosomes; Mitochondria; Organoids; Purinergic receptors; Renal carcinoma.


Conflict of interest statement

None.

Figures

Fig. 1
Fig. 1
P2X4 gene and protein overexpression in clear cell renal carcinoma correlates with poor patient prognosis. A Left: P2X4 RNAseq analysis in clear cells renal carcinoma primary tumors (KIRC) cohort from the Cancer Genome ATLAS (TCGA) n = 945 with Xena browser, compared to adjacent non-tumoral tissues. Right: P2X4 RNAseq in KIRC cohort from the Cancer Genome ATLAS, (n = 523) analyzed with GEPIA browser compared to non-tumoral tissues (n = 100). B Left: Kaplan–Meier estimates overall survival in KIRC patient cohort (grade I-III) with high and low P2X4 mRNA expression (logrank test p < 0.043). Right: Kaplan–Meier estimates overall survival among a cohort of 258 tumor grade (I-III) expressing high and low P2X4 mRNA level (logrank test, p < 0.00028). C Expression of P2XR4 protein assessed by immunohistochemistry in the human protein ATLAS database. Right: Representative image of clear cells renal carcinoma grade I showing moderate staining for P2XR4 antibody. Left: Strongly stained clear cell renal carcinoma grade I; Scale bar = 200 μm, insert is higher magnification, scale bar = 50 μm. D Representative images showing P2XR4 staining of clear cell renal carcinoma tissues stage III from two of our clinical cases. Middle: low magnification image (Scale bars = 200 µm) showing areas of tumor and non-malignant tissues; on both sides the higher magnifications (scale bars = 50 µm). E Immunofluorescence of P2XR4 (green), LAMP1 (red), and nuclei DAPI (blue) in normal renal epithelial cells (HRE) and clear cell carcinoma cell lines (A-498, SNC-12, and 786–0) (Scale bars = 20 μm). F Histoscores scatterplot for P2XR4 protein in non-malignant (n = 30) and malignant KIRC patients’ (n = 48 using QuPath). Statistical significance was determined by unpaired two-tailed t-test; *p ≤ 0.05. G, Bar graph showing relative immunofluorescence intensity of P2XR4 protein in individual cell lines stained with fluorescence-labeled antibodies. At least 20 cells for each cell lines by unpaired two-tailed t-test; **p ≤ 0.01
Fig. 2
Fig. 2
Mitochondrial mass and activity in tumor cells. A Left: MitoTracker Red staining of normal human renal epithelial cells (HRE) or A-498, SNC-12 and 786–0 clear cell carcinoma cells (Scale bars = 10 μm). Right: Relative fluorescence intensity (RFI) of MitoTracker in single cell along the diameter. B Representative FACS profile of mitochondrial mass labeled with MitoTracker in SNC-12, 786–0 and A-498 cells, reported as median of fluorescence intensity (MFI). CRT indicates the unstained control of each cell line. C Graphical representation of mean fluorescence intensity (MFI) measured by FACS. D Oxygen consuming rate (OCR) by mitochondrial stress test (MST using Seahorse system) in A-498, SNC-12 and 786–0 cells plated in 12 × multiwell plates at 1 × 10.5 cells/well. Data are reported per µg of protein under basal conditions and in response to mitochondrial inhibitors (oligomycin; FCCP; rotenone). E Quantification of basal respiration, ATP production, proton leak and maximal respiration in tumor cells. Basal respiration is the value just before oligomycin injection, minimal respiration is the lowest value after oligomycin injection, and maximal respiration is the highest value after FCCP injection. All values were calculated after subtraction of non-mitochondrial respiration. F Extracellular acidification rate (ECAR) reported as milli pH per minute (mpH/min) under basal conditions in A-498, SNC-12 and 786–0 cells over the time. G ECAR in milli pH per minute (mpH/min)/ µg under basal conditions over the time vs. OCR under conditions of basal respiration in A-498, SNC-12, 786–0 and HRE cells. Abbreviations: Oligo, oligomycin; FCCP, carbonyl cyanide-p-trifluoromethoxyphenyl hydrazone; Rotenone. Data are mean ± SEM. of three independent experiments in triplicated. P-values were calculated by Mann–Whitney U or Student's t-tests. **p < 0.01
Fig. 3
Fig. 3
P2XR4 receptor regulates intracellular calcium. Cytosol Ca2+ dosage in live A-498 cells traced by Fura-2 AM over the time. A Baseline reading in Ca2+ free conditions were established for 2 min, then cells were recorded for additional 2 min without or with P2XR4 inhibitor (5-BDBD at different concentration green lines). B Intracellular calcium response to 5-BDBD, or inositol 3 phosphate receptor inhibitor (IP3Ri), or lysomotropic inhibitor (L-L-MA) of A-498 cells incubated in Ca2+-free medium. C Intracellular calcium levels in cells stimulated with 2 mM Ca2+-containing medium in presence of either a P2XR7 inhibitor (A804598) or 5-BDBD or combination of both. D Intracellular calcium levels in cells stimulated with 3 mM ATP and 2 mM Ca2+-containing medium in presence of either a P2XR7 inhibitor (A804598) or 5-BDBD or both. E Box plot of intracellular calcium in A-498 cells following inhibition of mitochondria (CBX), P2XR7 (A804598), P2XR4 (5-BDBD), or IP3Ri, as indicated. Data are reported as ratio between F and F0 (340/380 nm fluorescence of Fura 2-AM) recorded in controls, n = 51 cells, A804598, n = 50 cells, 5-BDBD n = 39 cells and IP3Ri inhibitor n = 45 during the 2 min of stimulation. P-values were calculated by Mann–Whitney U **p < 0.01. F Pharmacological blockage of P2XR4 results in mitochondrial morphology change. Representative confocal image of SNC-12 and A498 cells mitochondria stained with MitoSox (red) and DAPI for nuclei (blue). After treatment with 5-BDBD for 10 min the mitochondria appeared fused in filaments in A-498 cells or with large cristae in SNC-12 cells. Scale bars = 10 µm. G Representative flow cytometry analysis of mitochondria stained with MitoSox (red) from A-498 cells after different time of 5 µM 5-BDBD treatment, as indicated. The percentage of positive cells is reported in each quadrant. H Oxygen consumption rate (OCR) with the Mito Stress Test kit in HRE cells incubated with or without 5 µM 5-BDBD over the time. I and J OCR measurements in A-498 and SNC-12 cells with or without 5 µM 5-BDBD. K OCR in 786–0 cells with or without 5 µM 5-BDBD. L and M OCR vs extracellular acidification rate (ECAR) in A498 and SNC-12 cells treated with 5-BDBD at different concentrations, as indicated. Data represent mean ± SD of three independent experiments performed in triplicate
Fig. 4
Fig. 4
P2XR4 activity protects from ROS. A Left: Representative confocal image showing ROS production (DCFDA fluorescence) in a single cell assay. TOP A-498 cell control treated with vehicle (DMSO) or exposed for 15 min to 5-BDBD (bottom). Right: cells stained with DCFHDA green were boxed and fluorescence quantified were Graphical represented as relative fluorescence intensity of ROS in the square area. B Graphical representation of mean DCFDA fluorescence intensity (recorded as λEx/Em = 495/529 nm) reported as fold change over control vehicle in SNC-12 and A-498 cells, treated for 10 min with 0.5 μM 5-BDBD or positive control (500 μM H2O2) or negative controls (10 μM CCCP, protonophore m-chlorophenylhydrazone). C C11-BODIPY581/591 was used to index lipid peroxidation. SNC-12 or A-498 cells were incubated with 2.5 µM C11-BODIPY.581/591 for 15 min after exposure to 5-BDBD (0.5 μM), H2O2 (500 μM), and negative control 10 μM CCCP (protonophore m-chlorophenylhydrazone) for 10 min. Data are reported as fold change to vehicle treated cells. D, E GSSG and GSH colorimetric assay in A-498 and SNC-12 cells treated for 15 min with vehicle or with 5-BDBD. Data are reported as millimol of GSH or GSSG / µg of protein extracts. F Western blot of protein extracts from A-498 and SNC-12 cells collected at different time points from 5-BDBD treatment stained with Catalase antibody. Tubulin was used as loading control. G Representative confocal images showing ROS production (DCFDA fluorescence) in scramble transfected control A-498 cells (Scr) or in silenced P2X4 clone (siP4#1). The mean relative fluorescence intensity measured (MFI) in the squared area is indicated. H qRT-PCR dosage of P2X4 mRNA in scramble control A-498 cells (Scr) and in two different silenced clones, siP4#1 and siP4#2. I Western Blot analysis of proteins from scramble control A-498 cells (Scr) and in two silenced clones siP4#1 and siP4#2 with P2XR4 antibodies and GAPDH as loading control. J Cell proliferation assay in A-498 scramble transfected cells (Scr), and in siPX4 clones 1 and 2 assessed by MTT at different days of cultures (n = 3) reported as OD at 570 nm. K MitoTracker Red staining for mitochondria in scramble transfected A-498 cells (Scr) and siP4#1 clone (scale bar = 10 μm). L Relative fluorescence intensity for MitoTracker Red along the diameter of a siP4#1 single cell. M Oxygen consumption rate (OCR) measurements in scramble transfected A-498, (Scr) and in siP4#1 clone with the Mito Stress Test. Data B, C, D, E, H and J M represent as mean ± SD of three independent experiments performed in triplicate. Student’s t-test ** p < 0.01.***p < 0.001
Fig. 5
Fig. 5
P2XR4 protects mitochondrial membrane from oxidation and calcium overload. A Determination of mitochondrial membrane potential (ΔΨm) in A-498 (top) and SNC-12 cells (bottom) with JC-1 staining, using fluorescence cell sorting. The cells were treated for 15 min with CCCP (positive control), 5-BDBD, or vehicle. The high mitochondrial membrane potential (ΔΨm), in red corresponds to dimers of JC-1, and the low ΔΨm in green corresponds to the JC-1 monomer. Percentages of red and green potentials (ΔΨm) are indicated in each quadrant. B Representative images of A-498 and SNC-12 cells incubated with or without 5-BDBD for 15 min and stained with JC-1. Red staining indicates high mitochondrial membrane potential and green staining indicates low potential (ΔΨm). Scale bar = 10 µm. C Representative image of a single cell assay of A-498 cells treated with 5-BDBD for 15 min (upper panel) or vehicle- (lower panel) stained with MitoTracker green and Rhodamine-AM red as indicators of mitochondrial calcium accumulation. Correlation between green and red fluorescence intensity in single cell assay with Pearson test; R = 0.64 (scale bar 10 µm). D Representative confocal image of Rhodamine-AM (red) stained mitochondrial calcium in A-498 cells treated for 15 min with vehicle (control) or 5-BDBD (scale bar 10 µm). E Flow cytometry quantification of mitochondrial calcium accumulation by Rhodamine-2AM (red) in vehicle control, A-498, and SNC-12 cells, or cells exposed to 2 mM Ca2+ with or without 5-BDBD. The percentage of Rhodamine-2 AM positive mitochondria (red) is indicated in the corresponding quadrant. F Western blot analysis of pro-Caspase 9 and 3 in protein extracts from A-498, SNC-12, and control HRE cells treated with 5-BDBD for different times. G Early and late apoptosis in A-498 and SNC-12 cells treated with 5-BDBD or vehicle for 24 h stained with FICT-Annexin V and PI and analyzed by flow cytometry. H Quantification of early and late apoptotic cells. Data are mean ± SD. of three independent experiments performed in triplicates ***p < 0.001. Statistical analysis was performed using one-way ANOVA followed by Turkey’s post-hoc test. I Dose response curve and IC50 for 5-BDBD determined by MTT assay reported as vitality / control, A-498, SNC-12, HRE; and 786–0 cells. Data are presented as the mean ± SD of three independent experiments performed in triplicates
Fig. 6
Fig. 6
Blocking P2XR4 activity induces lysosomal membrane damage. A Time-laps confocal microscopy live images of A-498 and SNC-12 cells stained for lysosomes with lysotracker (red). Images were taken after different time of exposure to 5-BDBD, as indicated. Scale bars = 10 µm. B Graphical representation of mean ± SE of lysotracker (red) fluorescent intensity of n = 25–30 cells per sample over time in three independent experiments ± SD ** p < 0.01. C Flow cytometry quantification of lysotracker stained A-498 cells after different time of 5-BDBD treatment. D RT/PCR quantification of mRNAs of stress genes CHOP, UBXP1, and SPBX1 in SNC-12 and A-498 cells incubated without or with 5-BDBD for 1 h. Data are reported with 2-delta/delta ct method ± SD of three independent experiments; ** p < 0.01. E Representative Western blot of protein extracts from SNC-12, A-498 and HRE cells treated or not with 5-BDBD for different times and analyzed with LC3BI/II and p62 antibodies, as indicated. Western blot bands were normalized with actin. F Zetasizer nano analysis of nanobody selected with CD63 antibody from SNC-12 and A-498 cell culture media after treatment with vehicle or 5-BDBD. G Western blot of extracellular CD63 + nanobody prepared from cultured media of A-498 and SNC-12 cells treated with 5-BDBD and control vehicle (0.1% DMSO) immunoprecipitated with CD63 antibody (left) and Western blot analyzed with poli-Ub antibody (right)
Fig. 7
Fig. 7
P2XR4 expression and mitochondrial respiration in ccRCC organoids. A Representative hematoxylin–eosin (H&E) staining of different clear cell carcinomas PDOs sections together with the bright-field microscopy images of corresponding PDOs (inset). Scale bars = 50 μm (section) and inset scale bar = 1 mm. B Representative immunofluorescence images of PDOs stained with typical markers of clear cell renal cancers, e.g., CD10 (green) and carbonic anhydrase 9 (red) Ki67 (pink). Nuclei were stained with 4′,6-diamidino-2-phenylindole (DAPI) (blue). Scale bars = 100 μm or 20 μm. C Phase contrast images of organoids from different patients treated with different doses of 5-BDBD as indicated, or vehicle for 4 days, Scale bars = 100 μm. D Quantification of PDOs diameters from different patients (PDOs 1–5) treated for 4 days with the indicated dose of 5-BDBD. Data are reported as mean of 20 replicates ± SD determined by two-tailed Mann–Whitney test. **p < 0.01. E Immunofluorescence of PDOs incubated with DMSO or 5 μM, 10 μM or 50 μM 5-BDBD for different days. Nuclei are indicated by DAPI staining (blue), live cells by calcein-AM (green), and dead cells by Caspase 3/7 (red). Scale bars = 200 μm. F and G Dose response curve in PDOs from patients 1 to 10 treated for 4 days with different doses of 5-BDBD as indicated. Data are reported the means of 20 biological replicates for each dose. H IC50 (micromol/L) of individual organoids (n = 20) from different patients. Data reported are the mean of 20 biological replicates. I Area under the curve (AUC) of individual organoids from different patients. The means of twenty replicates is indicated. Significance was calculated by two-way ANOVA **p < 0.001. J Oxygen consumption rate (OCR) in PDOs 1–10 or parental A-498 cells measured by Seahorse XF96 analyzer. Data are representative of 4 biological replicates. The selected cut-off of OCR is indicated by line. K Basal extracellular acidification rate (ECAR) in PDOs and parental A-498 cells. Data are representative of 4 biological replicates. L PDOs diameters after different time of treatment with 5-BDBD. Red lines represent PDOs with high mitochondrial activity, blue lines are PDOs with low mitochondrial activity. Data are reported as mean of 20 replicates and ± SD. Significance was determined by unpaired Student’s t-test. **, p < 0.01
Fig. 8
Fig. 8
Anti-tumor effect of P2X4R inhibition in a xenograft model of ccRCC. A Effect of 5-BDBD treatment and vehicle control on tumor volume (growth) in mice (n = 5 per group). B Effect of 5-BDBD on tumor weight at the end of the experiment, i.e., after 40 days of treatment. C Representative images of tumor section from 5-BDBD and vehicle (Veh.) treated mice stained with H&E or antibodies to Ki67, P2XR4, mitochondria and CD31. Scale bars = 5 mm and 50 μm. Black line indicate necrotic area, yellow arrows inflammatory area. D Quantitative histoscore using QuPath of P2XR4 and mitochondria immunostaining in tumor sections of all mice (n = 5). **, p < 0.01 of for slides for each mice

References

    1. Choueiri TK, Albiges L, Atkins MB, Bakouny Z, Bratslavsky G, Braun DA, et al. From basic science to clinical translation in kidney cancer: a report from the second kidney cancer research summit. Clin Cancer Res. 2022;28:831–839. doi: 10.1158/1078-0432.CCR-21-3238. - DOI - PMC - PubMed
    1. Choueiri TK, Motzer RJ. Systemic therapy for metastatic renal-cell carcinoma. N Engl J Med. 2017;376:354–366. doi: 10.1056/NEJMra1601333. - DOI - PubMed
    1. Weiss RH. Metabolomics and metabolic reprogramming in kidney cancer. Semin Nephrol. 2018;38:175–182. doi: 10.1016/j.semnephrol.2018.01.006. - DOI - PMC - PubMed
    1. Wettersten HI, Hakimi AA, Morin D, Bianchi C, Johnstone ME, Donohoe DR, et al. Grade-dependent metabolic reprogramming in kidney cancer revealed by combined proteomics and metabolomics analysis. Cancer Res. 2015;75:2541–2552. doi: 10.1158/0008-5472.CAN-14-1703. - DOI - PMC - PubMed
    1. Choueiri TK, Powles T, Burotto M, Escudier B, Bourlon MT, Zurawski B, et al. CheckMate ER Investigators nivolumab plus cabozantinib versus sunitinib for advanced renal-cell carcinoma. N Engl J Med. 2021;384:829–841. doi: 10.1056/NEJMoa2026982. - DOI - PMC - PubMed