. 2023 May 25;42(1):133.
doi: 10.1186/s13046-023-02716-y.

Integrated proteogenomic characterization reveals an imbalanced hepatocellular carcinoma microenvironment after incomplete radiofrequency ablation

Affiliations

Integrated proteogenomic characterization reveals an imbalanced hepatocellular carcinoma microenvironment after incomplete radiofrequency ablation

Zheng-Rong Shi et al. J Exp Clin Cancer Res. .

Abstract

Background: Efforts to precisely assess tumor-specific T-cell immune responses still face major challenges, and the potential molecular mechanisms mediating hepatocellular carcinoma (HCC) microenvironment imbalance after incomplete radiofrequency ablation (iRFA) are unclear. This study aimed to provide further insight into the integrated transcriptomic and proteogenomic landscape and identify a new target involved in HCC progression following iRFA.

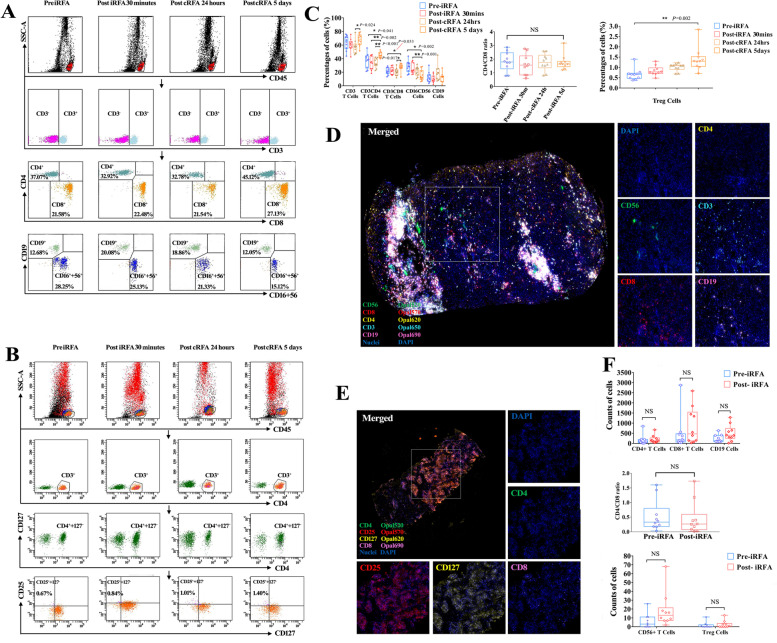
Methods: Peripheral blood and matched tissue samples were collected from 10 RFA-treated HCC patients. Multiplex immunostaining and flow cytometry were used to assess local and systemic immune responses. Differentially expressed genes (DEGs) and differentially expressed proteins (DEPs) were explored via transcriptomic and proteogenomic analyses. Proteinase-3 (PRTN3) was identified in these analyses. And then, the ability of PRTN3 to predict overall survival (OS) was assessed in 70 HCC patients with early recurrence after RFA. In vitro CCK-8, wound healing and transwell assays were conducted to observe interactions between Kupffer cells (KCs) and HCC cells induced by PRTN3. The protein levels of multiple oncogenic factors and signaling pathway components were detected by western blotting. A xenograft mouse model was built to observe the tumorigenic effect of PRTN3 overexpression on HCC.

Results: Multiplex immunostaining revealed no immediate significant change in local immune cell counts in periablational tumor tissues after 30 min of iRFA. Flow cytometry showed significantly increased levels of CD4+ T cells, CD4+CD8+ T cells, and CD4+CD25+CD127- Tregs and significantly decreased the levels of CD16+CD56+ natural killer cells on day 5 after cRFA (p < 0.05). Transcriptomics and proteomics revealed 389 DEGs and 20 DEPs. Pathway analysis showed that the DEP-DEGs were mainly enriched in the immunoinflammatory response, cancer progression and metabolic processes. Among the DEP-DEGs, PRTN3 was persistently upregulated and closely associated with the OS of patients with early recurrent HCC following RFA. PRTN3 expressed in KCs may affect the migration and invasion of heat stress-treated HCC cells. PRTN3 promotes tumor growth via multiple oncogenic factors and the PI3K/AKT and P38/ERK signaling pathways.

Conclusions: This study provides a comprehensive overview of the immune response and transcriptomic and proteogenomic landscapes of the HCC milieu induced by iRFA, revealing that PRTN3 promotes HCC progression after iRFA.

Trial registration: ChiCTR2200055606, http://www.chictr.org.cn/showproj.aspx?proj=32588 .

Keywords: Immune response; Liver cancer; Omics analysis; Proteinase 3; Thermal ablation.


Conflict of interest statement

There are no potential conflicts of interest.

Figures

Fig. 1
Fig. 1
Comprehensive exploration of the immune response, transcriptomics and proteomics landscapes in HCC patients after iRFA. A Scheme of experiments conducted on each sample from 102 HCCs. B The flow chart of patient selection. C The baseline characteristics of 10 HCC patients
Fig. 2
Fig. 2
Immune response of HCC patients after RFA. A Representative flow cytometric plots showing the percentages of CD4+, CD8+, CD19+, and CD16+ + CD56+ cells before RFA, 30 min after iRFA, and 24 h and 5 days after cRFA. B Representative flow cytometric plots showing the percentages of CD4+ + CD25+ + CD127 Treg cells before RFA, 30 min after iRFA, and 24 h and 5 days after cRFA. C Quantitative assessment of flow cytometric results. D Representative images of multiplex staining of CD4+, CD8+, CD19+, CD16+ and CD56+ cells in HCC samples after iRFA. E Representative images of multiplex staining of CD4+, CD25+, and CD127+ cells in HCC samples after iRFA. F Quantitative assessment of the multiplex staining results
Fig. 3
Fig. 3
Transcriptomics and proteomics analysis. A Venn diagrams showing the overlap of detected genes in HCC tissues between pre-iRFA and post-iRFA. B and C Volcano plots and heatmaps showing the differentially expressed transcripts. D-H GO, KEGG, Reactome, DO and DisGeNet enrichment analysis of the top 30 transcriptomic datasets. I Heatmaps showing the DEPs. J Numbers of up- and downregulated DEPs. K Quantitative results for 6 downregulated DEPs. L Quantitative results for the top 9 downregulated DEPs
Fig. 4
Fig. 4
Enrichment analysis, altered subcellular localization and transcription factor analysis of DEPs. A-C GO, domain and KEGG enrichment analyses of the proteomics data. D Circus plot of enrichment analysis showing differences in proteomics profiles. Top 20 GO terms, pathways and domains in the outer track. The numbers and -log10 (p value) of DEPs in the second outer tracks: the length of each band represents the number of DEPs. The P value (smaller) corresponds to color intensity (redder). The third tracks show the ratio of DEPs. Blue and cyan represent the proportion of up- and downregulated proteins, respectively. The gridlines in the fourth tracks indicate the RichFactor values. E Subcellular localization of DEPs before iRFA and after iRFA. F: Protein number of the top 10 transcription factor families
Fig. 5
Fig. 5
Integrated transcriptomics and proteomics analyses. A Phylogenic tree showing PPI based on the top 50 up- and downregulated proteins in proteomics. The size of the circle represents the degree value of protein interaction. Blue and cyan represent the up- and downregulated proteins, respectively. B PPI diagram based on the top 100 up- and downregulated proteins in proteomics. C PPI diagram based all DEPs in transcriptomics. D Venn diagrams showing that only PRTN3 was upregulated in both transcriptomics and proteomics. E Integrated transcriptomics and proteomics analyses showing significantly different GO terms only in proteomics. F-I GO and KEGG enrichment analyses of integrated transcriptomics and proteomics analyses showing different GO terms and KEGG pathways, respectively
Fig. 6
Fig. 6
The role of predictive survival and tumorigenesis effects of PRTN3 in heat stress treated HCC. A Immunohistochemical analysis indicated that the expression of PRTN3 in HCC was increased after RFA. B-C Representative immunohistochemical images of PRTN3 expression in HCC tissues before the first RFA treatment (B) and before the second RFA treatment (C). D-E Kaplan‒Meier analysis showing the OS predictive abilities of PRTN3 before RFA treatment (D) and after RFA treatment (E) in patients with early recurrence of HCC. F Immunofluorescence staining of DAPI and CD68 in KCs. G-H Cell proliferation assay of Hep 3B and SMMC-7721 after heat stress treatments and cultured with KC-CM transfected by lentiviral vector for PRTN3-overexpression (PR3OE) or PRTN3-knockdown (PR3KD). I Wound-healing assay. J Cell migration and invasion assays by transwell. K Western blot analysis of protein expression levels of CXCL5, MPO, MMP9 and IL-6 in heat stress HCC cells as were affected by KC-CM after PR3OE or PR3KD. L Western blot analysis of protein expression of p-AKT, p-ERK1/2, p-P38 and PI3K in heat stress HCC cells affected by KC-CM after PR3OE or PR3KD. M Picture of xenograft tumors were shown in the PR3OE group and wild type group (n = 5). N: The growth curves of each group of xenograft tumors were displayed. O The xenograft mice models in vivo were analyzed by IVIS to identify the potential of PRTN3 in promoting tumor grow. All data are expressed as the mean ± SD of three independent experiments. **p < 0.01

References

    1. Llovet JM, Kelley RK, Villanueva A, Singal AG, Pikarsky E, Roayaie S, Lencioni R, Koike K, Zucman-Rossi J, Finn RS. Hepatocellular carcinoma. Nat Rev Dis Primers. 2021;7(1):6. doi: 10.1038/s41572-020-00240-3. - DOI - PubMed
    1. Villanueva A. Hepatocellular Carcinoma. N Engl J Med. 2019;380(15):1450–1462. doi: 10.1056/NEJMra1713263. - DOI - PubMed
    1. Liao R, Du CY, Gong JP, Luo F. HBV-DNA Load-Related Peritumoral Inflammation and ALBI Scores Predict HBV Associated Hepatocellular Carcinoma Prognosis after Curative Resection. J Oncol. 2018;2018:9289421. doi: 10.1155/2018/9289421. - DOI - PMC - PubMed
    1. Wen N, Cai Y, Li F, Ye H, Tang W, Song P, Cheng N. The clinical management of hepatocellular carcinoma worldwide: A concise review and comparison of current guidelines: 2022 update. Biosci Trends. 2022;16(1):20–30. - PubMed
    1. Su GL, Altayar O, O’Shea R, Shah R, Estfan B, Wenzell C, Sultan S, Falck-Ytter Y. AGA Clinical Practice Guideline on Systemic Therapy for Hepatocellular Carcinoma. Gastroenterology. 2022;162(3):920–34. - PubMed

Substances