. 2023;113(9):943-956.
doi: 10.1159/000530968. Epub 2023 May 12.

Molecular and Functional Heterogeneity of Primary Pancreatic Neuroendocrine Tumors and Metastases

Affiliations

Molecular and Functional Heterogeneity of Primary Pancreatic Neuroendocrine Tumors and Metastases

Yiying Guo et al. Neuroendocrinology. 2023.

Abstract

Introduction: Treatment response to the standard therapy is low for metastatic pancreatic neuroendocrine tumors (PanNETs) mainly due to the tumor heterogeneity. We investigated the heterogeneity between primary PanNETs and metastases to improve the precise treatment.

Methods: The genomic and transcriptomic data of PanNETs were retrieved from the Genomics, Evidence, Neoplasia, Information, Exchange (GENIE), and Gene Expression Omnibus (GEO) database, respectively. Potential prognostic effects of gene mutations enriched in metastases were investigated. Gene set enrichment analysis was performed to investigate the functional difference. Oncology Knowledge Base was interrogated for identifying the targetable gene alterations.

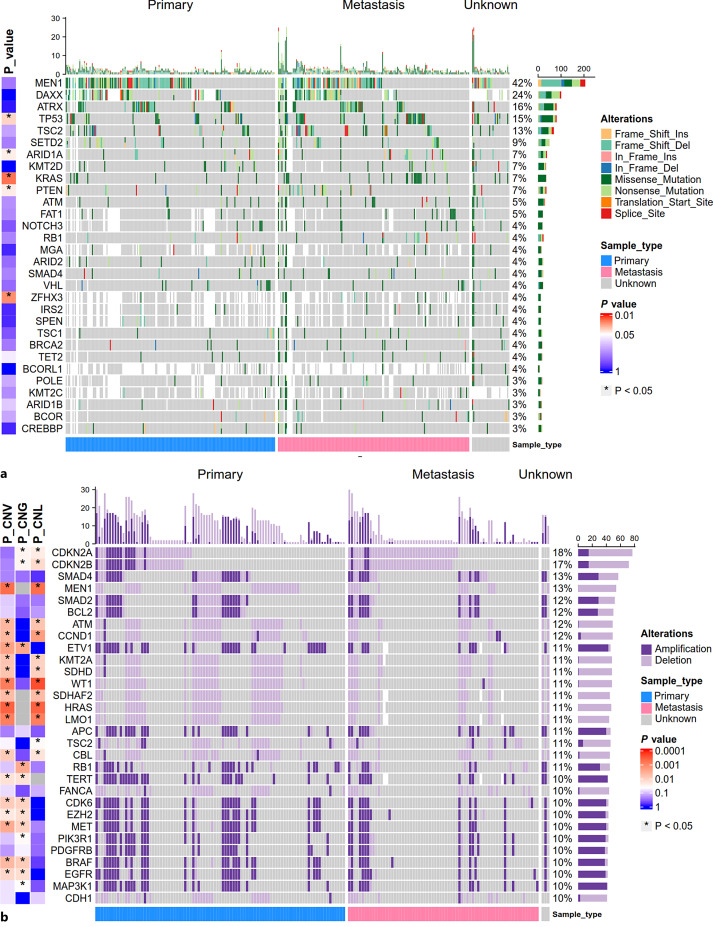
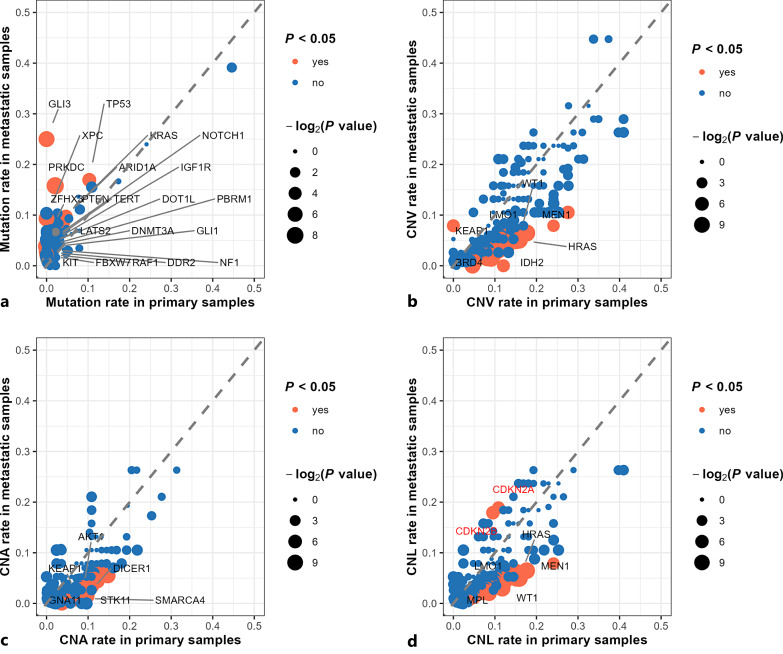
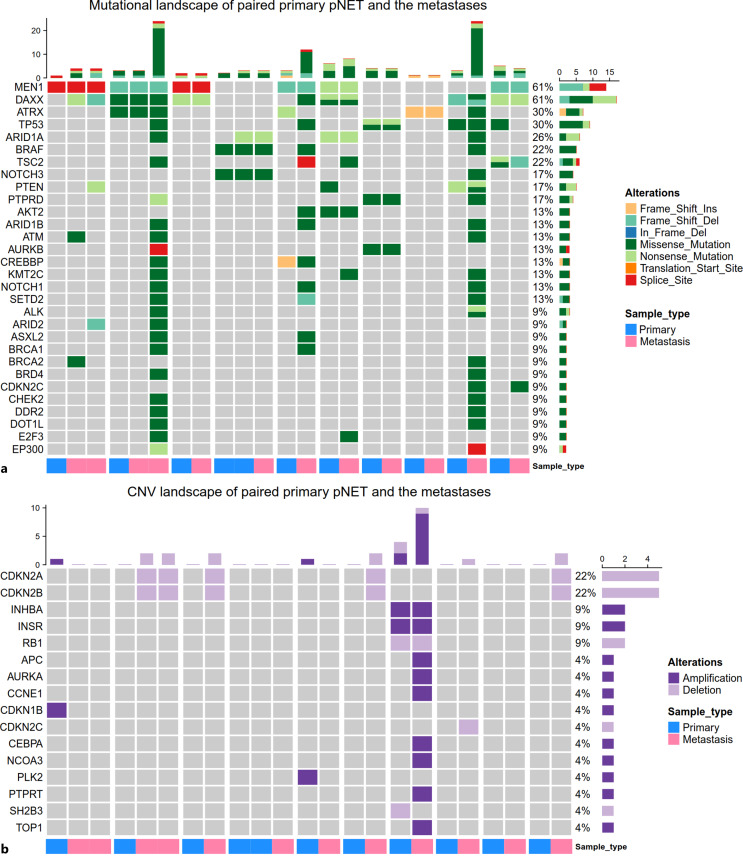
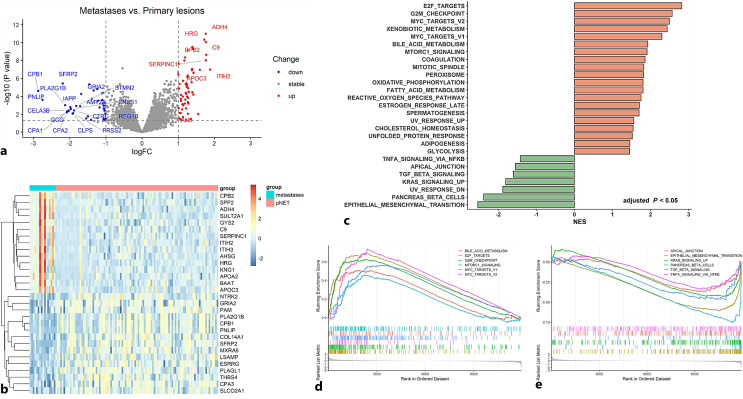
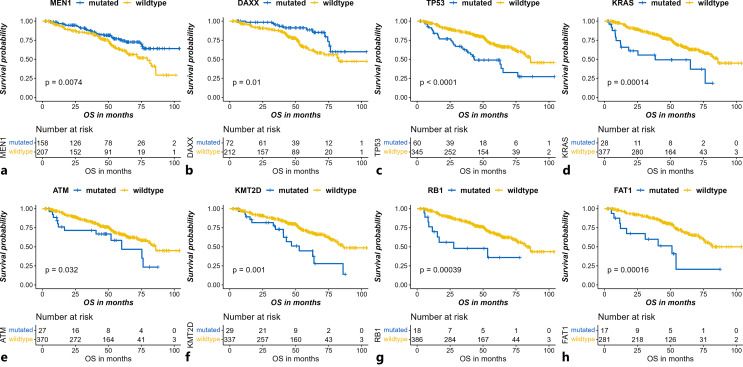
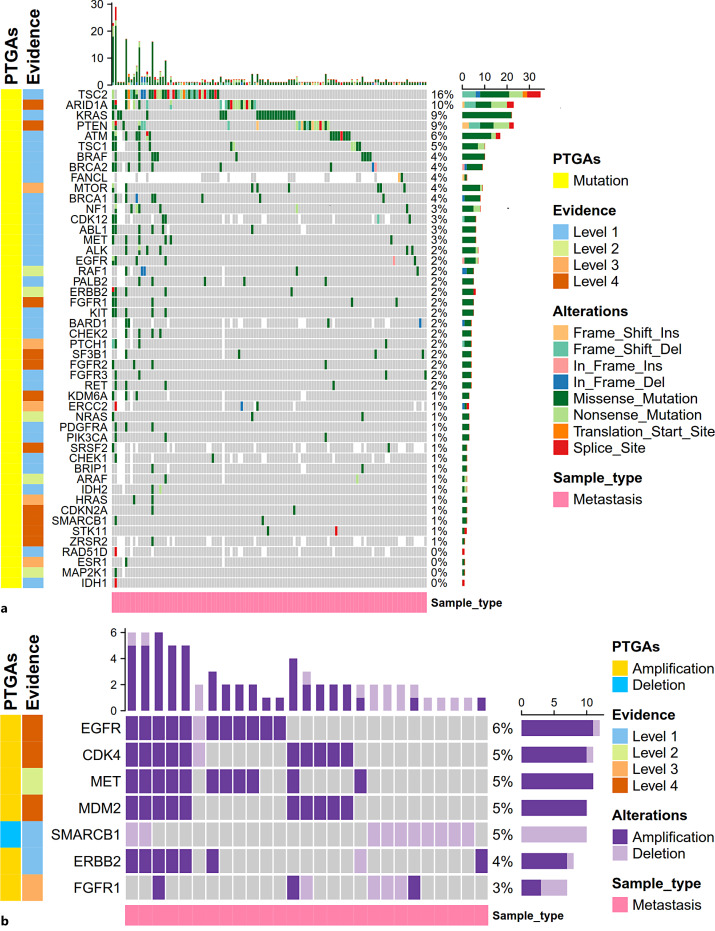
Results: Twenty-one genes had significantly higher mutation rates in metastases which included TP53 (10.3% vs. 16.9%, p = 0.035) and KRAS (3.7% vs. 9.1%, p = 0.016). Signaling pathways related to cell proliferation and metabolism were enriched in metastases, whereas epithelial-mesenchymal transition (EMT) and TGF-β signaling were enriched in primaries. Gene mutations were highly enriched in metastases that had significant unfavorable prognostic effects included mutation of TP53 (p < 0.001), KRAS (p = 0.001), ATM (p = 0.032), KMT2D (p = 0.001), RB1 (p < 0.001), and FAT1 (p < 0.001). Targetable alterations enriched in metastases included mutation of TSC2 (15.5%), ARID1A (9.7%), KRAS (9.1%), PTEN (8.7%), ATM (6.4%), amplification of EGFR (6.0%), MET (5.5%), CDK4 (5.5%), MDM2 (5.0%), and deletion of SMARCB1 (5.0%).

Conclusion: Metastases exhibited a certain extent of genomic and transcriptomic diversity from primary PanNETs. TP53 and KRAS mutation in primary samples might associate with metastasis and contribute to a poorer prognosis. A high fraction of novel targetable alterations enriched in metastases deserves to be validated in advanced PanNETs.

Keywords: Genetics; Metastasis; Molecular heterogeneity; Pancreatic neuroendocrine tumors; Targeted therapy.


Conflict of interest statement

The authors have no conflicts of interest to declare.

Figures

Fig. 1.
Fig. 1.
Overview of somatic gene mutations and copy number variations (CNVs) with high frequency in primary PanNET samples and metastases. a Mutational landscape of genes with the top 30 frequency in 523 PanNET samples (including 243 primary PanNET samples, 242 metastases, and 38 samples of unknown origins). b The landscape of gene CNVs with the top 30 frequency tested in 426 PanNET samples (including 221 primary PanNET samples, 201 metastases, and 4 samples of unknown origins). Genes not tested in the sample were filled with white blank. Variation frequency was calculated as the proportion of samples with a gene mutation (a) or CNV (b) among the total samples tested for the gene. Samples are split based on sample origins. p value represents the significance of the difference in gene mutation rates (a) and CNV rates (P-CNG: p value for gene CNA rates; P-CNL: p value for gene CNL rate; P-CNV: p value for gene CNV rate) (b) between primary PanNET samples and metastases calculated by the Fisher exact test. p value was log10 scaled and mapped with color.
Fig. 2.
Fig. 2.
Genomic difference between primary PanNET and metastatic lesions. Genes with significant different mutation rates (a), copy number variation (CNV) rates (b), copy number amplification (CNA) rates (c), and copy number loss (CNL) rates (d) between primary and metastatic PanNET samples are highlighted with orange and labeled by gene name (in a, genes with p < 0.05 are labeled with black, in b, c, d, genes with p < 0.001 are labeled with black). CDKN2A and CDKN2B deletion were the only CNLs with higher frequency in the metastases with p values of 0.027 and 0.015, respectively. Since the p values are not less than 0.001 for CDKN2A and CDKN2B, the gene names are labeled with red. p value was log2 scaled and mapped with point size. The larger the point size, the less the p value.
Fig. 3.
Fig. 3.
Comparison of gene mutations (a) and copy number variations (CNVs) (b) between paired primary and metastatic samples. Paired samples are placed together and annotated by sample origins at the bottom. Samples from different patients are split by the wide white blank.
Fig. 4.
Fig. 4.
Difference of gene expression and enriched pathways between primary PanNET samples and metastases. a The volcano plot shows the differentially expressed genes between primary PanNET samples and metastases. The cut-off value of the |log fold change| (|log FC|) and P is set at 1 and 0.05, respectively, for determining differentially expressed genes. Genes with the |log FC| > 1.5 and p < 0.05 are labeled by gene name. b The heatmap shows the mRNA expression of the top 30 differentially expressed genes in the merged dataset containing 101 primary PanNET samples and 16 metastases. c Results of gene set enrichment analysis (GSEA) based on the HALLMARK gene sets. In total, 27 gene sets were differentially enriched between primary lesion and metastases (including 20 gene sets enriched in metastases with normalized enrichment score (NES) > 0 and 7 gene sets enriched in primary PanNET samples with NES <0). d Selected gene sets enriched in the metastases. e Selected gene sets enriched in the primary PanNET samples.
Fig. 5.
Fig. 5.
Gene mutations present in more than 5% of the metastases of pancreatic neuroendocrine tumors (PanNETs) with significant prognostic effects. Favorable prognostic effects of mutation of MEN1 (p = 0.007) (a) and DAXX (p = 0.010) (b), and unfavorable prognostic effects TP53 (p < 0.001) (c), KRAS (p = 0.001) (d), ATM (p = 0.032) (e), KMT2D (p = 0.001) (f), RB1 (p = 0.002) (g), and FAT1 (p < 0.001) (h) are shown. p values are derived from the log-rank test.
Fig. 6.
Fig. 6.
Frequency and variation classification of potentially targetable gene alterations (PTGAs) annotated by OncoKB in the metastatic PanNET samples. Potentially targetable gene mutations (a), potentially targetable gene copy number variation (CNVs) including CNA and deletion (b). In total, 242 and 201 metastases were included for analysis of targetable gene mutations (a) and targetable CNVs (b), respectively. Genes not tested in the sample were filled with white blank. Variation frequency was calculated as the proportion of samples with a gene mutation (a) or CNV (b) among the total samples tested for the gene. Levels of evidence corresponding to the PTGAs were annotated based on the top level of evidence for the drug targeting the alteration documented in the OncoKB database.

Similar articles

Cited by

References

    1. Rindi G, Klimstra DS, Abedi-Ardekani B, Asa SL, Bosman FT, Brambilla E, et al. . A common classification framework for neuroendocrine neoplasms: an International Agency for Research on Cancer (IARC) and World Health Organization (WHO) expert consensus proposal. Mod Pathol. 2018 Dec;31(12):1770–86. 10.1038/s41379-018-0110-y. - DOI - PMC - PubMed
    1. Dasari A, Shen C, Halperin D, Zhao B, Zhou S, Xu Y, et al. . Trends in the incidence, prevalence, and survival outcomes in patients with neuroendocrine tumors in the United States. JAMA Oncol. 2017 Oct 1;3(10):1335–42. 10.1001/jamaoncol.2017.0589. - DOI - PMC - PubMed
    1. Sonbol MBMG, Mazza GL, Starr JS, Hobday TJ, Halfdanarson TR. Incidence and survival patterns of pancreatic neuroendocrine tumors over the last two decades: a SEER database analysis. J Clin Oncol. 2020;38(4_suppl):629. 10.1200/jco.2020.38.4_suppl.629. - DOI - PMC - PubMed
    1. Das S, Dasari A. Epidemiology, incidence, and prevalence of neuroendocrine neoplasms: are there global differences? Curr Oncol Rep. 2021 Mar 14;23(4):43. 10.1007/s11912-021-01029-7. - DOI - PMC - PubMed
    1. Yao JC, Hassan M, Phan A, Dagohoy C, Leary C, Mares JE, et al. . One hundred years after “carcinoid”: epidemiology of and prognostic factors for neuroendocrine tumors in 35,825 cases in the United States. J Clin Oncol. 2008 Jun 20;26(18):3063–72. 10.1200/jco.2007.15.4377. - DOI - PubMed

Publication types

MeSH terms

Substances