

Geographic disparities in access to liver transplantation
- PMID: 37232214
- PMCID: PMC10914246
- DOI: 10.1097/LVT.0000000000000182
Geographic disparities in access to liver transplantation
Abstract
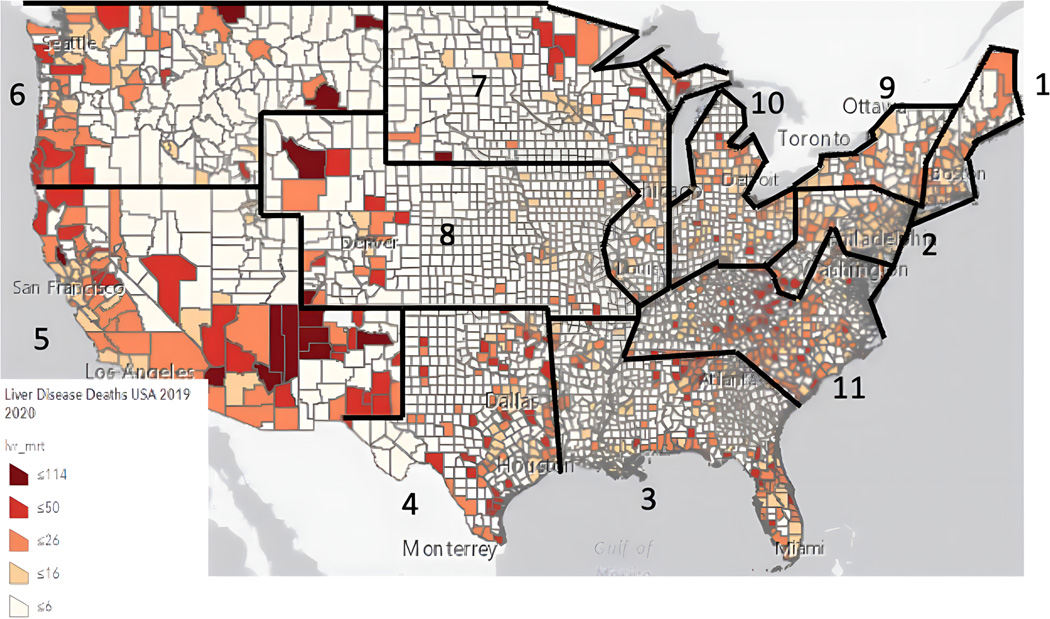
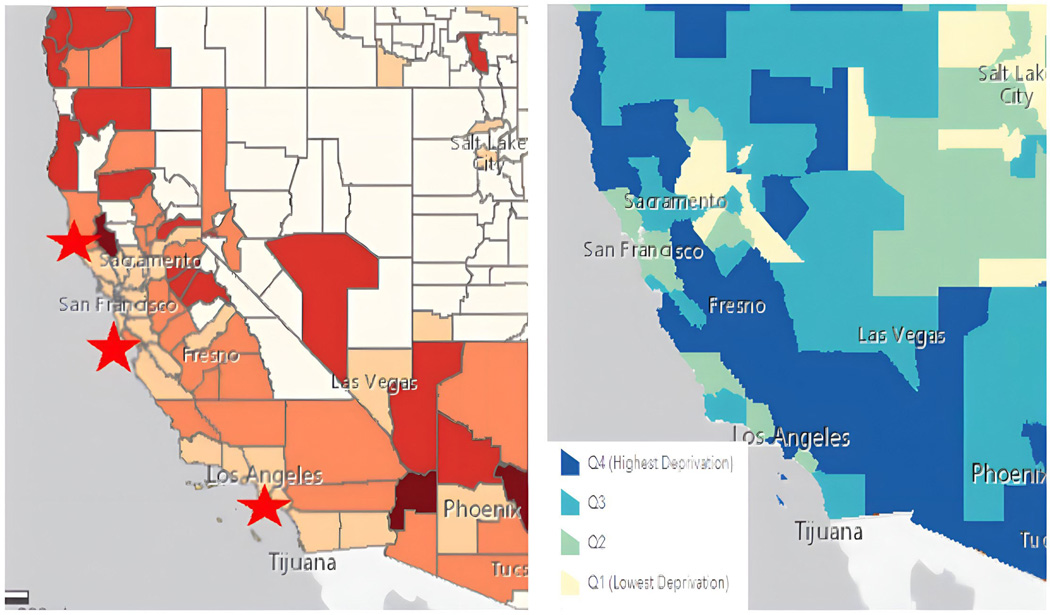
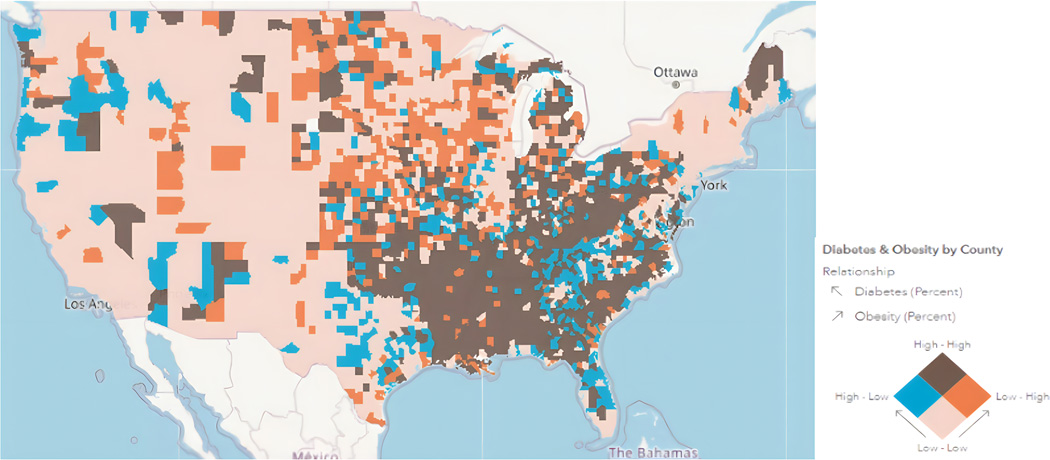
Since the Final Rule regarding transplantation was published in 1999, organ distribution policies have been implemented to reduce geographic disparity. While a recent change in liver allocation, termed acuity circles, eliminated the donor service area as a unit of distribution to decrease the geographic disparity of waitlisted patients to liver transplantation, recently published results highlight the complexity of addressing geographic disparity. From geographic variation in donor supply, as well as liver disease burden and differing model for end-stage liver disease (MELD) scores of candidates and MELD scores necessary to receive liver transplantation, to the urban-rural disparity in specialty care access, and to neighborhood deprivation (community measure of socioeconomic status) in liver transplant access, addressing disparities of access will require a multipronged approach at the patient, transplant center, and national level. Herein, we review the current knowledge of these disparities-from variation in larger (regional) to smaller (census tract or zip code) levels to the common etiologies of liver disease, which are particularly affected by these geographic boundaries. The geographic disparity in liver transplant access must balance the limited organ supply with the growing demand. We must identify patient-level factors that contribute to their geographic disparity and incorporate these findings at the transplant center level to develop targeted interventions. We must simultaneously work at the national level to standardize and share patient data (including socioeconomic status and geographic social deprivation indices) to better understand the factors that contribute to the geographic disparity. The complex interplay between organ distribution policy, referral patterns, and variable waitlisting practices with the proportion of high MELD patients and differences in potential donor supply must all be considered to create a national policy strategy to address the inequities in the system.
Copyright © 2023 American Association for the Study of Liver Diseases.
Figures
Similar articles
-
Geographic disparities in liver supply/demand ratio within fixed-distance and fixed-population circles.Am J Transplant. 2019 Jul;19(7):2044-2052. doi: 10.1111/ajt.15297. Epub 2019 Mar 18. Am J Transplant. 2019. PMID: 30748095 Free PMC article.
-
Quantifying Sex-Based Disparities in Liver Allocation.JAMA Surg. 2020 Jul 1;155(7):e201129. doi: 10.1001/jamasurg.2020.1129. Epub 2020 Jul 15. JAMA Surg. 2020. PMID: 32432699 Free PMC article.
-
Heterogeneous Circles for Liver Allocation.Hepatology. 2021 Jul;74(1):312-321. doi: 10.1002/hep.31648. Hepatology. 2021. PMID: 33219592 Free PMC article.
-
The liver allocation landscape: MELD 3.0 and continuous distribution.Curr Opin Organ Transplant. 2025 Jun 1;30(3):171-178. doi: 10.1097/MOT.0000000000001215. Epub 2025 Apr 2. Curr Opin Organ Transplant. 2025. PMID: 40172997 Review.
-
Liver allocation and distribution: time for a change.Curr Opin Organ Transplant. 2017 Apr;22(2):162-168. doi: 10.1097/MOT.0000000000000397. Curr Opin Organ Transplant. 2017. PMID: 28212159 Review.
Cited by
-
The impending hepatology workforce shortage: Ethical considerations for closing the gap.Clin Liver Dis (Hoboken). 2024 Jun 12;23(1):e0197. doi: 10.1097/CLD.0000000000000197. eCollection 2024 Jan-Jun. Clin Liver Dis (Hoboken). 2024. PMID: 38872772 Free PMC article. Review.
-
Bridging the rural-urban gap in access to liver transplantation.Clin Liver Dis (Hoboken). 2024 Jun 12;23(1):e0160. doi: 10.1097/CLD.0000000000000160. eCollection 2024 Jan-Jun. Clin Liver Dis (Hoboken). 2024. PMID: 38872770 Free PMC article. Review. No abstract available.
-
Trends in candidate hepatitis C virus nucleic acid amplification test (NAT)+ listing and associated impacts on liver transplantation waitlist outcomes.Am J Transplant. 2025 Apr;25(4):793-803. doi: 10.1016/j.ajt.2024.10.016. Epub 2024 Oct 24. Am J Transplant. 2025. PMID: 39461480
-
Significant Disparities in Hepatocellular Carcinoma Outcomes by Race/Ethnicity and Sociodemographic Factors.Cancer Epidemiol Biomarkers Prev. 2025 Feb 6;34(2):355-365. doi: 10.1158/1055-9965.EPI-24-1094. Cancer Epidemiol Biomarkers Prev. 2025. PMID: 39636161 Free PMC article.
-
Targeted Broader Sharing for Liver Continuous Distribution.Transplantation. 2025 Jan 1;109(1):e36-e44. doi: 10.1097/TP.0000000000005184. Epub 2024 Sep 9. Transplantation. 2025. PMID: 39245819
References
-
- Kim D, Perumpail BJ, Alshuwaykh O, Dennis BB, Cholankeril G, Ahmed A. Changing Trends in Etiology-Based Hospitalizations with End-Stage Liver Disease in the United States from 2016 to 2019. Liver Int 2022. - PubMed
-
- OPTN Final Rule, 42 C.F.R. Section 121.8.
-
- Burton AM, Goldberg DS. Center-level and region-level variations in liver transplantation practices following acuity circles policy change. Am J Transplant 2022. - PubMed
-
- Nagai S, Chau LC, Schilke RE, et al. Effects of Allocating Livers for Transplantation Based on Model for End-Stage Liver Disease-Sodium Scores on Patient Outcomes. Gastroenterology 2018; 155(5): 1451–62.e3. - PubMed
