. 2023 Jun 15;136(12):jcs260468.
doi: 10.1242/jcs.260468. Epub 2023 Jun 23.

Proximity labelling identifies pro-migratory endocytic recycling cargo and machinery of the Rab4 and Rab11 families

Affiliations

Proximity labelling identifies pro-migratory endocytic recycling cargo and machinery of the Rab4 and Rab11 families

Beverley Wilson et al. J Cell Sci. .

Abstract

Endocytic recycling controls the return of internalised cargoes to the plasma membrane to coordinate their positioning, availability and downstream signalling. The Rab4 and Rab11 small GTPase families regulate distinct recycling routes, broadly classified as fast recycling from early endosomes (Rab4) and slow recycling from perinuclear recycling endosomes (Rab11), and both routes handle a broad range of overlapping cargoes to regulate cell behaviour. We adopted a proximity labelling approach, BioID, to identify and compare the protein complexes recruited by Rab4a, Rab11a and Rab25 (a Rab11 family member implicated in cancer aggressiveness), revealing statistically robust protein-protein interaction networks of both new and well-characterised cargoes and trafficking machinery in migratory cancer cells. Gene ontological analysis of these interconnected networks revealed that these endocytic recycling pathways are intrinsically connected to cell motility and cell adhesion. Using a knock-sideways relocalisation approach, we were further able to confirm novel links between Rab11, Rab25 and the ESCPE-1 and retromer multiprotein sorting complexes, and identify new endocytic recycling machinery associated with Rab4, Rab11 and Rab25 that regulates cancer cell migration in the 3D matrix.

Keywords: Cell migration; Endocytic recycling; Rab11; Rab25; Rab4.


Conflict of interest statement

Competing interests The authors declare no competing or financial interests.

Figures

Fig. 1.
Fig. 1.
BioID identifies a network of proteins associated with the regulators of endocytic recycling, Rab4a, Rab11a and Rab25. (A) Localisation of fusion proteins and biotinylated proteins in A2780 cells stably expressing mycBirA* or mycBirA*-tagged Rab4a, Rab11a or Rab25 cultured with biotin (1 μM, 16 h). Zoomed regions show the perinuclear region of the cell. Images are representative of three independent experiments. Scale bars: 20 μm. (B) Network showing the proteins identified as high-confidence proximal proteins [Bayesian false discovery rate (BFDR)≤0.05] for Rab4A, Rab11a and Rab25. Thicker lines connecting proteins to bait Rab GTPases represent interactions found in the BioGRID PPI database. Coloured nodes represent bait proteins, white nodes represent proteins enriched to one Rab GTPase, pale grey nodes represent proteins enriched to two Rab GTPases and dark grey nodes represent proteins enriched to all three Rab GTPases.
Fig. 2.
Fig. 2.
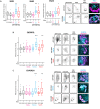
The Rab4 and Rab11 families differentially regulate F-actin protrusions. A2780-DNA3 cells and A2780-Rab25 cells [depleted of Rab4a and Rab4b (indicated as Rab4ab), or Rab11a and Rab11b (indicated as Rab11ab) by siRNAs where appropriate] were seeded into the cell-derived matrix (CDM) for 16 h before fixation, staining for F-actin, and imaging by confocal microscopy. (A) Representative images (magenta hot lookup table); arrows indicate filopodia and arrowheads indicate lamellipodia. Scale bar: 20 µm. (B) The width of the protrusion extended furthest from the cell was measured 2–5 µm from its greatest extent. Boxes indicate the 25–75th percentiles, whiskers are drawn in Tukey style where the upper whisker equals the 75th percentile plus 1.5× the interquartile range and the lower whisker equals the 25th percentile minus 1.5× the interquartile range, the mean is marked with a ‘+’, the median is marked with a line and individual points are plotted where they lie outside the whiskers. Statistical analysis was performed with one-way ANOVA and Kruskal–Wallis post hoc test (control versus Rab4ab or Rab11ab) or Mann–Whitney test (DNA3 versus Rab25 cells). (C) For each cell, protrusions were scored as ‘lamellipodial’ or ‘filopodial’. Note that cells with only lamellipodial protrusions were not observed (statistical analysis with Fisher's exact test). n>17 cells/condition from at least three independent experiments. *P<0.05; **P<0.01; ***P<0.001; ****P<0.001.
Fig. 3.
Fig. 3.
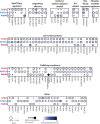
Enrichment of associated proteins to endocytic recycling Rab GTPase baits. Dot plots of the high-confidence proximal proteins were generated using the ProHits-viz online tool (Knight et al., 2017). Proximal proteins are represented by circles and are attributed to each of the three bait Rab GTPases in rows and were manually split into different groups based on their function. Circle size relates to the relative abundance of the protein in that sample (analogous to fold change). Circle colour relates to the average intensity (AveragePeptideIntensity) of the protein in that sample. Circle outline relates to whether the protein is classed as a high-confidence enriched protein to that sample (BFDR≤0.05).
Fig. 4.
Fig. 4.
Biotin-modified peptides reveal proximal interactors within PPI networks. (A–C) High-confidence Rab4a (A), Rab11a (B) and Rab25 (C) proximal proteins (Fig. 1B) were mapped onto a PPI database. Rab GTPase nodes are coloured black, other nodes are the high-confidence proximal proteins identified for each Rab GTPase. Edges represent interactions present within the PPI database. Node sizes represent log2(fold change) values, node borders represent BFDR values from SAINTexpress analysis, and node colours represent the median numbers of biotinylated peptides identified. (D,E) Biotinylated integrin β1 (D) or β5 (E) peptides were mapped to protein domains. Protein domains are shown by grey colourings; domains are not to scale. The positions of the biotinylated peptides in the protein are indicated, and coloured boxes show the samples in which they were identified; Rab11a in blue, Rab25 in red, and Rab4a in pink.
Fig. 5.
Fig. 5.
Knock-sideways validation of proximity labelling-identified preys. (A) Schematic illustration of knock-sideways, where mitochondria-targeted FRB/rapamycin is used to induce the re-localisation of GFP–FKBP-tagged Rabs and associated protein complexes. (B,C) A2780 cells expressing iRFP670–FRB and GFP–FKBP or GFP–FKBP-tagged Rab4a, Rab11a or Rab25 and mCherry–Rab11FIP5 were imaged by spinning-disk confocal microscopy, before and after the addition of rapamycin (200 nM) to visualise the redistribution of GFP-tagged proteins and the corresponding localisation of mCherry–Rab11FIP5. Re-distribution of GFP–FKBP fusion (1) and mCherry–Rab11FIP5 (2) were analysed by Pearson's correlation (at least 30 cells/condition). Box plots are presented as described as in Fig. 2. Statistical analysis was performed with one-way ANOVA with Holm–Sidak post hoc test. ns, not significant; **P<0.01; ***P<0.001. (C) Representative images from at least three independent timelapse experiments are shown. Scale bar: 10 µm.
Fig. 6.
Fig. 6.
Trafficking machineries are selectively recruited to recycling Rabs. (A–C) A2780 cells expressing iRFP670–FRB and GFP–FKBP–Rab proteins treated with rapamycin (200 nM, 4 h) were fixed and stained for endogenous SNX1, SNX2 or SNX3 (A), SH3BP5L (B) or CRACR2A (C). Redistribution of candidate trafficking machinery was analysed by quantifying mitochondrial overlap (see Materials and Methods; 9–47 cells/condition). Box plots are presented as described as in Fig. 2. Statistical analysis is indicated compared to GFP–FKBP +rapamycin control using Kruskal–Wallis test with Dunn's multiple comparisons. *P<0.05; **P<0.01; ***P<0.01; ****P<0.0001. Representative images from at least three independent experiments are shown. Scale bars: 10 µm.
Fig. 7.
Fig. 7.
Rab4- and Rab25-specific machinery is required for cell migration in the 3D matrix. (A–D) A2780-DNA3 and A2780-Rab25 cells were depleted of CLINT1 (A,B) or SH3BP5L (C,D) by siRNA and seeded into CDM for 4 h, before migration was analysed by brightfield time-lapse imaging for >16 h. Cell speed was analysed by manual tracking (A,C). Representative images from at least three independent experiments are shown (B,D). Red lines indicate the migration of cells marked with asterisks. Scale bars: 100 µm. (E,F) BT20 cells were depleted of Rab4a and Rab4b (indicated as Rab4ab), Rab11a and Rab11b (indicated as Rab11ab), or Rab25 by siRNA and migration analysis performed as above to determine cell speed (E) and cell persistence (F). (G) BT20 cells were depleted of CLINT1 or SH3BP5L by siRNA and migration analysis performed as above. (H) Representative images of BT20 cells analysed in G. Yellow lines indicate the migration of cells marked with asterisks. Scale bars: 50 µm. For A–H, n≥90 cells from three independent experiments. Box plots are presented as described as in Fig. 2. Statistical analysis was performed with Kruskal–Wallis and Dunn's multiple comparisons test. *P<0.05; **P<0.01; ***P<0.001; ****P<0.0001.
Fig. 8.
Fig. 8.
CRACR2A is required for cell migration in the 3D matrix. (A,B) A2780-DNA3, A2780-Rab25 (A,B) and MDA-MB-231 (C) cells were depleted of CRACR2A by siRNA and seeded into the CDM for 4 h, before migration was analysed by brightfield time-lapse imaging for >16 h. Cell speed was analysed by manual tracking. n≥90 cells from three independent experiments. Box plots are presented as described as in Fig. 2. Statistical analysis was performed with Kruskal–Wallis and Dunn's multiple comparisons test. **P<0.01; ****P<0.0001. Representative images from at least three independent experiments are shown. Dotted lines (B) indicate the extremities of each cell at that timepoint. Yellow lines (C) indicate the migration of cells marked with asterisks. Scale bars: 40 µm (A,B); 100 µm (C). (D) A2780 cells expressing GFP–Rab25 and mCherry–CRACR2A were seeded into the CDM for 4 h before time-lapse imaging by spinning-disk confocal microscopy. The dashed white box indicates the area enlarged in lower panels. The white arrow indicates the direction of migration; yellow arrowheads indicate the positions of CRACR2A-positive late endosomes and/or lysosomes that show overlap with Rab25. Images are representative of three independent experiments. Scale bars: 20 µm.

References

    1. Caswell, P. T., Spence, H. J., Parsons, M., White, D. P., Clark, K., Cheng, K. W., Mills, G. B., Humphries, M. J., Messent, A. J., Anderson, K. I.et al. (2007). Rab25 associates with alpha5beta1 integrin to promote invasive migration in 3D microenvironments. Dev. Cell 13, 496-510. 10.1016/j.devcel.2007.08.012 - DOI - PubMed
    1. Caswell, P. T., Chan, M., Lindsay, A. J., McCaffrey, M. W., Boettiger, D. and Norman, J. C. (2008). Rab-coupling protein coordinates recycling of alpha5beta1 integrin and EGFR1 to promote cell migration in 3D microenvironments. J. Cell Biol. 183, 143-155. 10.1083/jcb.200804140 - DOI - PMC - PubMed
    1. Cheng, K. W., Lahad, J. P., Kuo, W.-L., Lapuk, A., Yamada, K., Auersperg, N., Liu, J., Smith-McCune, K., Lu, K. H., Fishman, D.et al. (2004). The RAB25 small GTPase determines aggressiveness of ovarian and breast cancers. Nat. Med. 10, 1251-1256. 10.1038/nm1125 - DOI - PubMed
    1. Christoforides, C., Rainero, E., Brown, K. K., Norman, J. C. and Toker, A. (2012). PKD controls αvβ3 integrin recycling and tumor cell invasive migration through its substrate Rabaptin-5. Dev. Cell 23, 560-572. 10.1016/j.devcel.2012.08.008 - DOI - PMC - PubMed
    1. Cukierman, E., Pankov, R., Stevens, D. R. and Yamada, K. M. (2001). Taking cell-matrix adhesions to the third dimension. Science 294, 1708-1712. 10.1126/science.1064829 - DOI - PubMed

Publication types

MeSH terms

Substances