. 2023 May 26:12:e84645.
doi: 10.7554/eLife.84645.

The prolactin receptor scaffolds Janus kinase 2 via co-structure formation with phosphoinositide-4,5-bisphosphate

Affiliations

The prolactin receptor scaffolds Janus kinase 2 via co-structure formation with phosphoinositide-4,5-bisphosphate

Raul Araya-Secchi et al. Elife. .

Abstract

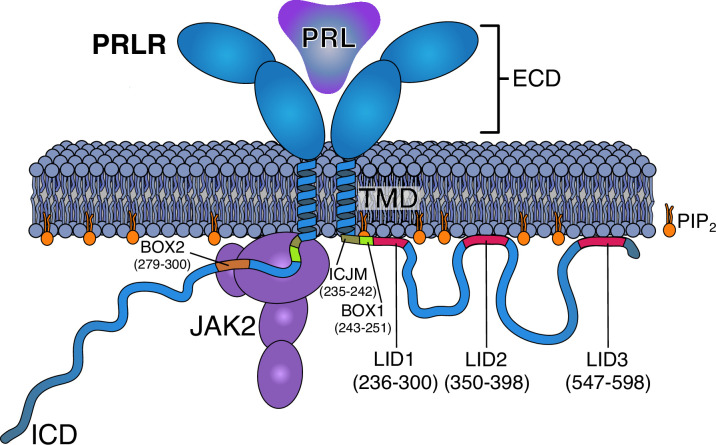
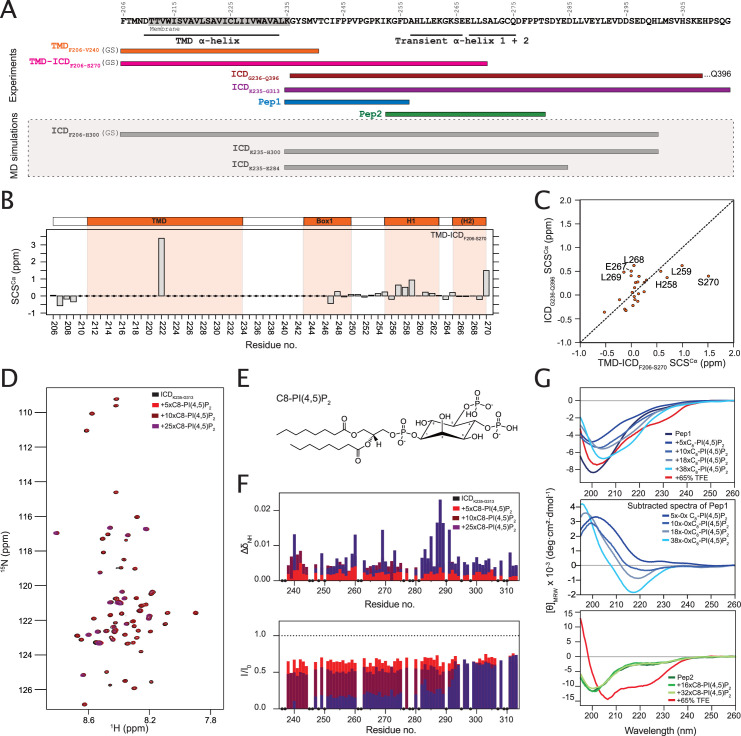
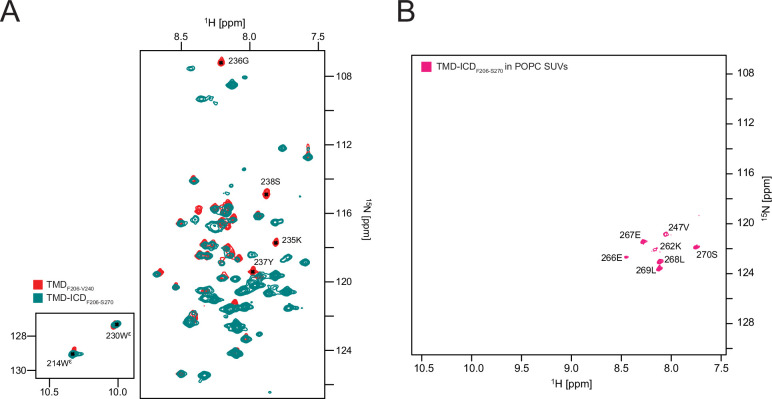
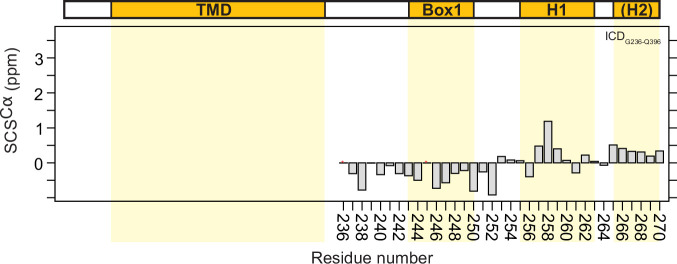
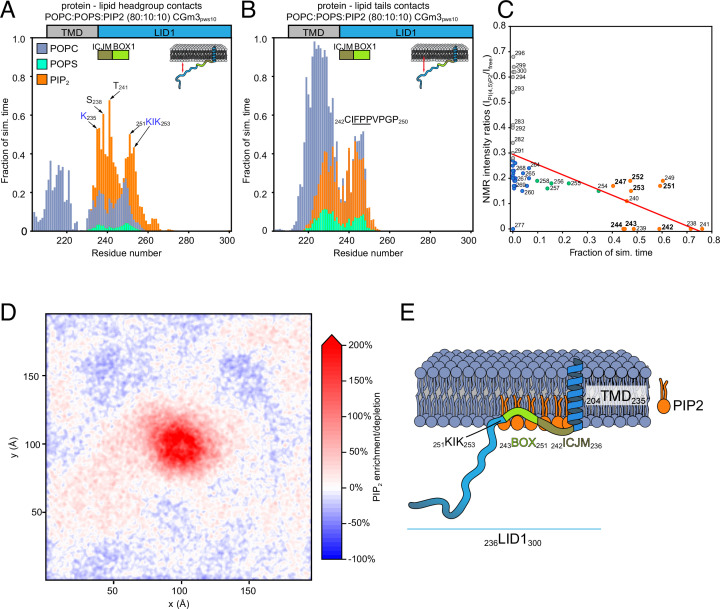
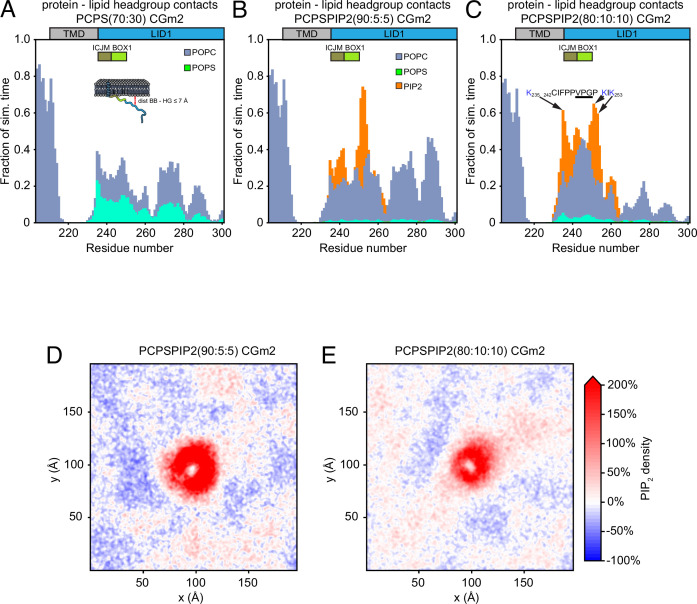
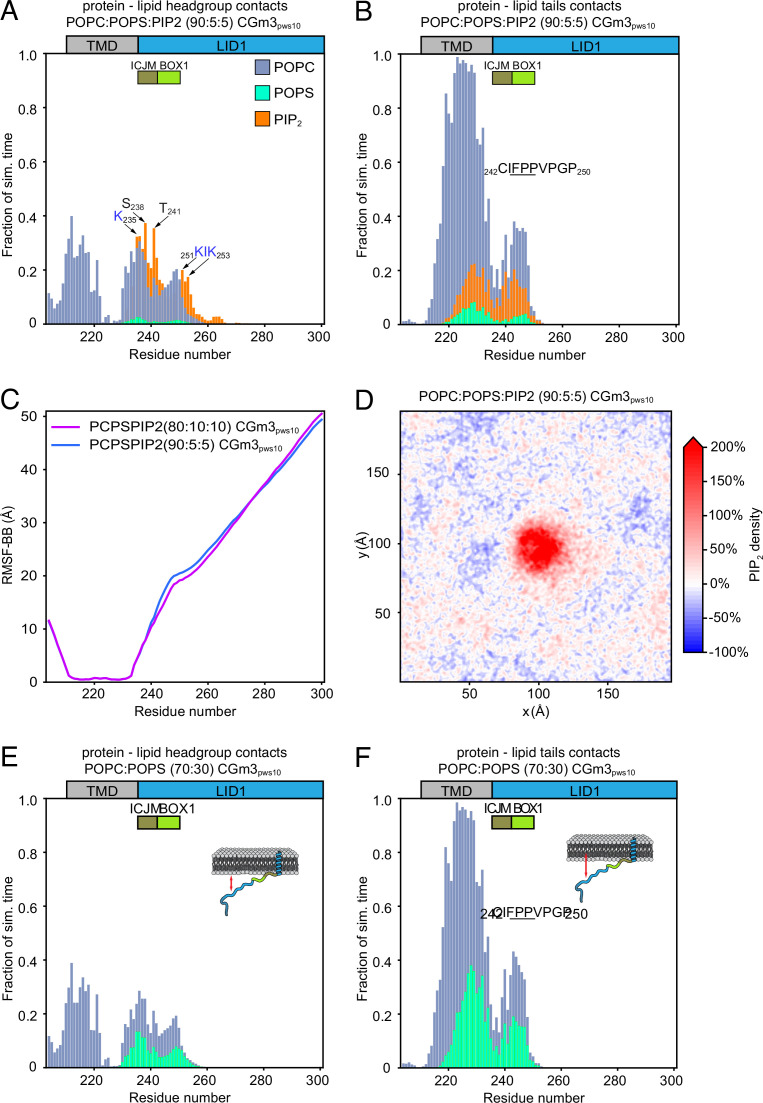
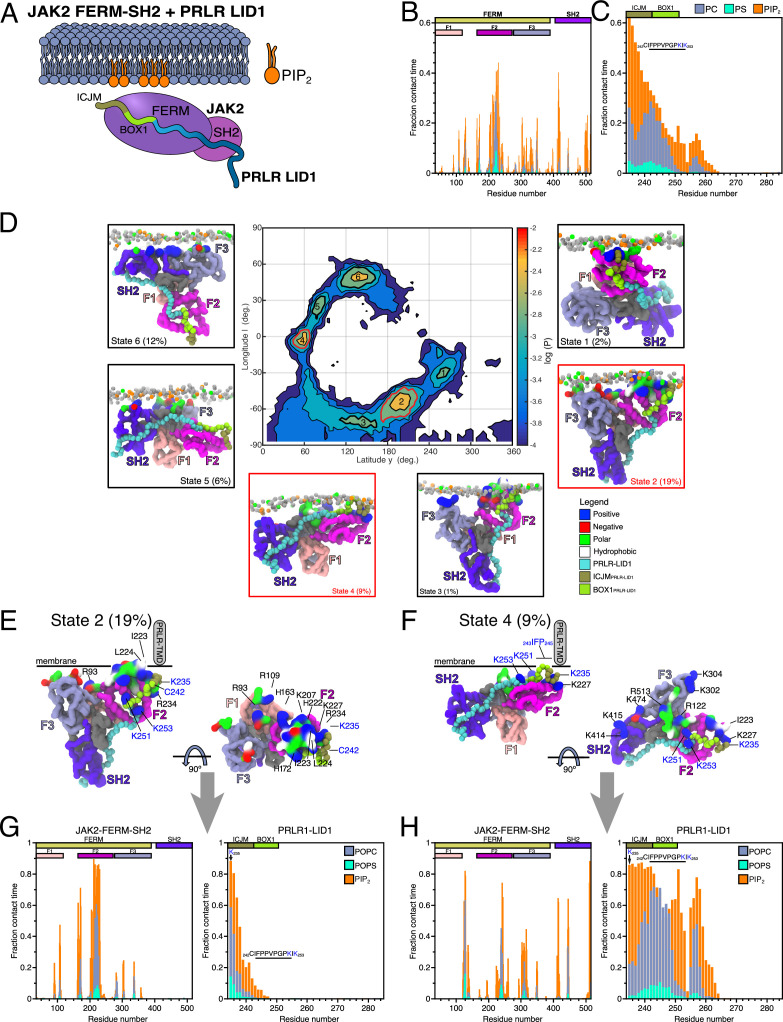
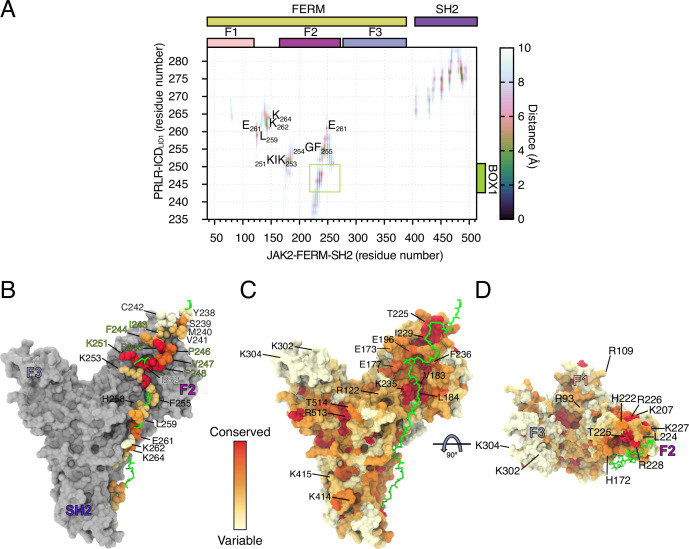
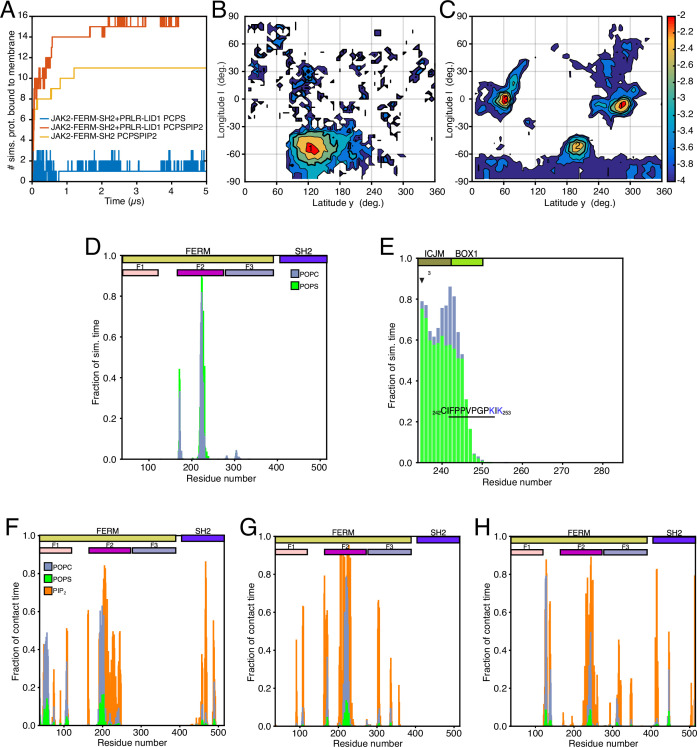
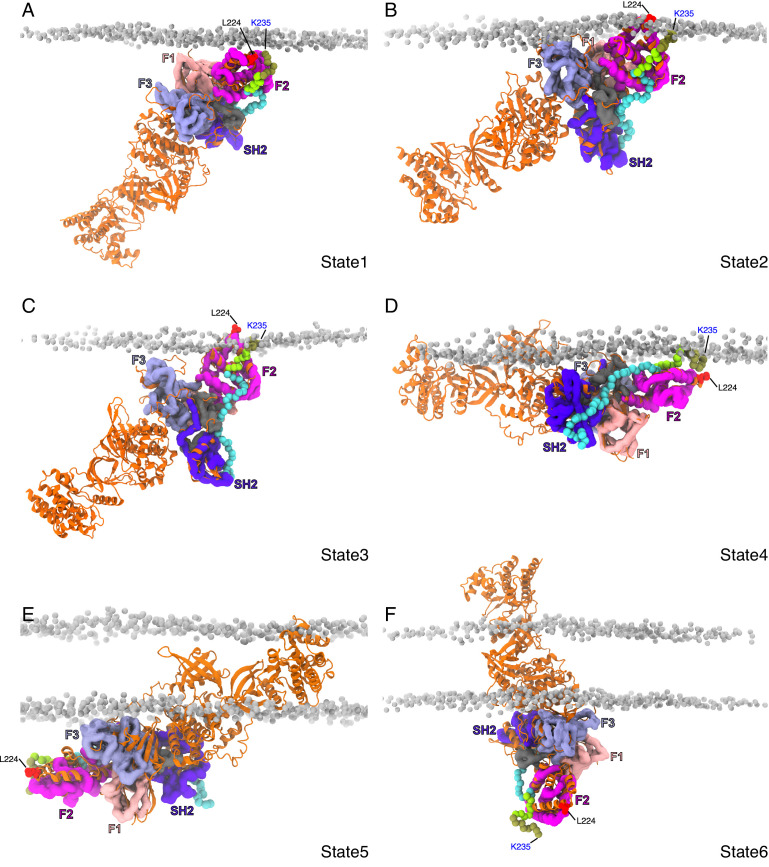
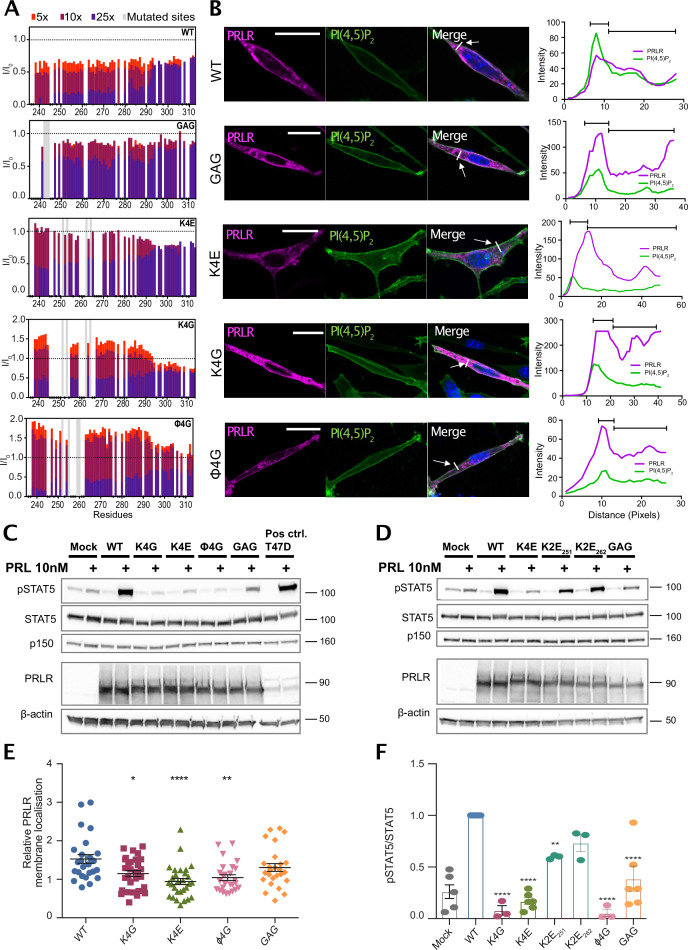
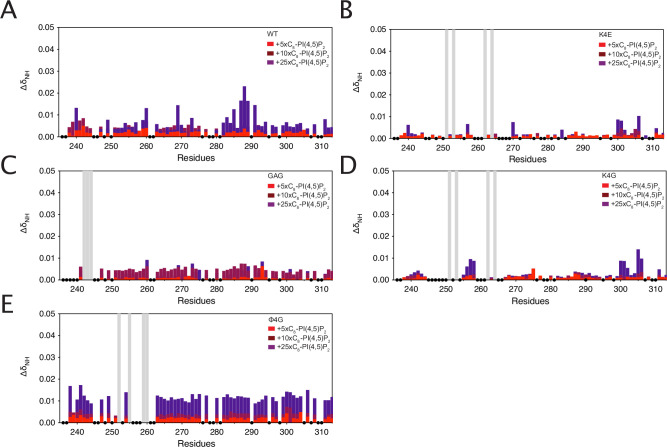
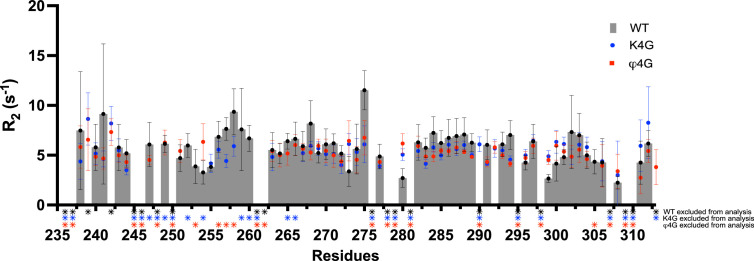
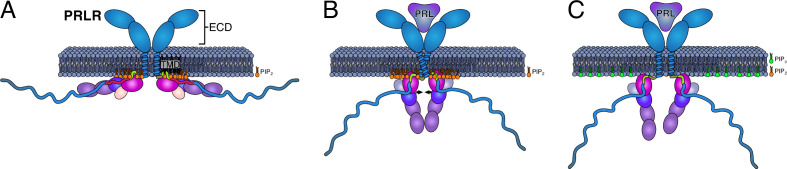
Class 1 cytokine receptors transmit signals through the membrane by a single transmembrane helix to an intrinsically disordered cytoplasmic domain that lacks kinase activity. While specific binding to phosphoinositides has been reported for the prolactin receptor (PRLR), the role of lipids in PRLR signaling is unclear. Using an integrative approach combining nuclear magnetic resonance spectroscopy, cellular signaling experiments, computational modeling, and simulation, we demonstrate co-structure formation of the disordered intracellular domain of the human PRLR, the membrane constituent phosphoinositide-4,5-bisphosphate (PI(4,5)P2) and the FERM-SH2 domain of the Janus kinase 2 (JAK2). We find that the complex leads to accumulation of PI(4,5)P2 at the transmembrane helix interface and that the mutation of residues identified to interact specifically with PI(4,5)P2 negatively affects PRLR-mediated activation of signal transducer and activator of transcription 5 (STAT5). Facilitated by co-structure formation, the membrane-proximal disordered region arranges into an extended structure. We suggest that the co-structure formed between PRLR, JAK2, and PI(4,5)P2 locks the juxtamembrane disordered domain of the PRLR in an extended structure, enabling signal relay from the extracellular to the intracellular domain upon ligand binding. We find that the co-structure exists in different states which we speculate could be relevant for turning signaling on and off. Similar co-structures may be relevant for other non-receptor tyrosine kinases and their receptors.

Keywords: IDP; JAK2; NMR; human; integrative structural biology; molecular biophysics; simulation; single pass receptor; structural biology.


Conflict of interest statement

RA, KB, PS, AP, GH, KL, SP, LA, BK No competing interests declared

Figures

Figure 1.
Figure 1.. Schematics of the PRLR:PRL:JAK2 complex in the membrane.
The PRLR is shown in light blue, the PRL as a dark blue triangle, the PRLR-ICD as a disordered chain, and JAK2 in purple. The PI(4,5)P2 lipid (PIP2) is shown in orange. The intracellular juxtamembrane (ICJM) region and BOX1 of PRLR-ICD are highlighted in green nuances, while the three LIDs as defined in Haxholm et al., 2015 are highlighted in red. For simplicity, only one of the two ICDs is shown associated with JAK2 via the BOX1 (green) and BOX2 (orange) motifs. PRLR, prolactin receptor; ICD, intracellular domain; LID, lipid interaction domains.
Figure 2.
Figure 2.. The intracellular juxtamembrane (ICJM) region of the prolactin receptor (PRLR) interacts with PI(4,5)P2.
(A) Overview of investigated PRLR variants. (B) Secondary chemical shifts (SCSs) of transmembrane domain (TMD)-intracellular domain (ICD)F206-S270 reconstituted in 1,2-dihexanoyl-sn-glycero-3-phosphocholine (DHPC) micelles. (C) Correlation plot of the SCSs of ICDG236-Q396 plotted against those of TMD-ICDF206-S270. (D) 15N,1H-HSQC spectra of 15N-ICDK235-G313 titrated with 5×, 10×, and 25× molar excess of C8-PI(4,5)P2. (E) Structure of C8-PI(4,5)P2. (F) Backbone amide chemical shift perturbations (CSPs) and peak intensity changes upon addition of C8-PI(4,5)P2 to 15N-ICDK235-G313 plotted against residue number. (G) Top: Far-UV CD spectra of Pep1 titrated with C8-PI(4,5)P2 or in 65% trifluorethanol (TFE). Middle: Far-UV CD spectra of Pep1 in the presence of 5 x-38x C8-PI(4,5)P2 subtracted with the spectrum of Pep1 in the absence of C8-PI(4,5)P2. Bottom: Far-UV CD spectra of Pep2 titrated with C8-PI(4,5)P2 or in 65% TFE.
Figure 2—figure supplement 1.
Figure 2—figure supplement 1.. 15N, 1H-HSQC spectra.
(A) transmembrane domain (TMD)F206-V240 and TMD-intracellular domain (ICD)F206-S270 in 1,2-dihexanoyl-sn-glycero-3-phosphocholine (DHPC) micelles, and (B) TMD-ICDF206-S270 in 1-palmitoyl-2-oleoyl-sn-glycero-3-phosphocholine (POPC) small unilamellar vesicles (SUVs).
Figure 2—figure supplement 2.
Figure 2—figure supplement 2.. Cα secondary chemical shifts of intracellular domain (ICD)G236-Q396.
Figure 3.
Figure 3.. Protein–lipid interactions of prolactin receptor (PRLR)-intracellular domain (ICD)LID1 obtained from coarse-grained (CG)-molecular dynamic (MD) simulations.
(A–B) Protein–lipids contact histograms for PRLR-ICDLID1 +POPC:POPS:PI(4,5)P2 (80:10:10). (A) Contacts between the protein and lipid headgroups. A contact is counted if the distance between the backbone beads of the protein is ≤7 Å from the head-group beads of the lipids. (B) Contacts between the protein and the acyl chains of the lipids. A contact is counted if the distance between the backbone bead of the protein is ≤7 Å from the acyl-chain bead of the lipids. (C) Correlation between the change in nuclear magnetic resonance (NMR) signal and the contact frequency between PRLR-ICDLID1 and the lipid headgroups from the PRLR-ICDLID1 +POPC:POPS:PI(4,5)P2 (80:10:10) system. Pearson correlation coefficient of –0.55 with p=4.0 × 10⁻⁵ and R2=0.3. (D) Average PI(4,5)P2 density map (xy-plane) taken from the PRLR-ICDLID1 +POPC:POPS:PI(4,5)P2 (80:10:10) simulation. The map is colored according to the enrichment/depletion percentage with respect to the average density value. (E) Schematic representation of how the interactions and the embedment into the membrane of PRLR contribute to the co-structure formation. The data from the simulations correspond to those of the production stage (see methods). POPC, 1-palmitoyl-2-oleoyl-sn-glycero-3-phosphocholine; POPS, 1-palmitoyl-2-oleoyl-sn-glycero-3-phospho-L-serine.
Figure 3—figure supplement 1.
Figure 3—figure supplement 1.. Protein–lipid interactions of prolactin receptor (PRLR)-intracellular domain (ICD)LID1 obtained from coarse-grained (CG)-molecular dynamic (MD) simulations using the martini 2.2 force field.
(A–C) Protein–lipid-headgroups contact histograms from: (A) the PRLR-ICDLID1 POPC:POPS (70:30) CGm2 simulation, (B) PRLR-ICDLID1 POPC:POPS:PI(4,5)P2 (90:5:5) CGm2 simulation and (C) PRLR-ICDLID1 PRLR-ICDLID1POPC:POPS:PI(4,5)P2 (80:10:10) CGm2 simulation. POPC, 1-palmitoyl-2-oleoyl-sn-glycero-3-phosphocholine; POPS, 1-palmitoyl-2-oleoyl-sn-glycero-3-phospho-L-serine.
Figure 3—figure supplement 2.
Figure 3—figure supplement 2.. Complementary analysis of protein–lipid interactions of prolactin receptor (PRLR)-intracellular domain (ICD)LID1 obtained from coarse-grained (CG)-molecular dynamic (MD) simulations using the martini 3.0b3.2 force field.
(A and B) Protein–lipids contact histograms from the PRLR-ICDLID1 POPC:POPS:PI(4,5)P2 (90:5:5) CGm3pws10 simulation. (A) Contacts between the protein and lipid headgroups. (B) Contacts between the protein and the acyl chains of the lipids. (C) Root means square fluctuation (RMSF) of the BB beads obtained from the PRLR-ICDLID1POPC:POPS:PI(4,5)P2 (80:10:10) CGm3pws10 simulation (magenta line) and the PRLR-ICDLID1 POPC:POPS:PI(4,5)P2 (90:5:5) CGm3pws10 simulation (blue line). (D) Average PI(4,5)P2 density map (xy-plane) taken from the PRLR-ICDLID1 +POPC:POPS:PI(4,5)P2(90:5:5) CGm3pws10 simulation. (E–F) Protein–lipids contact histograms from the PRLR-ICDLID1 POPC:POPS (30:70) CGm3pws10 simulation. (E) Contacts between the protein and lipid headgroups. (F) Contacts between the protein and the acyl chains of the lipids. In A and B and E and F, protein–lipid contacts are defined as in Figure 3. POPC, 1-palmitoyl-2-oleoyl-sn-glycero-3-phosphocholine; POPS, 1-palmitoyl-2-oleoyl-sn-glycero-3-phospho-L-serine.
Figure 4.
Figure 4.. Protein–lipid interactions of the JAK2-FERM-SH2 PRLR-ICDLID1 complex obtained from coarse-grained (CG)-molecular dynamic (MD) simulations.
(A) Schematic representation of the simulated system. Combined (B) JAK2-FERM-SH2-lipid and (C) PRLR-ICDLID1-lipid contact frequency histograms for the 16 CG simulations of the JAK2-FERM-SH2+PRLR-ICDLID1+POPC:POPS:PI(4,5)P2 system. (D) Distribution of the orientations adopted by the JAK2-FERM-SH2+PRLR-ICDLID1 complex when bound to lipids taken from the 16 simulations with POPC:POPS:PI(4,5)P2 in the lower-leaflet. The snapshots surrounding the map correspond to representative conformations of the highlighted states also indicating the fraction total bound time for which each state was observed. Representative conformations of (E) State 2 and (F) State 4. The gray cylinder depicts the position where PRLR-transmembrane domain (TMD) should be located. Representative protein–lipid contact histograms for (G) State 2 and (H) State 4 colored as in panels B and C. POPC, 1-palmitoyl-2-oleoyl-sn-glycero-3-phosphocholine; POPS, 1-palmitoyl-2-oleoyl-sn-glycero-3-phospho-L-serine.
Figure 4—figure supplement 1.
Figure 4—figure supplement 1.. Analysis of the JAK2-FERM-SH2- PRLR-ICDK235-H300 all atom MD simulation.
(A) Average distance map between JAK2-FERM-SH2 and PRLR-ICDK235-H300 obtained from the all-atom molecular dynamic (MD) simulation. (B) Conservation of residues from prolactin receptor (PRLR) in contact with JAK2-FERM-SH2 (see A). Residues with green label correspond to BOX1. (C–D) Conservation JAK2-FERM-SH2 oriented as state 2 (see Figure 4E). Labeled residues correspond to residues that contact PRLR (see A) or that contact the lipids on states 2 and 4 (see Figure 4E–H).
Figure 4—figure supplement 2.
Figure 4—figure supplement 2.. Complementary analysis of protein–lipid interactions of the JAK2-FERM-SH2 PRLR-intracellular domain (ICD)K235-H300 complex obtained from coarse-grained (CG)-molecular dynamic (MD) simulations.
(A) Number of simulations where protein is bound to the lower-leaf of the bilayer for the simulations containing: the JAK2-FERM-SH2+PRLR-ICDK235-H300 complex near a POPC:POPS(70:30) bilayer (blue line) and the JAK2-FERM-SH2+PRLR-ICDK235-H300 complex (red line) and the apo JAK2-FERM-SH2 (orange line)near a POPC:POPS:PI(4,5)P2 (80:10:10) bilayer. (B–C) Distribution of the orientations adopted by (B) the JAK2-FERM-SH2+PRLR-ICDK235-H300 complex when bound to lipids taken from the simulations with POPC:POPS(70:30) in the lower-leaflet and (C) the apo JAK2-FERM-SH2 when bound to lipids taken from the simulations with POPC:POPS:PI(4,5)P2 (80:10:10) in the lower-leaflet. (D–E) Representative protein–lipid contact histograms for State 1 observed for the JAK2-FERM-SH2+PRLR- ICDK235-H300 complex near a POPC:POPS(70:30) bilayer. (F–H) Representative protein–lipid contact histograms for States 1, 2, and 3 observed for the apo JAK2-FERM-SH2 near a POPC:POPS:PI(4,5)P2 (80:10:10) bilayer. POPC, 1-palmitoyl-2-oleoyl-sn-glycero-3-phosphocholine; POPS, 1-palmitoyl-2-oleoyl-sn-glycero-3-phospho-L-serine.
Figure 4—figure supplement 3.
Figure 4—figure supplement 3.. Snapshots of the different binding states observed for the JAK2-FERM-SH2 – prolactin receptor (PRLR)-intracellular domain (ICD)K235-H300 complex with the complete structural model of JAK2 (obtained from AF2-EBI database).
In each panel, the coarse-grained (CG) JAK2-FERM-SH2 – PRLR-ICDK235-H300 complex is depicted and colored as in Figure 4. The full-length JAK2 model is shown in cartoon representation colored orange near a POPC:POPS(70:30) bilayer. (F–H) Representative protein–lipid contact histograms for States 1, 2, and 3 observed for the apo JAK2-FERM-SH2 near a POPC:POPS:PI(4,5)P2 (80:10:10) bilayer. POPC, 1-palmitoyl-2-oleoyl-sn-glycero-3-phosphocholine; POPS, 1-palmitoyl-2-oleoyl-sn-glycero-3-phospho-L-serine.
Figure 5.
Figure 5.. PRLR variants with mutations in lipid interacting residues exhibit decreased PRL-stimulated STAT5 activation in AP1-2PH-PLCδ-GFP cells.
(A) NMR peak intensity changes of PRLR-ICDK235-G313 variants: WT, K4G, K4E, φ4G, and GAG variants upon titration with 5×, 10×, and 25× molar excess C8-PI(4,5)P2 plotted against residue number. (B) The PRLR variants (WT, K4G, K4E, φ4G, and 3GAG) were transiently transfected in AP1 cells stably expressing the 2PH-PLCδ-GFP construct which visualizes the plasma membrane by binding PI(4,5)P2. The cells were subsequently analyzed by immunofluorescence microscopy, using antibodies against PRLR (magenta) and GFP (green), as well as DAPI (blue) to mark nuclei. To the right, examples of an average line-scan for each PRLR variant are shown. The fluorescence intensity depicted along the white line drawn (arrow) and green fluorescence (plasma membrane) was used to divide the line in a plasma membrane section and intracellular section, and relative membrane localization was calculated as the average fluorescence of PRLR in the membrane section divided by that in the intracellular section. (C and D) AP1-2PH-PLCδ-GFP cells were transiently transfected with PRLR variants (WT, K4G, K4E, φ4G, 3GAG, K2E253, and K2E261), incubated overnight followed by serum starvation for 16–17 h and were subsequently incubated with or without 10 nM prolactin for 30 min. The resulting lysates were analyzed by western blot for STAT5, pSTAT5 (Y964), PRLR, with β-actin and p150 levels. The western blots shown are representative of three biological replicates. (E) Ratio of plasma membrane localized receptor compared to intracellular receptor, analyzed by line-scans as in B. Each point represents an individual cell, and data are based on three independent biological experiments per condition. Graphs show means with SEM error bars. *p<0.05, **p<0.01, and ****p<0.0001. One-way ANOVA compared to WT, unpaired. (F) Quantification of western blot results shown as pSTAT5 normalized to total STAT5, relative to the WT condition. Graphs show means with SEM error bars. *p<0.05 and **p<0.01. One-way ANOVA compared to WT, unpaired.
Figure 5—figure supplement 1.
Figure 5—figure supplement 1.. Chemical shift perturbations of intracellular domain (ICD)K235-G313 of (A) WT (B) K4E, (C) GAG, (D) K4G, and (E) ϕ4G variants.
Figure 5—figure supplement 2.
Figure 5—figure supplement 2.. 15N R2 relaxation rates of intracellular domain (ICD)K235-G313 of WT (gray bars), K4G (blue dots) and ϕ4G (red squares) variants.
Stars indicate signals excluded from the analysis either because it is a proline, signals are overlapping or a poor exponential fit.
Figure 6.
Figure 6.. Model of how co-structure formation between JAK2, prolactin receptor (PRLR), and PI4(4,5)P2 may contribute to signaling fidelity.
The suggested states in signaling would be (A) the inactive state of the co-structure exemplified by the Flat orientation. (B) The hormone bound state expemplified by the co-structure in the Y orientation. (C) Phosphorylation of PIP(4,5)P2 to PI(3,4,5)P3 for which the PRLR has no affinity may lead to downregulation and/or termination of signaling. The color scheme of the proteins is identical to Figure 4.

Update of

  • doi: 10.1101/2022.11.23.517650

Similar articles

Cited by

References

    1. Abraham MJ, Murtola T, Schulz R, Páll S, Smith JC, Hess B, Lindahl E. GROMACS: high performance molecular Simulations through multi-level parallelism from laptops to supercomputers. SoftwareX. 2015;1–2:19–25. doi: 10.1016/j.softx.2015.06.001. - DOI
    1. Aksamitiene E, Achanta S, Kolch W, Kholodenko BN, Hoek JB, Kiyatkin A. Prolactin-stimulated activation of Erk1 / 2 mitogen-activated protein Kinases is controlled by Pi3-kinase / RAC / PAK signaling pathway in breast cancer cells. Cellular Signalling. 2011;23:1794–1805. doi: 10.1016/j.cellsig.2011.06.014. - DOI - PMC - PubMed
    1. Ashkenazy H, Abadi S, Martz E, Chay O, Mayrose I, Pupko T, Ben-Tal N. Consurf 2016: an improved methodology to estimate and visualize evolutionary conservation in macromolecules. Nucleic Acids Research. 2016;44:W344–W350. doi: 10.1093/nar/gkw408. - DOI - PMC - PubMed
    1. Bachelot A, Binart N. Reproductive role of prolactin. Reproduction. 2007;133:361–369. doi: 10.1530/REP-06-0299. - DOI - PubMed
    1. Basak S, Saikia N, Kwun D, Choi UB, Ding F, Bowen ME. Different forms of disorder in NMDA-sensitive glutamate receptor cytoplasmic domains are associated with differences in condensate formation. Biomolecules. 2022;13:4. doi: 10.3390/biom13010004. - DOI - PMC - PubMed

Publication types