. 2023 May 17;30(5):5116-5134.
doi: 10.3390/curroncol30050387.

The Effect of Lung Resection for NSCLC on Circulating Immune Cells: A Pilot Study

Affiliations

The Effect of Lung Resection for NSCLC on Circulating Immune Cells: A Pilot Study

Joseph D Phillips et al. Curr Oncol. .

Abstract

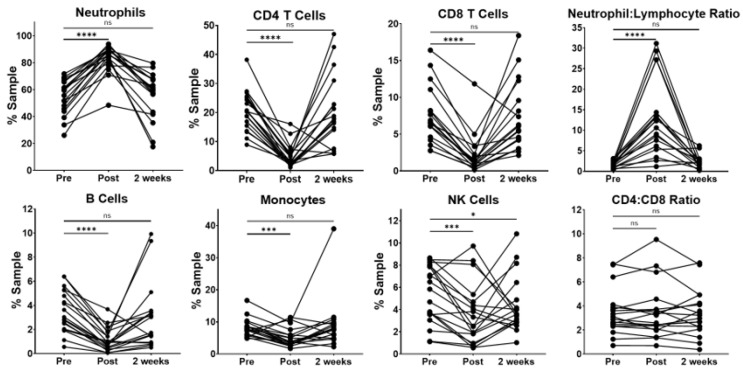
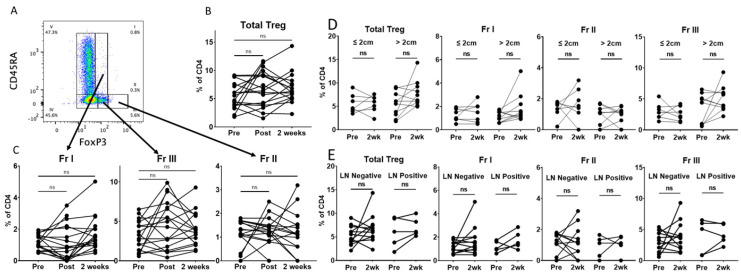
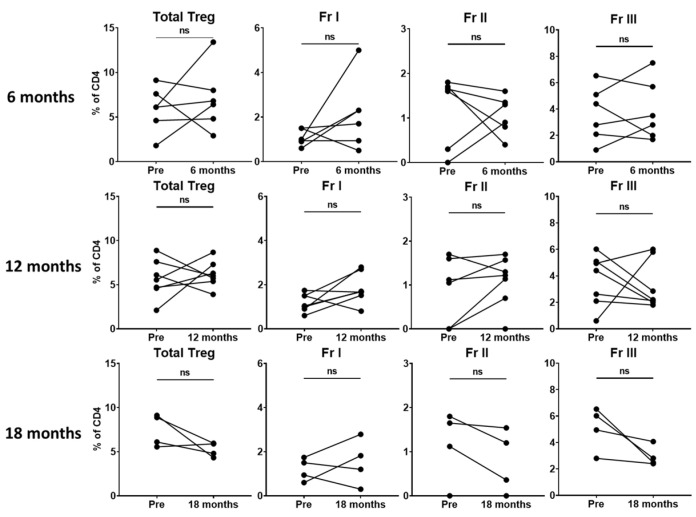
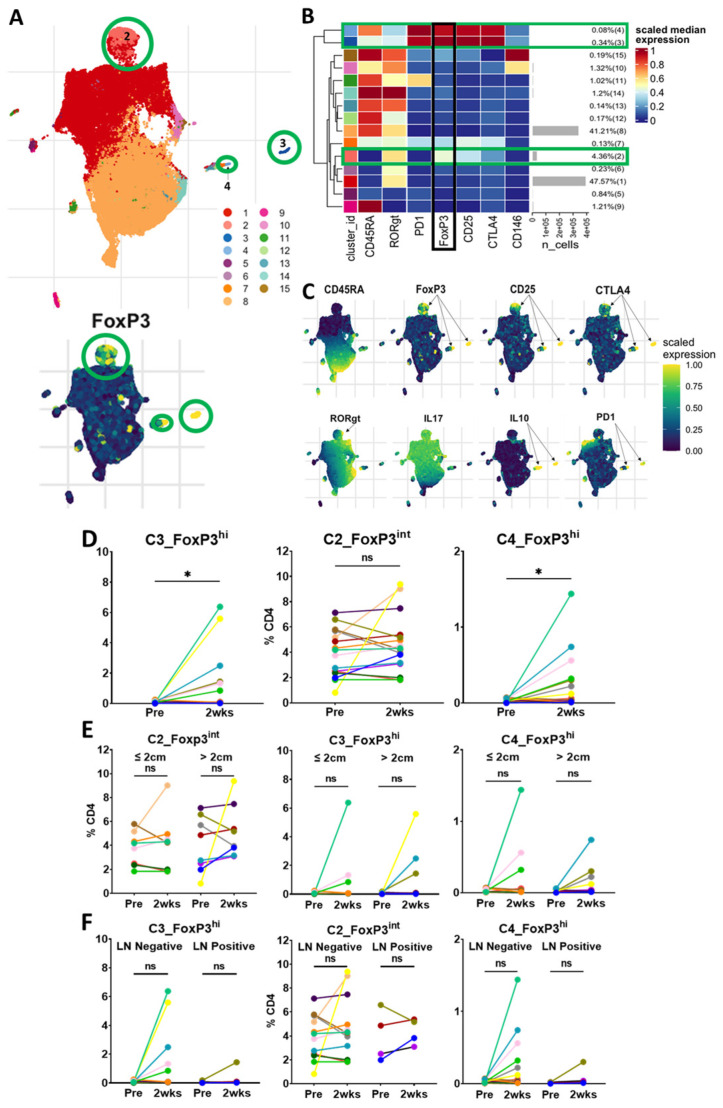
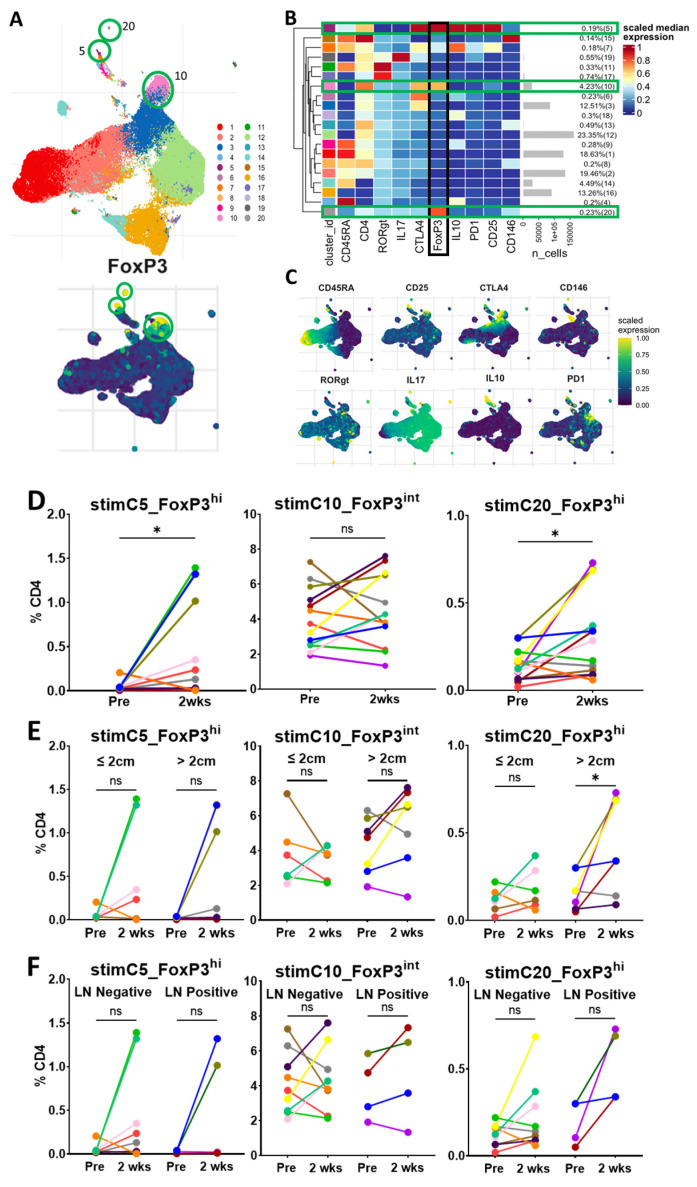
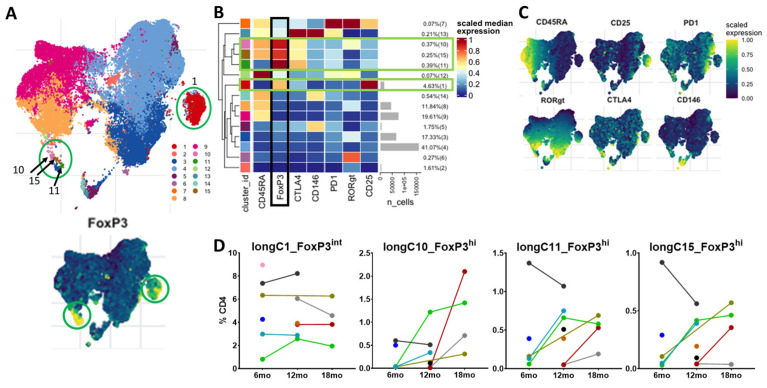
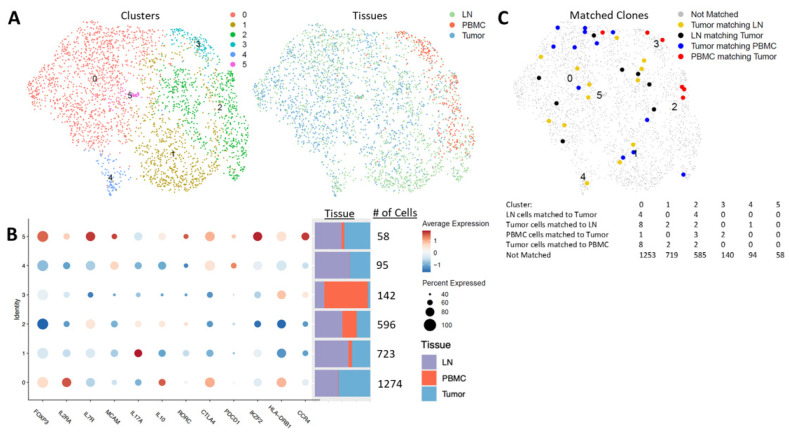
This pilot study sought to evaluate the circulating levels of immune cells, particularly regulatory T-cell (Treg) subsets, before and after lung resection for non-small cell lung cancer. Twenty-five patients consented and had specimens collected. Initially, peripheral blood of 21 patients was collected for circulating immune cell studies. Two of these patients were excluded due to technical issues, leaving 19 patients for the analyses of circulating immune cells. Standard gating and high-dimensional unsupervised clustering flow cytometry analyses were performed. The blood, tumors and lymph nodes were analyzed via single-cell RNA and TCR sequencing for Treg analyses in a total of five patients (including four additional patients from the initial 21 patients). Standard gating flow cytometry revealed a transient increase in neutrophils immediately following surgery, with a variable neutrophil-lymphocyte ratio and a stable CD4-CD8 ratio. Unexpectedly, the total Treg and Treg subsets did not change with surgery with standard gating in short- or long-term follow-up. Similarly, unsupervised clustering of Tregs revealed a dominant cluster that was stable perioperatively and long-term. Two small FoxP3hi clusters slightly increased following surgery. In the longer-term follow-up, these small FoxP3hi Treg clusters were not identified, indicating that they were likely a response to surgery. Single-cell sequencing demonstrated six CD4+FoxP3+ clusters among the blood, tumors and lymph nodes. These clusters had a variable expression of FoxP3, and several were mainly, or only, present in tumor and lymph node tissue. As such, serial monitoring of circulating Tregs may be informative, but not completely reflective of the Tregs present in the tumor microenvironment.

Keywords: Treg subsets; circulating immune cells; lung resection; non-small cell lung cancer; regulatory T cells; single-cell sequencing.


Conflict of interest statement

The authors declare no conflict of interest that may be perceived as inappropriately influencing the representation or interpretation of the reported research results. The funders had no role in the design of the study; in the collection, analyses, or interpretation of data; in the writing of the manuscript; or in the decision to publish the results. JDP receives research support from KSQ Therapeutics, Inc. that is not related to the published work.

Figures

Figure 1
Figure 1
Lung resection results in the transient increase in neutrophils, but a stable CD4–CD8 ratio. Matched dot plots of each cell type, the neutrophil-to-lymphocyte ratio (NLR) and CD4-to-CD8 ratio at three time points, from prior to surgery (Pre, n = 19), immediately following surgery (Post, n = 19) and 2 weeks after surgery (2 weeks, n = 18). Dots connected by lines indicate individual patients. There is a statistically significant increase in the percentage of neutrophils immediately following surgery and a corresponding decrease in all other cells types. These frequencies return to baseline for all cell types 2 weeks after surgery, except for a slight continued decrease in NK cells (mean 5.4% vs. 4.4%, p < 0.05). There is a transient, variable increase in the NLR in patients immediately after surgery, with no significant change by 2 weeks. The CD4–CD8 T cell ratio remained relatively stable in patients across the three time points. Significance determined via paired Student’s t tests. ns: non-significant, * p < 0.05, *** p < 0.001, **** p < 0.0001.
Figure 2
Figure 2
Circulating Treg proportions are stable within 2 weeks of lung tumor resection. (A). Representative manual gating strategy for peripheral blood CD45+CD3+CD4+ cells with the Treg panel to identify the Treg subsets, as described by Miyara et al., 2009 [20]. (B). Matched dot plots demonstrating no significant difference immediately post-surgery (n = 18) or at 2 weeks (n = 17) for total Tregs. (C). Matched dot plots demonstrating no significant difference in the Treg subsets post-operatively or 2 weeks after surgery. (D). Matched dot plots demonstrating no significant difference in total Tregs or the Treg subsets 2 weeks after surgery when stratified by tumor ≤2 cm (n = 7) vs. >2 cm (n = 10). (E). Matched dot plots demonstrating no significant difference in total Tregs or the Treg subgroups 2 weeks after surgery when stratified by LN-negative (n = 12) and LN-positive (n = 5) tumors. Dots connected by lines indicate individual patients. Fr I (resting Treg): CD45RA+FoxP3+CD25+, Fr II (activated Treg): CD45RA-FoxP3++CD25+, Fr III (mixture of Treg and non-Treg): CD45RA-FoxP3+CD25+. Significance determined via paired Student’s t tests. ns: non-significant.
Figure 3
Figure 3
Circulating Treg proportions do not significantly change long-term following surgery. Matched dot plots demonstrating no significant differences in total Tregs or the three Treg fractions at 6 months (n = 6), 12 months (n = 7) or 18 months (n = 4) in patients with available data. Dots connected by lines indicate individual patients. Fr I (resting Treg): CD45RA+FoxP3+CD25+, Fr II (activated Treg): CD45RA-FoxP3++CD25+, Fr III (mixture of Treg and non-Treg): CD45RA-FoxP3+CD25+. Significance determined via paired Student’s t tests. ns: non-significant. Data are from 10 individual patients.
Figure 4
Figure 4
Unsupervised clustering of unstimulated cells reveals three CD4+ Foxp3-expressing clusters. (A). UMAPs of the unsupervised clustering of patients of concatenated files of unstimulated CD4+ cells at the pre-resection, post-resection and 2-week time points, n = 19 individual patients. In the upper UMAP, each cluster has a corresponding number and color. The lower UMAP demonstrates the relative expression of FoxP3. Green circles highlight the three Treg clusters (2, 3 and 4). (B). Heatmap demonstrating the relative scaled median marker expression, cell number and percentage of the total sample of each of the fifteen CD45+CD4+ clusters. Clusters 2, 3 and 4 have expression of FoxP3, CD25 and CTLA-4, indicating that they are Tregs. Green bars highlight the three Treg clusters. The black bar highlights the relative expression of FoxP3. (C). UMAPs demonstrating the scaled, relative expression of additional markers used to generate the fifteen CD4+ clusters. Black arrows highlight the Treg clusters with the expression of the separate markers used. (D). Matched dot plots (n = 16 patients) demonstrating no significant change in the predominant cluster, C2_FoxP3int, with a significant increase in the two small FoxP3hi clusters (C3_FoxP3hi and C4_FoxP3hi), two weeks after surgery. (E). Matched dot plots demonstrating no significant change in the three unsupervised Treg clusters when stratified by tumor size at two weeks after surgery (tumor ≤ 2 cm, n = 8; tumor > 2 cm, n = 8). (F). Matched dot plots demonstrating no significant change in the three unsupervised Treg clusters when stratified by lymph node status at two weeks after surgery (LN negative, n = 12; LN positive, n = 4). Dots connected by lines indicate individual patients, each color is an individual patient. Significance determined via paired Student’s t tests. ns: non-significant, * p < 0.05. LN: lymph node.
Figure 5
Figure 5
Unsupervised clustering of stimulated cells reveals three CD4+ Foxp3-expressing clusters. (A). UMAPs of unsupervised clustering of patients of concatenated files of CD4+-stimulated cells with PMA/Ionomycin at the pre-resection, post-resection and 2-week time points, n = 19 individual patients. In the upper UMAP, each cluster has a corresponding number and color. The lower UMAP demonstrates the relative expression of FoxP3. Green circles highlight the three Treg clusters (5, 10 and 20). (B). Heatmap demonstrating the relative scaled median marker expression, cell numbers and percentage of the total concatenated sample of each of the 20 CD4+ clusters of stimulated cells. Clusters 5, 10 and 20 have expression of FoxP3, CD25 and CTLA-4 indicating that they are Tregs. Green bars highlight the three Treg clusters. The black bar highlights the relative expression of FoxP3. (C). UMAPs demonstrating the scaled, relative expression of markers used to generate the 20 clusters. (D). Matched dot plots (n = 13) demonstrating a significant increase in clusters stimC5_FoxP3hi and stimC20_FoxP3hi, with no significant change in stimC10_FoxP3int at 2 weeks after surgery. (E). Matched dot plots demonstrating no significant change in clusters stimC5_FoxP3hi and stimC10_FoxP3int, but an increase in larger tumors in stimC20_FoxP3hi when stratified by tumor size at 2 weeks after surgery (tumor ≤ 2 cm, n = 6; tumor > 2 cm, n = 7). (F) Matched dot plots demonstrating no significant change in the three stimulated Treg clusters when stratified by lymph node status at 2 weeks after surgery (LN-negative, n = 9; LN-positive, n = 4). Dots connected by lines indicate individual patients, each color is an individual patient. Significance determined via paired Student’s t tests. ns: non-significant, * p < 0.05. LN: lymph node.
Figure 6
Figure 6
Unsupervised clustering of unstimulated cells from long-term time points reveals a predominant CD4+ FoxP3int-expressing cluster and three small FoxP3hi clusters. (A). UMAPs of the unsupervised clustering of the concatenated files of CD45+CD3+CD4+ cells at the 6-, 12- and 18-month time points following surgery in 10 individual patients. In the upper UMAP, each cluster has a corresponding number and color. The lower UMAP demonstrates the relative expression of FoxP3. Green circles highlight the four Treg clusters (longC1_FoxP3int, longC10_FoxP3hi, longC11_FoxP3hi and longC15_FoxP3hi). (B). Heatmap demonstrating the relative scaled median marker expression, cell numbers and percentages of the total sample of each of the fifteen CD45+CD3+CD4+ clusters. Clusters longC1_FoxP3int, longC10_FoxP3hi, longC11_FoxP3hi, and longC15_FoxP3hi have the expression of FoxP3, CD25 and CTLA-4, indicating that they are Tregs. Green bars highlight the four Treg clusters. The black bar highlights the relative expression of FoxP3. (C). UMAPs demonstrating the scaled, relative expression of markers used to generate the 15 clusters. (D). Matched dot plots of the four Treg clusters at the long-term timepoints (6 months n = 6, 12 months n = 6, 18 months n = 4), demonstrating variability of the clusters among patients. Dots connected by lines indicate individual patients, each color is an individual patient. The small number of patients at each time point limits statistical analysis.
Figure 7
Figure 7
Paired single-cell RNA/TCR sequence clustering reveals six CD4+ Foxp3-expressing clusters within the blood, tumors and lymph nodes. (A). UMAPs of unsupervised clustering of patients (n = 5) from single-cell RNA sequencing analysis from combined peripheral blood (PBMCs), tumors and lymph nodes (LNs) of CD4+FoxP3+ cells. The left UMAP demonstrates the six clusters, with each cluster having a corresponding number and color. The right UMAP highlights the tissues that make up each cluster. (B). Dot plots showing the relative gene expression of the six CD4+FoxP3+ clusters, the cell number in each cluster and the proportion of cells isolated from lymph nodes (LNs), peripheral blood (PBMC) and tumors comprising each cluster. Circle size corresponds to the percentage of cells in each cluster and the color indicates the relative gene expression (high = red, low = blue). (C). UMAP highlighting the numbers of matched clones in each cluster by single-cell TCR sequencing. Colored dots indicate a clonal match corresponding to the associated key, and grey dots indicate the clones that are not matched across tissue types. The table denotes the exact number of matched clones by tissue in each cluster.

References

    1. World Health Organisation Cancer. [(accessed on 18 May 2021)]. Available online: https://www.who.int/news-room/fact-sheets/detail/cancer.
    1. Doroshow D.B., Sanmamed M.F., Hastings K., Politi K., Rimm D.L., Chen L., Melero I., Schalper K.A., Herbst R.S. Immunotherapy in Non–Small Cell Lung Cancer: Facts and Hopes. Clin. Cancer Res. 2019;25:4592–4602. doi: 10.1158/1078-0432.CCR-18-1538. - DOI - PMC - PubMed
    1. Pelster M.S., Amaria R.N. Combined targeted therapy and immunotherapy in melanoma: A review of the impact on the tumor microenvironment and outcomes of early clinical trials. Ther. Adv. Med. Oncol. 2019;11:1758835919830826. doi: 10.1177/1758835919830826. - DOI - PMC - PubMed
    1. Riemann D., Cwikowski M., Turzer S., Giese T., Grallert M., Schütte W., Seliger B. Blood immune cell biomarkers in lung cancer. Clin. Exp. Immunol. 2019;195:179–189. doi: 10.1111/cei.13219. - DOI - PMC - PubMed
    1. Gu X.-B., Tian T., Tian X.-J., Zhang X.-J. Prognostic significance of neutrophil-to-lymphocyte ratio in non-small cell lung cancer: A meta-analysis. Sci. Rep. 2015;5:12493. doi: 10.1038/srep12493. - DOI - PMC - PubMed

Publication types

Substances