Review
. 2023 May 16;13(5):551.
doi: 10.3390/bios13050551.

Microenvironments Matter: Advances in Brain-on-Chip

Affiliations
Review

Microenvironments Matter: Advances in Brain-on-Chip

Gulden Akcay et al. Biosensors (Basel). .

Abstract

To highlight the particular needs with respect to modeling the unique and complex organization of the human brain structure, we reviewed the state-of-the-art in devising brain models with engineered instructive microenvironments. To acquire a better perspective on the brain's working mechanisms, we first summarize the importance of regional stiffness gradients in brain tissue, varying per layer and the cellular diversities of the layers. Through this, one can acquire an understanding of the essential parameters in emulating the brain in vitro. In addition to the brain's organizational architecture, we addressed also how the mechanical properties have an impact on neuronal cell responses. In this respect, advanced in vitro platforms emerged and profoundly changed the methods of brain modeling efforts from the past, mainly focusing on animal or cell line research. The main challenges in imitating features of the brain in a dish are with regard to composition and functionality. In neurobiological research, there are now methods that aim to cope with such challenges by the self-assembly of human-derived pluripotent stem cells (hPSCs), i.e., brainoids. Alternatively, these brainoids can be used stand-alone or in conjunction with Brain-on-Chip (BoC) platform technology, 3D-printed gels, and other types of engineered guidance features. Currently, advanced in vitro methods have made a giant leap forward regarding cost-effectiveness, ease-of-use, and availability. We bring these recent developments together into one review. We believe our conclusions will give a novel perspective towards advancing instructive microenvironments for BoCs and the understanding of the brain's cellular functions either in modeling healthy or diseased states of the brain.

Keywords: Brain-on-Chip; instructive microenvironment; microfabrication.


Conflict of interest statement

The authors declare no conflict of interest.

Figures

Figure 6
Figure 6
(A) A schematic representation demonstrates cell movement on the substrate in three steps. Once the cell extends a projection, the process of cell movement actin starts and actin bundles in the cell membrane begin to reconstruct through the direction of the motion. The cell moves forward by reorganizing the actin network at the leading-edge. Thus, the cell attaches its leading-edge to the substrate followed by detaching the cell body and rear. Traction forces eventually are produced by the actin-myosin network action and the entire cell body moves forward. Reprinted with permission from [76] Copyright 2007, Int. J. Biol. Sci. (B) A basic schematic illustration of the growth cone with top view. Reprinted with permission from [82] Copyright 2007, Elsevier. (C) Axons can reach incredibly long distances, more than 1.5 m from the spinal cord to the toe for instance. Most of the axons terminate with a few thousand synapses connections and as a result of that perfectly entangled connectivity (1015 synapses). The immunofluorescence micrograph displays a neuron touching another axon with a filopodium at the tip of its growth cone. (green: NCAM1; red: tubulin; blue: nuclear dye). Reprinted from permission from [85] Copyright 2012, Elsevier Ireland Ltd.
Figure 1
Figure 1
(A) Illustration of proliferative zones during neurogenesis and the formation of minicolumns and cortical columns in the prenatal mammalian cerebral cortex. Reprinted with permission from [40] Copyright 2020, Elsevier. (B) Schematic of the whole human cortical sheet that has minicolumns (Ø∼50 µm). Each macrocolumn has millions of minicolumns, each one being composed of around 100 neurons. Minicolumns are arranged again in the six layers already depicted in (A), with distinct types of neurons and connections per layer. Reprinted from [41] with permission from Matthieu Thiboust.
Figure 2
Figure 2
Human cerebral cortex development. The laminated organized cortex that forms six layers (layer I–VI) possesses diverse subtypes of neurons with characteristic functions. Throughout the development of the human cortex, neurons are produced from neural stem cells and progenitors in the ventricular zone (VZ) and the subventricular zone (SVZ). The inner subventricular zone (ISVZ) and outer subventricular zone (OSVZ) is developed by diving into the subventricular zone. While deep layer neurons are forged at early stage, newborn neurons form upper layers such as the intermediate zone (IZ) and the cortical plate (CP). Reproduced with permission from [44] Copyright 2014, Society for Neuroscience.
Figure 3
Figure 3
Different human tissues and their stiffness. Brain tissue is one of the softest tissues in the human body. Reprinted with permission from [46] Copyright 2019, Springer Nature.
Figure 4
Figure 4
Brain has various regional stiffness. (A) Schematic diagram displays stiffness measurements of the healthy adult mammalian brain (human, porcine, rabbit, and rodent, which are illustrated by black silhouette figures) in different regions. Color-coded arrows pointing to the method used to measure brain stiffness in that region. Red, microindentation methods such as atomic force microscopy; green, macroindentation methods; orange, shear tests; blue, magnetic resonance elastography; and yellow, ultrasound elastography. Reprinted with permission from [54] Copyright 2020, European Journal of Neuroscience. (B) Stiffness map of the rat cerebral cortex, obtained using atomic force microscopy (AFM). Reprinted with permission from [54] Copyright 2020, European Journal of Neuroscience. (C) Figure depicts viscoelasticity maps (E′ = storage modulus; E″ = loss modulus) of the hippocampus of mouse brain slices in Pa over the dentate gyrus (DG) and cornus ammonis (CA3) field. Reprinted with permission from [53] Copyright 2018, Scientific Reports.
Figure 5
Figure 5
Overview of mechanical cues as instructions in engineered microenvironments.
Figure 7
Figure 7
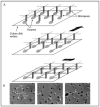
(A) Schematic of the neuron connection process with an array of micro-posts. (B) Micrographs of embryonic chick neurons seeded. The micro-tool was moved at a constant speed (36 mm/h) to elicit neurites white downward arrows). Reproduced with permission from [89] Copyright 2003, Kluwer Academic Publishers.
Figure 8
Figure 8
(A) Illustration of indention of neuron via AFM and combining with confocal microscopy to monitor the response of the neuron. (B) Overlaid differential interference contrast (DIC) to visualize the morphology of the cell, and fluorescence microscopy images to monitor GCaMP6S (green) expressing cortical neurons during stimulation. (CF) Normalized fluorescence intensity heat maps display calcium (Ca2+) responses to mechanical indentation (C) of soma (D), axon (E), and dendrite (F). (C) The axon is marked by an asterisk. (green: GCaMP6S, red: anti–pan-neurofascin to stain axon). Scale bars: 10 μm. Reproduced with permission from [90] Copyright 2020, Proceedings of the National Academy of Sciences.
Figure 9
Figure 9
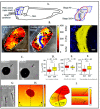
(A,B) The figure displays in vivo mechanical properties of the Xenopus brain. The area inside the white dashed lines indicates AFM-based stiffness map. Gray lines show immunohistochemistry image of optical track (OT) (cell nuclei (blue), OT (yellow)). (CF) Mechanosensitivity of RGC axons in vitro. (C) Arrows indicate axons. (D) The extension velocity of axons (vgrowth) is higher on stiff substrates (Mann-Whitney test; P = 9.32 × 10⁻⁶, z = 4.432) (E) Growth cones (GC) migrated remarkably faster on soft substrates than the stiff ones. (two-tailed t-test; P = 0.00867, t = 2.669) (F) Axon growth Is more directed on stiff substrates than on soft substrates. (Mann-Whitney test; P = 1.10 × 10⁻⁶, z = 4.873). (CF) (** p = 0.00867; *** p < 10−5). (GI) Time-lapse imaging of axonal growing on a stiffness gradient similarly in vivo data. Eye primordium cells are seeded on a similar stiffness gradient with in vivo. Reproduced with permission from [57] Copyright 2016, Springer Nature.
Figure 10
Figure 10
(A) Concept of stacked hydrogels cast on a microscope slide. (B) Schematic drawing of the SH-SY5Y cells sandwiched in between glass coverslip and hydrogel and confocal microscopy z-stack images from 0 to 60 µm. Neuronal migration into the third dimension. White arrowheads in subfigures (B) indicate neuronal outgrowths. (Green: Nucgreen-nuclei; Red: β-tubulin III-axon). Reproduced from [93] Copyright 2021, under the Creative Commons Attribution License.
Figure 11
Figure 11
Three-dimensional printed, layered brain-like structures by using peptide-modified gellan gum gel. (A) Schematic design by SolidWorks software. (BE) The printing process of each layer and each layer was performed with the same gel with different colors. (F) Confocal microscopy images, showing axonal extension into another layer on day 5. (G) White rectangle displays an enlarged image of (F). Reprinted with permission from [94] Copyright 2015, Biomaterials.
Figure 12
Figure 12
The 3D layered hydrogel system to investigate the migration of hiPSC-derived neural progenitor cells (NPCs). (A) Schematic depicts the dimensions of the two-layered hydrogels and the picture at the bottom displays bright-field image of two-layered hydrogels (Scale bar, 5 mm). (B) Young’s modulus of HAMA hydrogels measured by atomic force microscope (AFM) following varying UV exposure time. (C) Scanning electron microscopy (SEM) imaging of hydrogel (Scale bar, 10 μm). (D) Schematic of the two-layered hydrogel shows NPC migration toward NPCs, astrocytes, or neurons. (E) Fluorescence microscopy images of NPC migration induced by NPCs, astrocytes, or neurons for indicated times. Between red and green dashed lines depict the farthest migration distance (Scale bar, 200 μm). (F) Quantified data of maximum migration distance induced by NPCs, astrocytes, or neurons. Bars represent means; ** p < 0.01; n = 3. (G) Real-time fluorescence microscopy images showing NPC migration toward astrocytes in a time-dependent manner (Scale bar, 200 μm). (H) Fluorescence microscopy images of NPC migration induced by astrocytes for 1.5 d with Alexa647-labeled hydrogel to specify the top layer (Scale bar, 200 μm). Reproduced with permission from [96] Copyright 2016, Proceedings of the National Academy of Sciences.
Figure 13
Figure 13
Schematic diagram emphasizes topological features of the materials and their impact on cellular behavior in particular with an emphasis on nerve cell behavior. Reprinted with permission from [106]. Copyright 2021, Fang Liu et al., Stem Cells Int.
Figure 14
Figure 14
Neuronal growth on a surface with pillar organization. (AG) Images have been taken by SEM microscopy, which shows most axons (white arrowhead) and dendrites (black arrowhead). Pillars with pillar width (PW)/pillar gap (PG) (A) 2.0 μm/0.5 μm, (B) 0.5 μm/1.5 μm, (C) 2.0 μm/4.5 μm. (Scale bar = 20 μm). Growth cones (black arrows) on pillars (2.0 μm/1.5 μm) exhibited a narrow profile indicative of rapid growth (E). In contrast, growth cones (black arrows) on pillars (2.0 μm/4.5 μm) exhibited a broader profile with a few extending filopodia indicative of slower growth (F). Scale bar (E,F) = 10 μm. (G) 2.0 μm/1.5 μm, Scale bar (G) = 2 μm. Fluorescent microscopy images with pillar surface (2.0 μm/1.5 μm) by using MAP-2 (D) and βIII-tubulin (H) to identify axonal growth (white arrowhead) (Scale bar = 20 μm). Fluorescent image of orientation of dendrites and axons on varied pillar width and gap sizes. Red color indicates βIII-tubulin. The most significant orientation has shown the pillar surface with (PW/PG: 2.0 μm/1.5 μm) (I). In Panel II, the fluorescence image depicts the effect of surface topography on the orientation of dendrites and axons. The greatest effect is demonstrated on pillar gaps of 1.5 µm. Random growth is observed on smooth regions. Reprinted with permission from [107] Copyright 2004, J. Neural. Eng.
Figure 15
Figure 15
(A) Outgrowth alignment is quantified as 65% in 6 µm depth. (B) Schematic top view images of immunostained rat cortical astrocytes from 0 µm to 6 µm. (Green: GFAP). Reprinted with permission from [108] Copyright 2015, J. Vac. Sci. Technol.
Figure 16
Figure 16
(A) Schematic representation of 3D micro-patterned hydrogel model. (B) Immunostained image of 8 days cultured neuron distribution in micro-patterned hydrogel. Reproduced with permission from [111] Copyright 2021, IEEE.
Figure 17
Figure 17
Schematic representation of 3D printing method of the spinal cord tissue. (A) Spinal cord illustration. (B) Overview of 3D printed tissue with cells. (C) Comparison of the rat spinal cord tissue and 3D printed scaffold tissue. (D) Immunotstained image of 3D printed scaffold with sNPCs and OPCs on day 4. (E) A 7-day culture immunostained image with zoom in. (Green: β3III-tubulin, axonal projections; Red: mCherry, OPCs marker). Reproduced with permission from [112] Copyright 2018, Advanced Functional Materials.
Figure 18
Figure 18
(A) Schematic of a microfluidic device that holds two separate neuron populations, microgrooves connecting two compartments. (B) Immunostained image displays synapse formations in the microgrooves. Green color expresses green fluorescent protein (GFP)-labeled neurons to visualize dentrites and red color shows red fluorescent protein (RFP)-labeled neurons to illustrate axons. Scale bar 150 μm. (C) Zoomed image of (B) demonstrating GFP-labeled dendrites penetrating to the microgrooves (top) and RFP-labeled axons (middle) expanding through the microgrooves around 900 μm. The merged image (bottom) shows connection between axons and dentrites. Scale bars = 50 μm. Reproduced with permission from [113] Copyright 2010, Elsevier Inc. All rights reserved.
Figure 19
Figure 19
(A) Schematic design of brain microenvironment in vivo. (B) Chip concept displaying brainoid formation by embedding hiPSCs in Matrigel with fluid perfusion. (C) Neurogenesis of brain organoids on chip and Petri dish by immunohistochemical staining on day 33. (Green: TUJ1; Red: SOX2; Red: CD133; Staining is indicated by white arrows. Scale bars: 50 um). Reproduced with permission from [127] Copyright 2018, Royal Society of Chemistry.
Figure 20
Figure 20
(A) Schematic representation of BBB chip. (B) Timeline of cell culturing on the BBB chips. (C,D) Immunostaining images of endothelial cell (EC) monolayer under dynamic and static conditions (Green: ZO-1 (tight-junction protein); Red: VE-CAD (adherent-junction protein); Blue: Hoechst). (E,G) Human pericyte (HP) cell culture on the opposite side of the membrane in respect of the endothelial cell layer. (Yellow: α-SMA (human pericytes); Blue: Hoechst). (F) Astrocyte in a hydrogel, displaying star-shaped morphology in 3D (Yellow: GFAP; Blue: Hoechst). Reproduced with permission from [133] Copyright 2020, Fluids and Barriers of the CNS.
Figure 21
Figure 21
(A) Visualization of the neuronal outgrowth in the scaffold by using confocal microscopy z-stacks. (a) Red: neurite growing along the microchannels. (bg) Dashed lines display cross-sections of the neurite in the channel. (B) Demonstration of the patch clamp procedure. (Blue: pipette; Green: cell). (C) The measurements of the action potential that are evoked by electrical current injection. Reproduced with permission from [134] Copyright 2020, ACS Nano.
Figure 22
Figure 22
(A) Schematic representation of the brain organoid with a combination of 3D decellularized human brain-derived extracellular matrix (BEM) hydrogel culture and the microfluidic device. (B) Cerebral organoid fabrication protocol timeline. (C) Schematic of the microfluidic device for the brain organoid. (D) Immunostaining images for BEM-plate and BEM-device organoids (Green: Ki67 (proliferation marker); Red: Nestin (progenitor marker); Blue: Dapi, scale bars = 50 μm). (E) Quantification analyses of markers, Ki67+ and Nestin+ cells in the BEM-plate and BEM-device organoids. Statistical differences between the groups are determined by unpaired two-tailed t-test (** p < 0.01, *** p < 0.001 versus BEM-plate group). Reproduced with permission from [136] Copyright 2021, Nature Communications.

Similar articles

Cited by

References

    1. LeDoux J.E., Michel M., Lau H. A little history goes a long way toward understanding why we study consciousness the way we do today. Proc. Natl. Acad. Sci. USA. 2020;117:6976–6984. doi: 10.1073/pnas.1921623117. - DOI - PMC - PubMed
    1. Shi Y., Kirwan P., Livesey F.J. Directed differentiation of human pluripotent stem cells to cerebral cortex neurons and neural networks. Nat. Protoc. 2012;7:1836–1846. doi: 10.1038/nprot.2012.116. - DOI - PubMed
    1. Lancaster M.A., Renner M., Martin C.A., Wenzel D., Bicknell L.S., Hurles M.E., Homfray T., Penninger J.M., Jackson A.P., Knoblich J.A. Cerebral organoids model human brain development and microcephaly. Nature. 2013;501:373–379. doi: 10.1038/nature12517. - DOI - PMC - PubMed
    1. Kelava I., Lancaster M.A. Stem Cell Models of Human Brain Development. Cell Stem Cell. 2016;18:736–748. doi: 10.1016/j.stem.2016.05.022. - DOI - PubMed
    1. Kelava I., Lancaster M.A. Dishing out mini-brains: Current progress and future prospects in brain organoid research. Dev. Biol. 2016;420:199–209. doi: 10.1016/j.ydbio.2016.06.037. - DOI - PMC - PubMed

LinkOut - more resources