

Differences in Long-Term Heart Rate Variability between Subjects with and without Metabolic Syndrome: A Systematic Review and Meta-Analysis
- PMID: 37233170
- PMCID: PMC10218942
- DOI: 10.3390/jcdd10050203
Differences in Long-Term Heart Rate Variability between Subjects with and without Metabolic Syndrome: A Systematic Review and Meta-Analysis
Abstract
Background: Our aim was to determine the impact that metabolic syndrome (MS) produces in long-term heart rate variability (HRV), quantitatively synthesizing the results of published studies to characterize the cardiac autonomic dysfunction in MS.
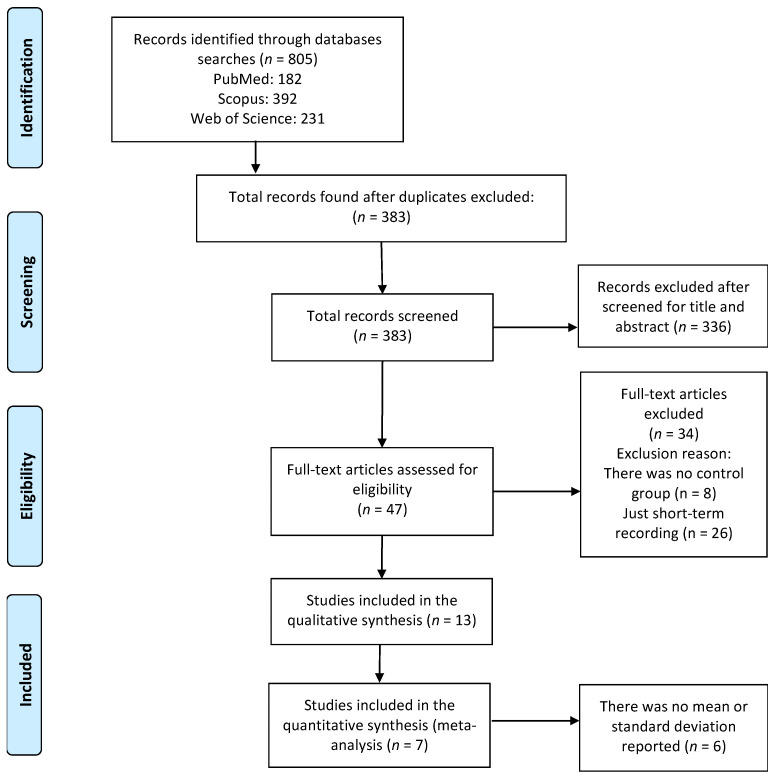
Methods: We searched electronic databases for original research works with long-term HRV recordings (24 h) that compared people with MS (MS+) versus healthy people as a control group (MS-). This systematic review and meta-analysis (MA) was performed according to PRISMA guidelines and registered at PROSPERO (CRD42022358975).
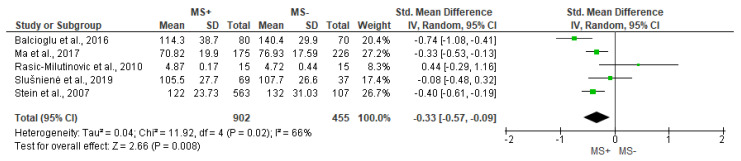
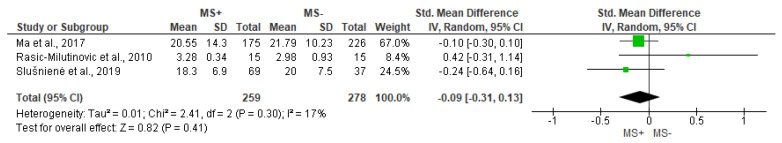
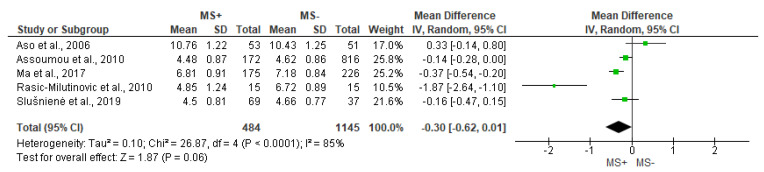
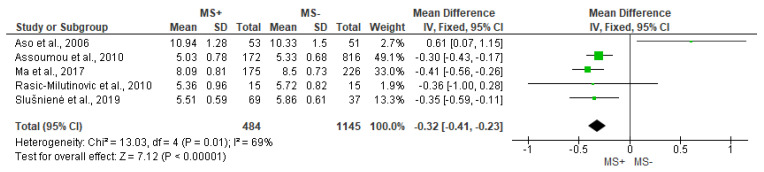
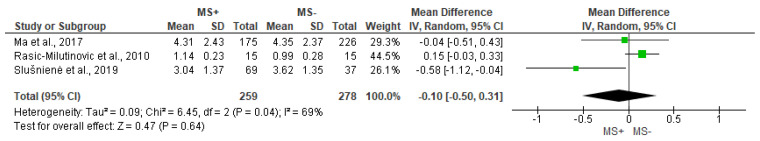
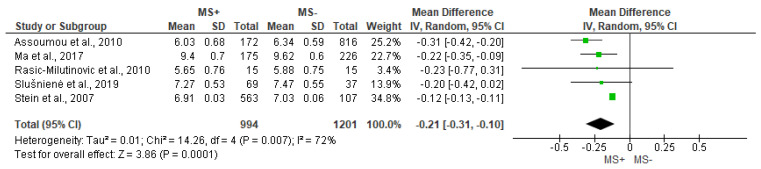
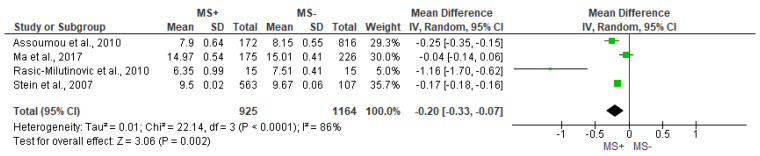
Results: A total of 13 articles were included in the qualitative synthesis, and 7 of them met the required criteria to be included in the MA. SDNN (-0.33 [-0.57, 0.09], p = 0.008), LF (-0.32 [-0.41, -0.23], p < 0.00001), VLF (-0.21 [-0.31, -0.10], p = 0.0001) and TP (-0.20 [-0.33, -0.07], p = 0.002) decreased in patients with MS. The rMSSD (p = 0.41), HF (p = 0.06) and LF/HF ratio (p = 0.64) were not modified.
Conclusions: In long-term recordings (24 h), SDNN, LF, VLF and TP were consistently decreased in patients with MS. Other parameters that could be included in the quantitative analysis were not modified in MS+ patients (rMSSD, HF, ratio LF/HF). Regarding non-linear analyses, the results are not conclusive due to the low number of datasets found, which prevented us from conducting an MA.
Keywords: long-term heart rate variability; meta-analysis; metabolic syndrome.
Conflict of interest statement
The authors declare no conflict of interest.
Figures
Similar articles
-
Short-Term Heart Rate Variability in Metabolic Syndrome: A Systematic Review and Meta-Analysis.J Clin Med. 2023 Sep 19;12(18):6051. doi: 10.3390/jcm12186051. J Clin Med. 2023. PMID: 37762990 Free PMC article. Review.
-
Cardiac Autonomic Dysfunction Is Associated With Risk of Diabetic Kidney Disease Progression in Type 2 Diabetes Mellitus.Front Endocrinol (Lausanne). 2022 Jul 1;13:900465. doi: 10.3389/fendo.2022.900465. eCollection 2022. Front Endocrinol (Lausanne). 2022. PMID: 35846280 Free PMC article.
-
Standardized tests of heart rate variability for autonomic function tests in healthy Koreans.Int J Neurosci. 2007 Dec;117(12):1707-17. doi: 10.1080/00207450601050097. Int J Neurosci. 2007. PMID: 17987472
-
Heart rate and heart rate variability comparison between postural orthostatic tachycardia syndrome versus healthy participants; a systematic review and meta-analysis.BMC Cardiovasc Disord. 2019 Dec 30;19(1):320. doi: 10.1186/s12872-019-01298-y. BMC Cardiovasc Disord. 2019. PMID: 31888497 Free PMC article.
-
Effect of exercise training on heart rate variability in type 2 diabetes mellitus patients: A systematic review and meta-analysis.PLoS One. 2021 May 17;16(5):e0251863. doi: 10.1371/journal.pone.0251863. eCollection 2021. PLoS One. 2021. PMID: 33999947 Free PMC article.
Cited by
-
Spectral Power Distribution of Heart Rate Variability in Contiguous Short-Term Intervals.Cureus. 2024 Aug 19;16(8):e67221. doi: 10.7759/cureus.67221. eCollection 2024 Aug. Cureus. 2024. PMID: 39295664 Free PMC article.
-
Utility of nonlinear analysis of heart rate variability in early detection of metabolic syndrome.Front Physiol. 2025 Jun 24;16:1597314. doi: 10.3389/fphys.2025.1597314. eCollection 2025. Front Physiol. 2025. PMID: 40630388 Free PMC article.
-
The cAMP/PKA signaling pathway conditions cardiac performance in experimental animals with metabolic syndrome.J Mol Cell Cardiol. 2024 Nov;196:35-51. doi: 10.1016/j.yjmcc.2024.09.002. Epub 2024 Sep 7. J Mol Cell Cardiol. 2024. PMID: 39251059
-
Gender-specific impact of stress and adiposity on autonomic stress modulation in teachers.Front Psychol. 2025 May 1;16:1522686. doi: 10.3389/fpsyg.2025.1522686. eCollection 2025. Front Psychol. 2025. PMID: 40376486 Free PMC article.
-
Gender differences in autonomic and psychological stress responses among educators: a heart rate variability and psychological assessment study.Front Psychol. 2024 Oct 8;15:1422709. doi: 10.3389/fpsyg.2024.1422709. eCollection 2024. Front Psychol. 2024. PMID: 39439753 Free PMC article.
References
-
- Grundy S.M., Brewer H.B., Cleeman J.I., Smith S.C., Lenfant C., American Heart Association. National Heart, Lung, and Blood Institute Definition of metabolic syndrome: Report of the National Heart, Lung, and Blood Institute/American Heart Association conference on scientific issues related to definition. Circulation. 2004;109:433–438. doi: 10.1161/01.CIR.0000111245.75752.C6. - DOI - PubMed
-
- Sperling L.S., Mechanick J.I., Neeland I.J., Herrick C.J., Després J.P., Ndumele C.E., Vijayaraghavan K., Handelsman Y., Puckrein G.A., Araneta M.R.G., et al. The CardioMetabolic Health Alliance Working toward a New Care Model for the Metabolic Syndrome. J. Am. Coll. Cardiol. 2015;66:1050–1067. doi: 10.1016/j.jacc.2015.06.1328. - DOI - PubMed
-
- Jung Y., Kim J.-H., Shin A.-R., Song K.-B., Amano A., Choi Y.-H. Association of Adiposity with Periodontitis and Metabolic Syndrome: From the Third National Health and Nutrition Examination Survey of United States. Int. J. Environ. Res. Public Health. 2023;20:2533. doi: 10.3390/ijerph20032533. - DOI - PMC - PubMed
Publication types
Grants and funding
LinkOut - more resources
Full Text Sources
Research Materials
Miscellaneous
