. 2023 May 11;9(5):97.
doi: 10.3390/jimaging9050097.

Structural Features of the Fragments from Cast Iron Cauldrons of the Medieval Golden Horde: Neutron Tomography Data

Affiliations

Structural Features of the Fragments from Cast Iron Cauldrons of the Medieval Golden Horde: Neutron Tomography Data

Bulat Bakirov et al. J Imaging. .

Abstract

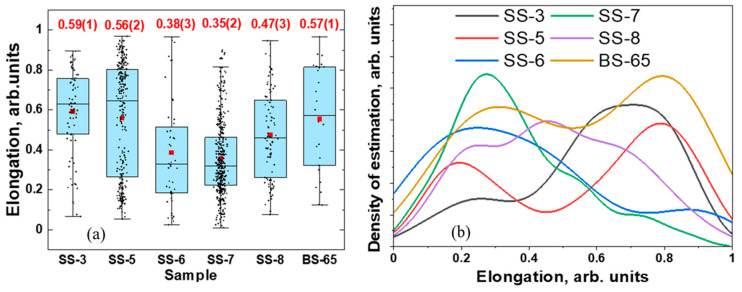
The spatial arrangement of the internal pores inside several fragments of ancient cast iron cauldrons related to the medieval Golden Horde period was studied using the neutron tomography method. The high neutron penetration into a cast iron material provides sufficient data for detailed analysis of the three-dimensional imaging data. The size, elongation, and orientation distributions of the observed internal pores were obtained. As discussed, the imaging and quantitative analytical data are considered structural markers for the location of cast iron foundries, as well as a feature of the medieval casting process.

Keywords: cast iron materials; cultural heritage; medieval Golden Horde; neutron tomography; porosity.


Conflict of interest statement

The authors declare no conflict of interest.

Figures

Figure 1
Figure 1
Photos showing the two sides of cast iron fragments of the cauldrons from the Bolgar settlement. A scale bar is presented.
Figure 2
Figure 2
Photos showing the two sides of cast iron fragments from the Selitrennoye settlement. A scale bar is presented.
Figure 3
Figure 3
(a) The reconstructed 3D model and example of its longitudinal slice for the fragment BS-25. The cast iron regions are labeled in blue, and the possible welding track material is green–blue. (b) The reconstructed 3D model and example of its longitudinal slice for the fragment BS-48. A scale bar is presented.
Figure 4
Figure 4
The reconstructed 3D model and some longitudinal and transverse slices of the iron cast fragment SS-8. The cast iron regions are labeled in green–blue color, and the corrosion surface layers are in red. A scale bar is presented.
Figure 5
Figure 5
The probability density function for the equivalent diameter distribution of the pores in the selected cast iron fragments.
Figure 6
Figure 6
(a) A box-view presentation showing the distribution of elongation parameters for selected cast iron fragments. The points are experimental data from the analysis of the 3D models, and the red dots are the mean value of the elongation parameters. These parameters are labeled at the top. The horizontal lines inside the boxes correspond to the median value of the elongation parameter. (b) The distribution of elongation of the pores in the cast iron fragments shown as the normal distribution approximation with Kernel Smooth mode.
Figure 7
Figure 7
Stereoplots showing the orientation of principal inertia axis Imin of separated pores inside the iron cast fragments SS-5 (a), SS-7 (b), BS-65 (c), and SS-8 (d). The upper hemisphere stereographic projection is shown. The density of point values is coded in the sidebar.
Figure 8
Figure 8
Stereoplots showing the inertia axis Imin orientation of small (a) and large pores (b) inside the iron cast fragment SS-6 with respect to the laboratory coordinate system in the tomography experiment. The density of point values is codified in the sidebar.
Figure 9
Figure 9
The reconstructed 3D model and some longitudinal slices of the cast iron fragments BS-65 (a) and SS-5 (b). The cast iron regions are labeled in green–blue color. The pores are presented as sharper images for convenience. The transparent 3D models with pores volumes are presented. The scale bar is shown.
Figure 10
Figure 10
The reconstructed 3D model and several longitudinal slices of the cast iron fragments BS-73, SS-3, and SS-6. The cast iron regions are labeled in green–blue color. The inclusions or contamination impurities are presented in red color. The scale is shown.

References

    1. Artioli G. Scientific Methods and Cultural Heritage: An Introduction to the Application of Materials Science to Archaeometry and Conservation Science. OUP Oxford; Oxford, UK: 2010.
    1. Park J.-S., Honeychurch W., Chunag A. Technologies and Complexities as Reflected in Small Cast Iron Fragments Recovered from Medieval Sites in Eastern Mongolia. Archaeol. Anthropol. Sci. 2020;12:75. doi: 10.1007/s12520-020-01030-4. - DOI
    1. Shaykhutdinova E., Khramchenkova R., Nabiullin N., Belyaev A., Yanbaev R., Sitdikov A. Interdisciplinary Research of Iron Casting Technologies in the Town of Juketau during the Golden Horde Period. ACTA IMEKO. 2017;6:87. doi: 10.21014/acta_imeko.v6i3.461. - DOI
    1. Shaykhutdinova E., Khramchenkova R., Vladimirovich B., Sitdikov A., Orazov D., Ilyasova A., Yanbaev R. The Chemical and Structural Peculiarities of the Kazan Khanate Cast-Iron Cookware in the 14th–15th Centuries. J. Comput. Theor. Nanosci. 2019;16:4534–4539. doi: 10.1166/jctn.2019.8349. - DOI
    1. Janssens K., van Grieken R. Non-Destructive Micro Analysis of Cultural Heritage Materials. Elsevier; Amsterdam, The Netherlands: 2005. 828p