

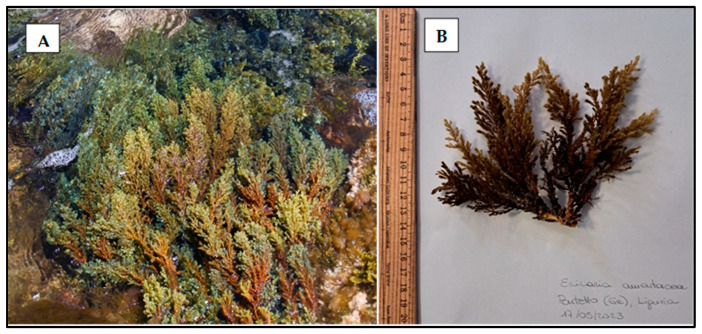
Photoprotective and Anti-Aging Properties of the Apical Frond Extracts from the Mediterranean Seaweed Ericaria amentacea
- PMID: 37233500
- PMCID: PMC10224410
- DOI: 10.3390/md21050306
Photoprotective and Anti-Aging Properties of the Apical Frond Extracts from the Mediterranean Seaweed Ericaria amentacea
Abstract
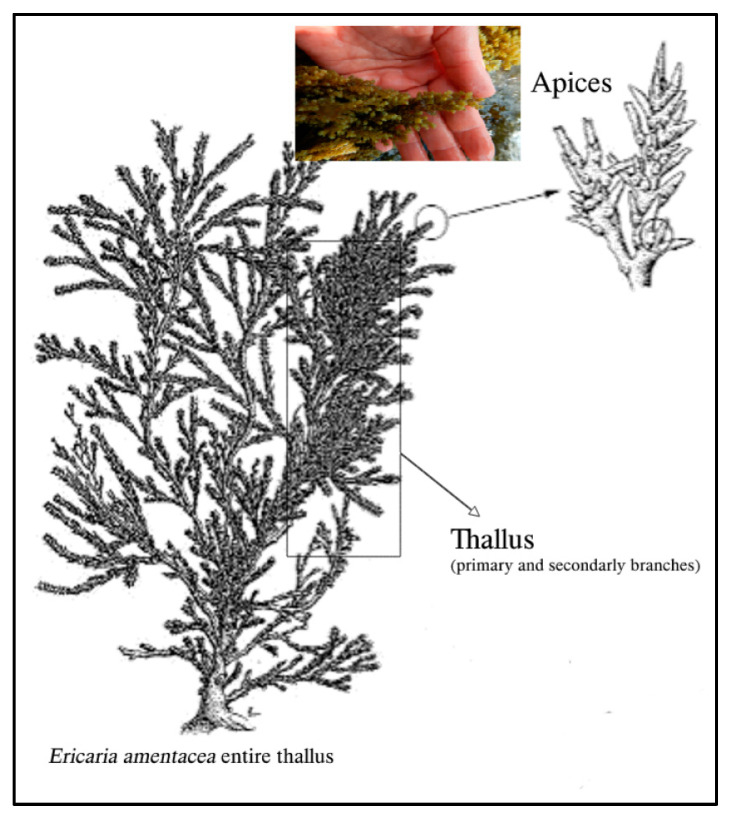
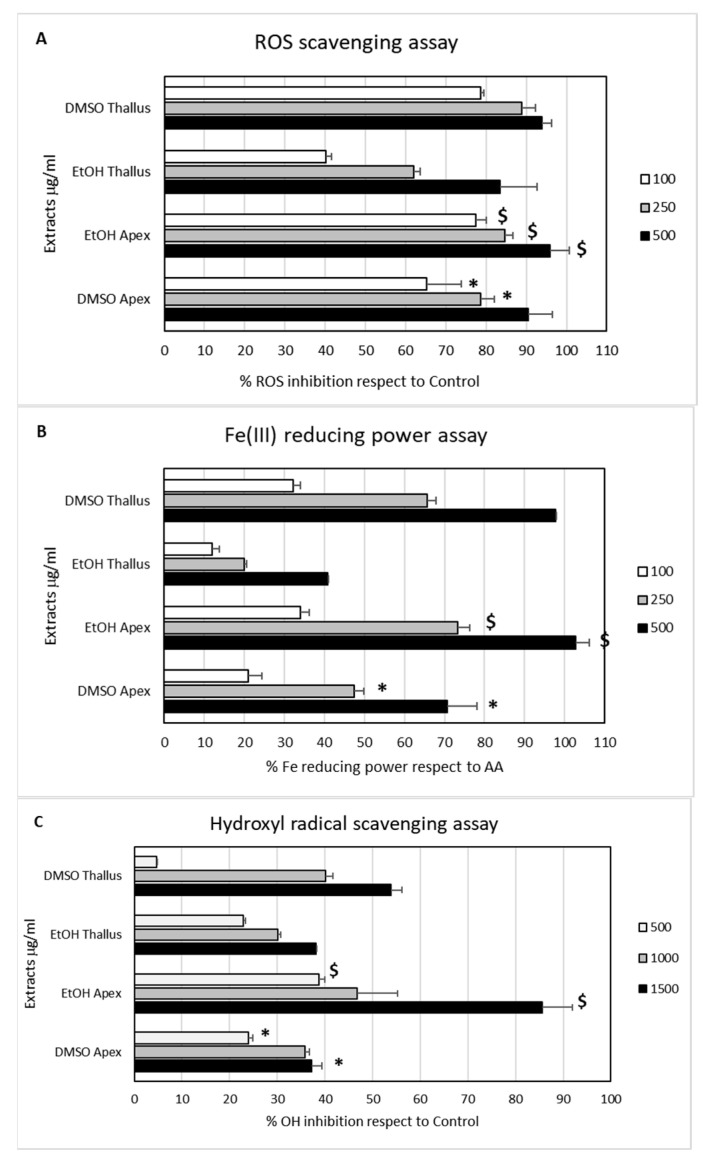
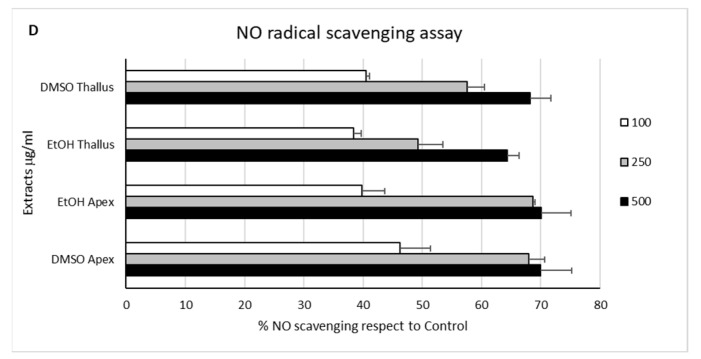
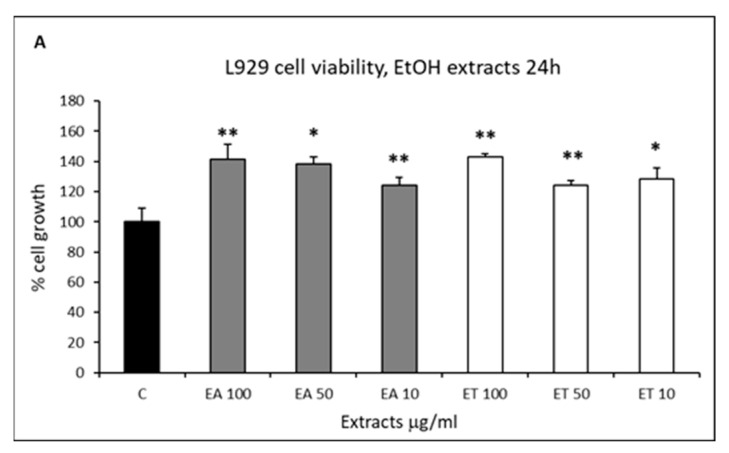
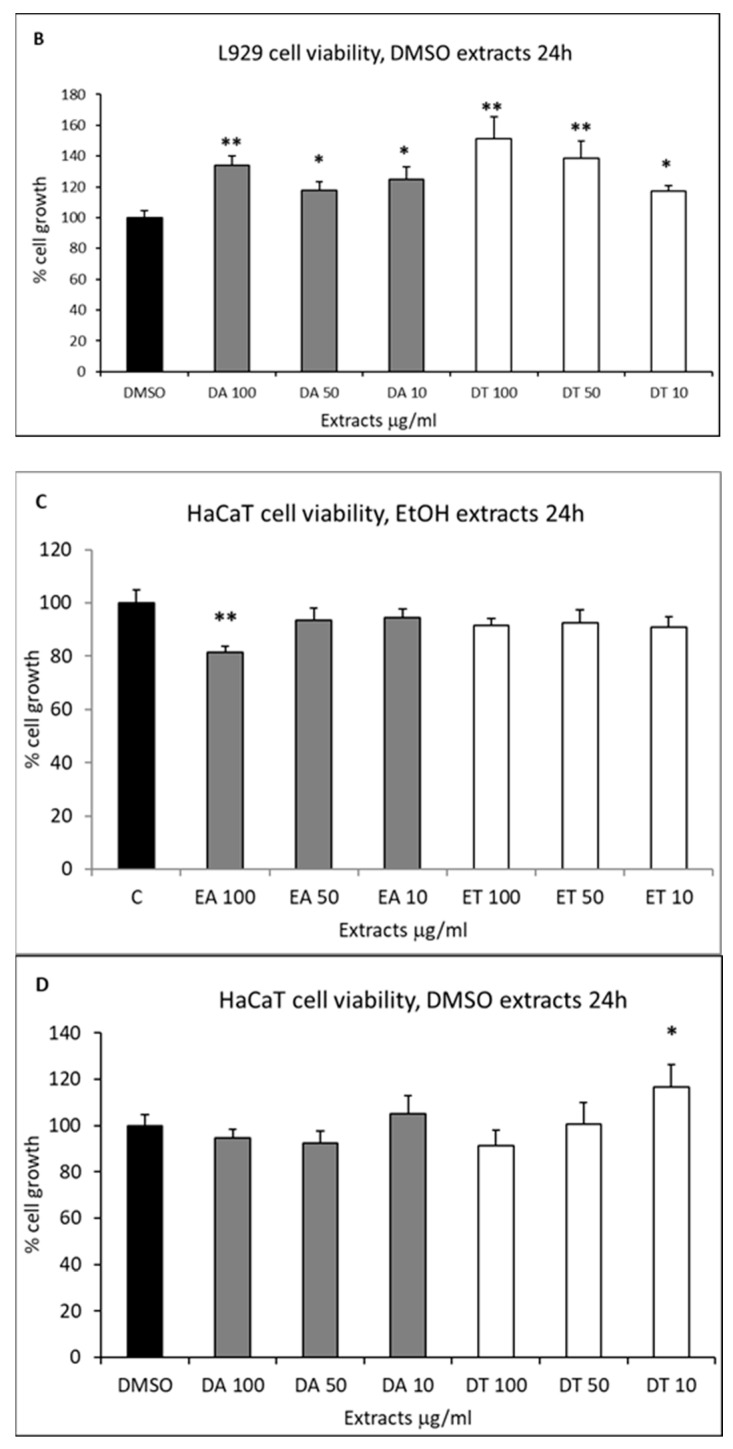
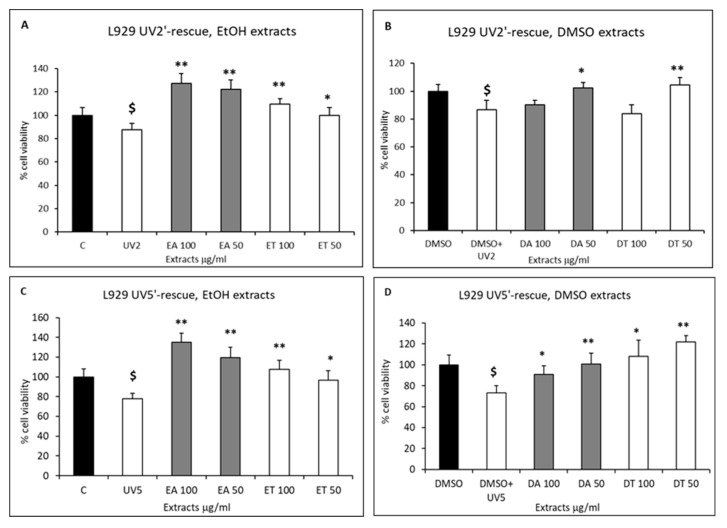
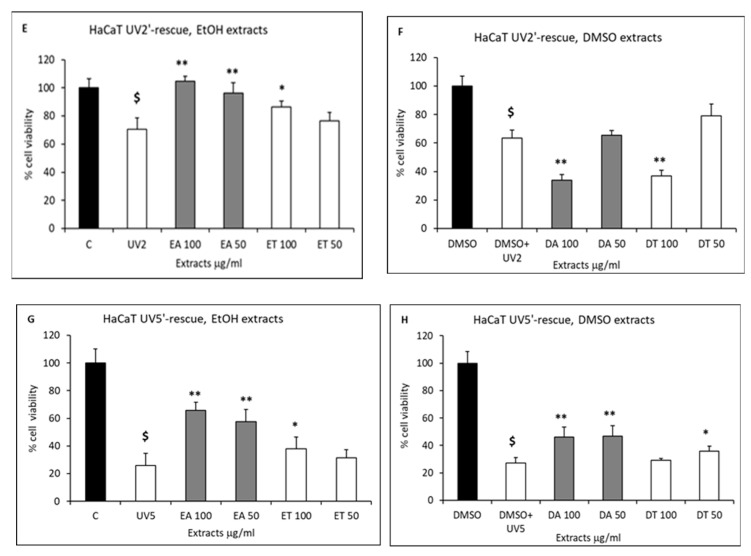
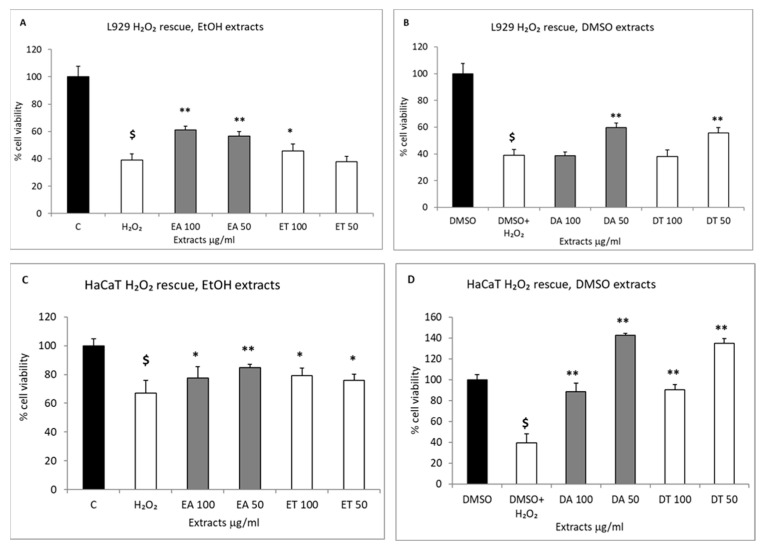
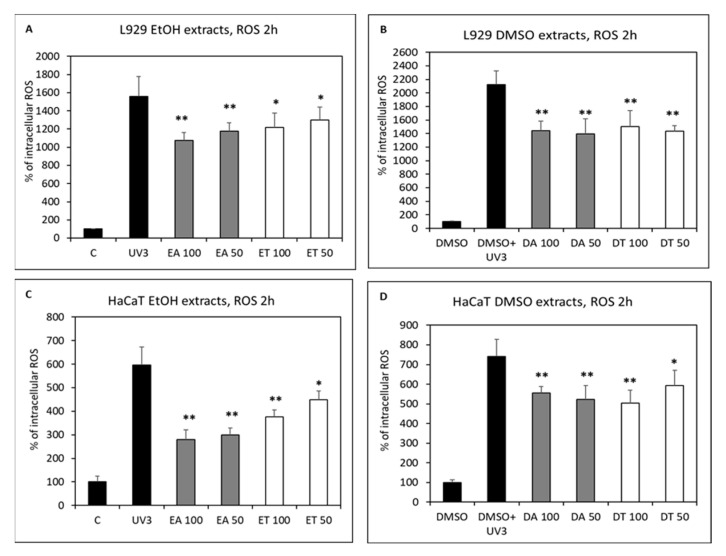
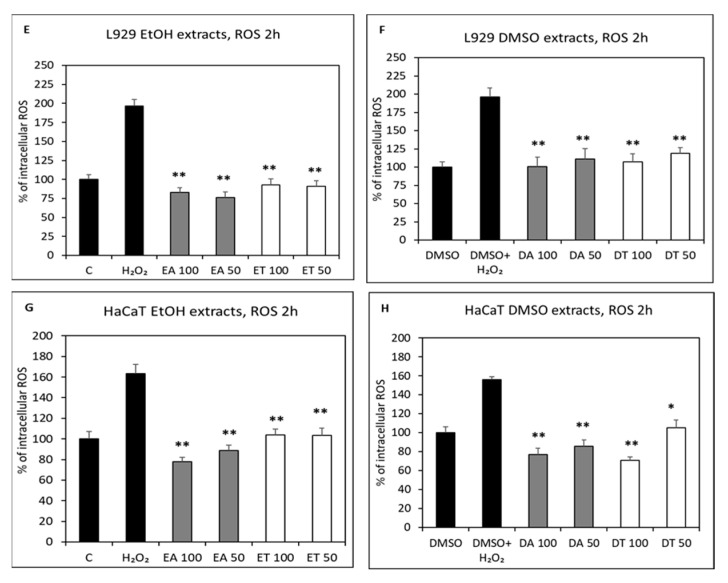
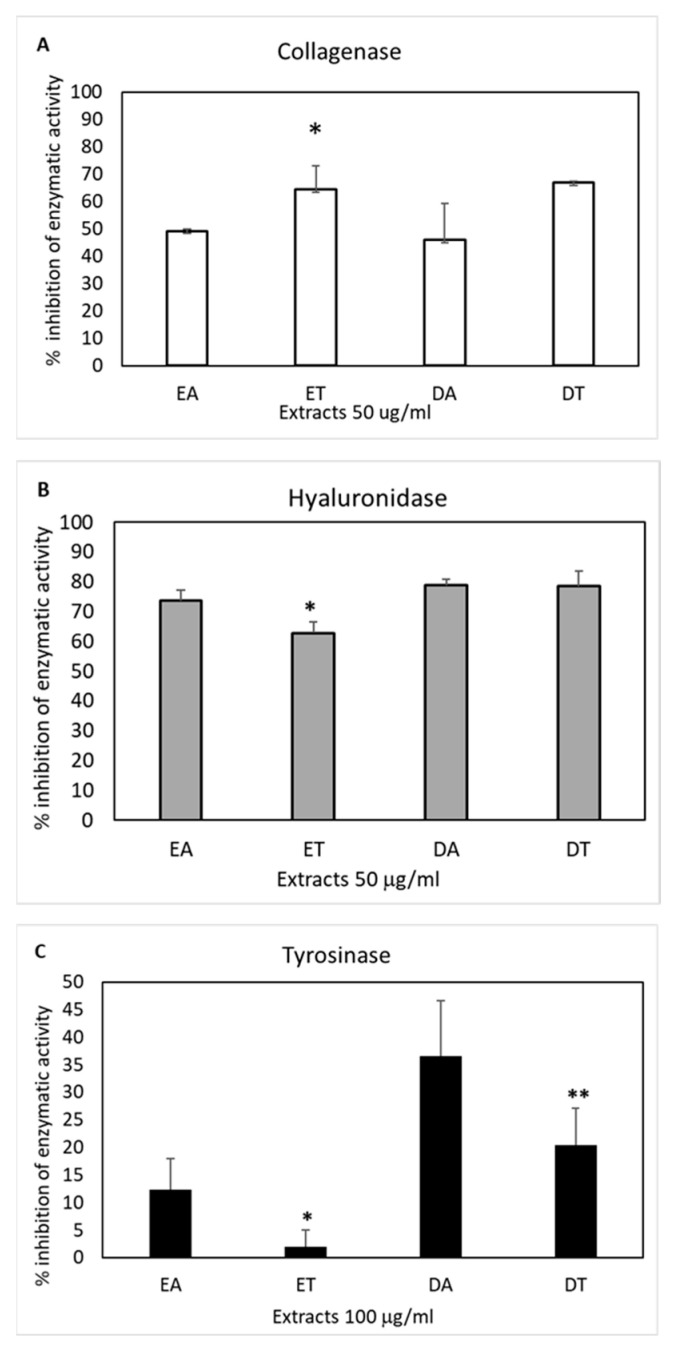
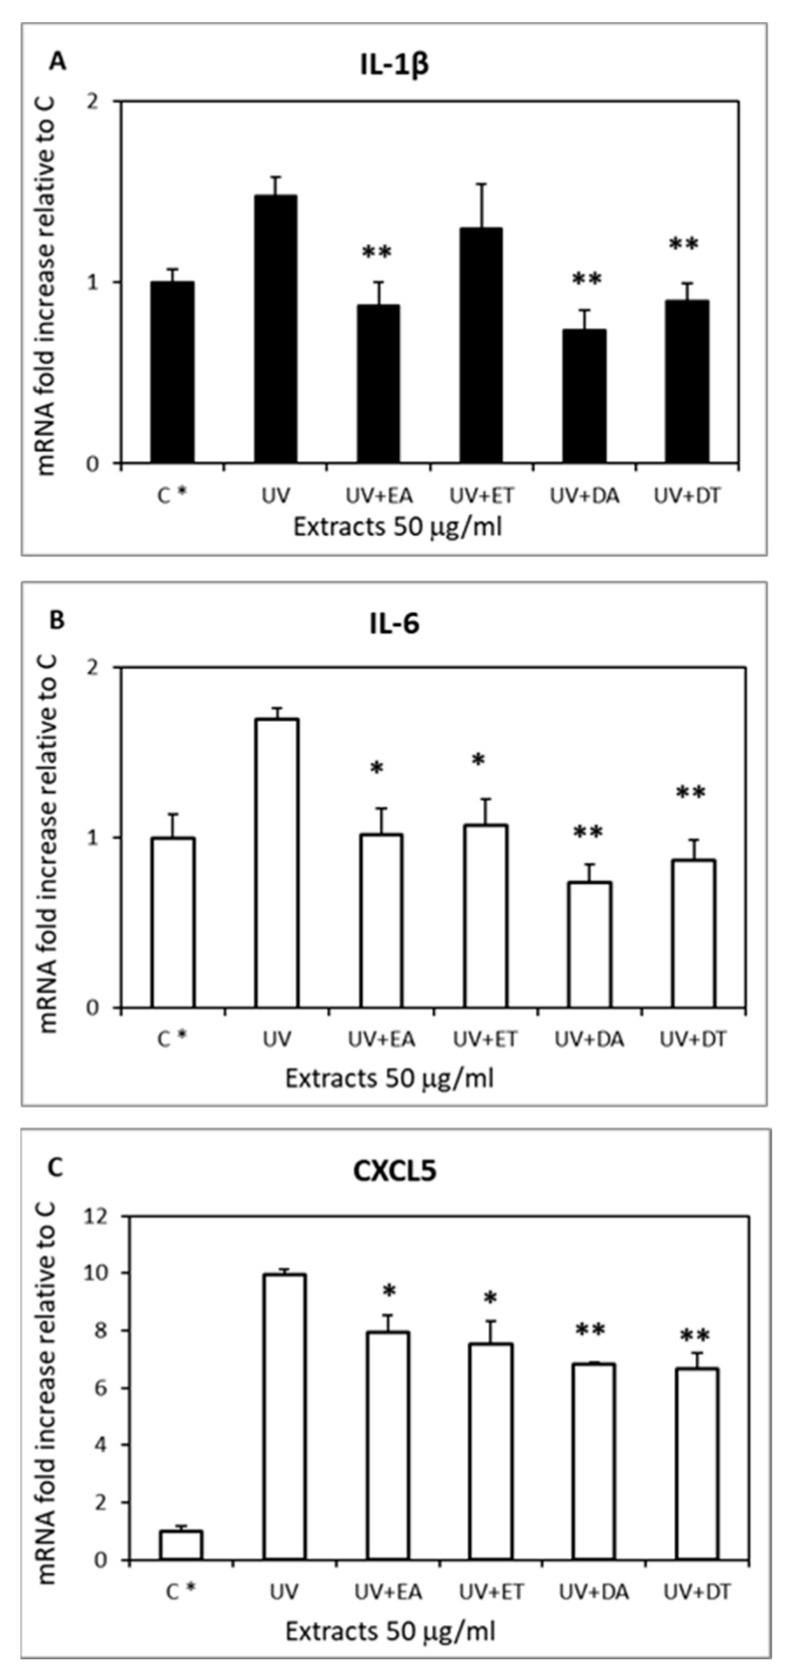
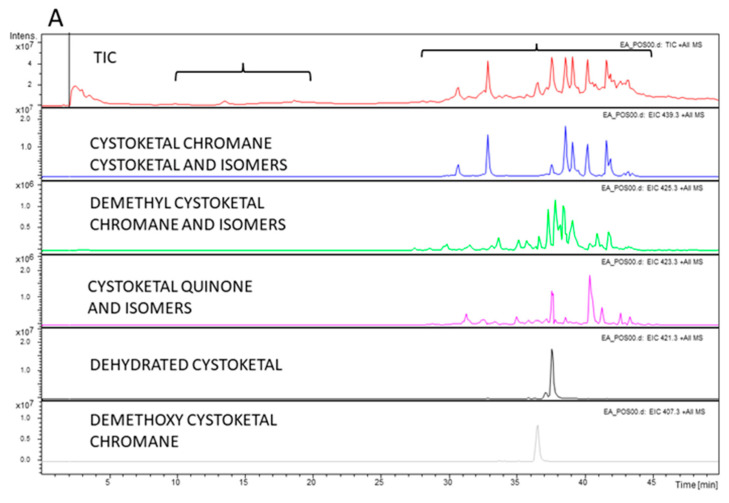
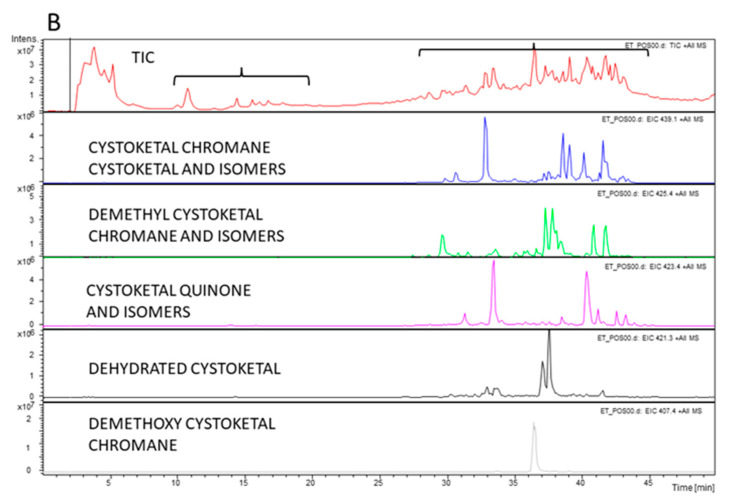
There is a growing interest in using brown algal extracts thanks to the bioactive substances they produce for adaptation to the marine benthic environment. We evaluated the anti-aging and photoprotective properties of two types of extracts (50%-ethanol and DMSO) obtained from different portions, i.e., apices and thalli, of the brown seaweed, Ericaria amentacea. The apices of this alga, which grow and develop reproductive structures during summer when solar radiation is at its peak, were postulated to be rich in antioxidant compounds. We determined the chemical composition and pharmacological effects of their extracts and compared them to the thallus-derived extracts. All the extracts contained polyphenols, flavonoids and antioxidants and showed significant biological activities. The hydroalcoholic apices extracts demonstrated the highest pharmacological potential, likely due to the higher content of meroditerpene molecular species. They blocked toxicity in UV-exposed HaCaT keratinocytes and L929 fibroblasts and abated the oxidative stress and the production of pro-inflammatory cytokines, typically released after sunburns. Furthermore, the extracts showed anti-tyrosinase and anti-hydrolytic skin enzyme activity, counteracting the collagenase and hyaluronidase degrading activities and possibly slowing down the formation of uneven pigmentation and wrinkles in aging skin. In conclusion, the E. amentacea apices derivatives constitute ideal components for counteracting sunburn symptoms and for cosmetic anti-aging lotions.
Keywords: Cystoseira amentacea; Ericaria amentacea; anti-collagenase; anti-hyaluronidase; anti-tyrosinase; antioxidant; inflammation; meroditerpenes; polyphenols.
Conflict of interest statement
The authors declare no conflict of interest.
Figures
References
-
- de Sousa C.B., Gangadhar K.N., Macridachis J., Pavão M., Morais T.R., Campino L., Varela J., Lago J.H.G. Cystoseira algae (Fucaceae): Update on their chemical entities and biological activities. Tetrahedron Asymmetry. 2017;28:1486–1505. doi: 10.1016/j.tetasy.2017.10.014. - DOI
-
- Gaysinski M., Ortalo-Magné A., Thomas O.P., Culioli G. Methods in Molecular Biology Book Series. Volume 1308. Humana Press; Clifton, NJ, USA: 2015. Extraction, purification, and NMR analysis of terpenes from brown algae; pp. 207–223. - PubMed
MeSH terms
Substances
Grants and funding
LinkOut - more resources
Full Text Sources
