. 2023 May 4;13(5):627.
doi: 10.3390/metabo13050627.

Glucolipotoxic Stress-Induced Mig6 Desensitizes EGFR Signaling and Promotes Pancreatic Beta Cell Death

Affiliations

Glucolipotoxic Stress-Induced Mig6 Desensitizes EGFR Signaling and Promotes Pancreatic Beta Cell Death

Yi-Chun Chen et al. Metabolites. .

Abstract

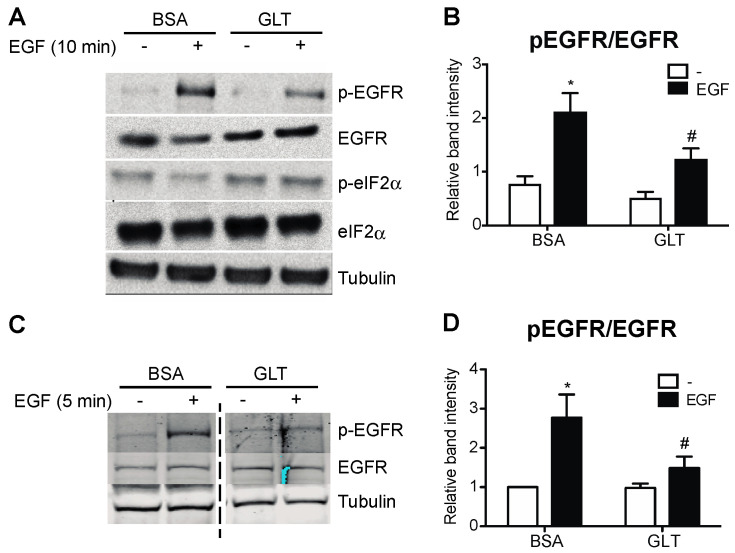
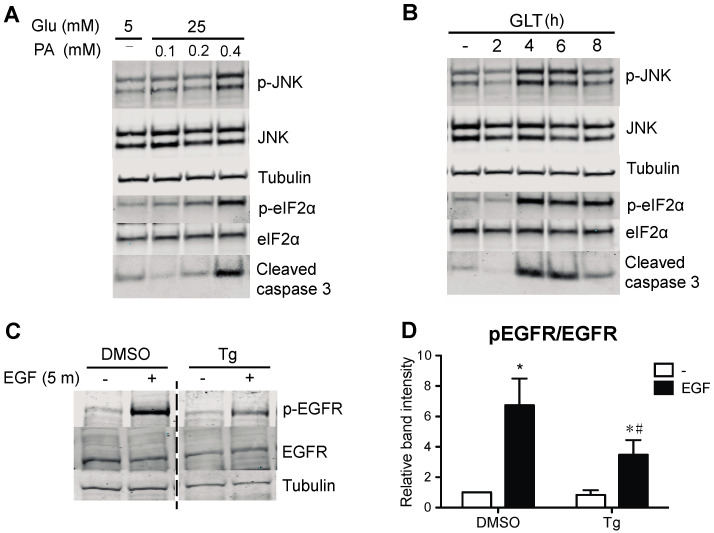
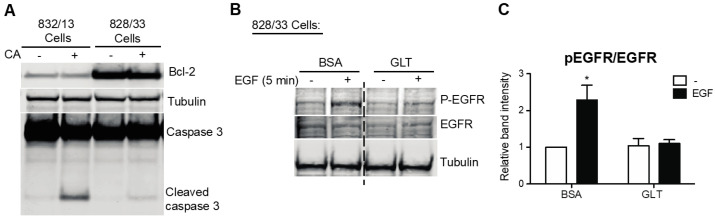
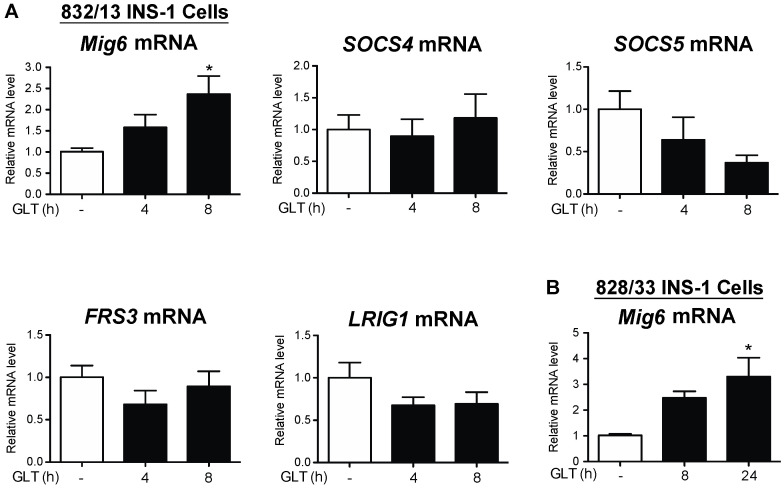
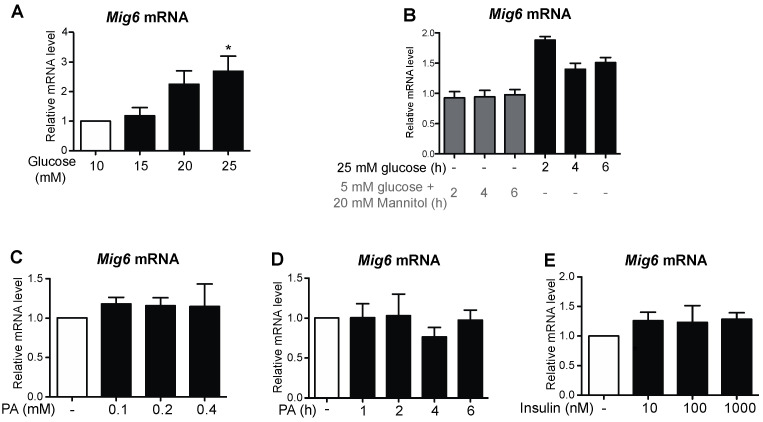
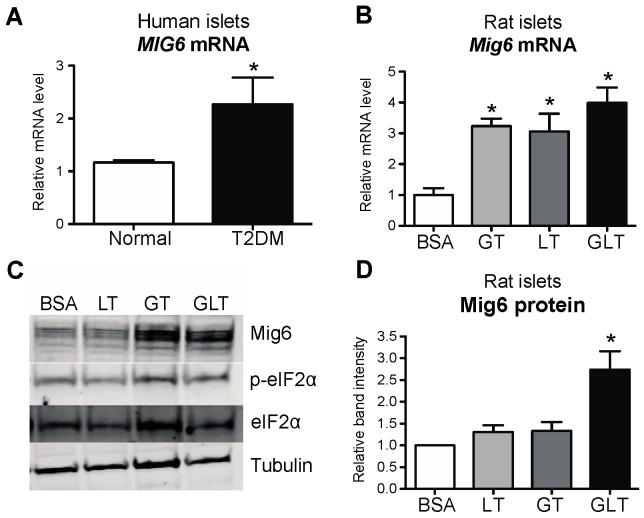
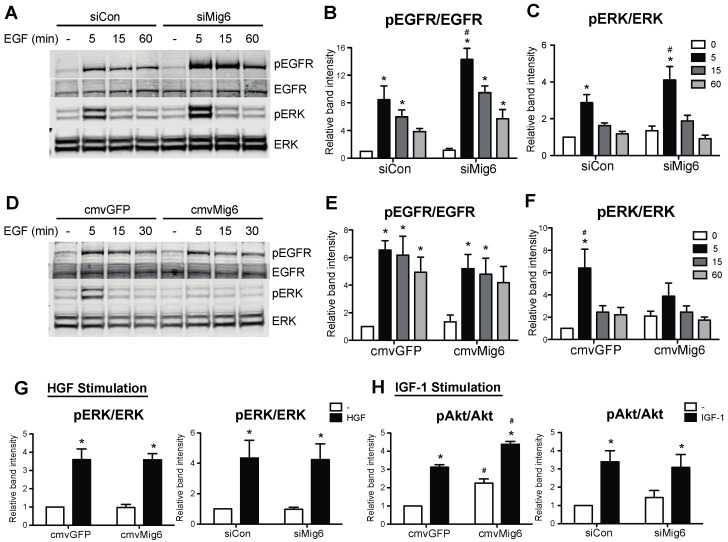
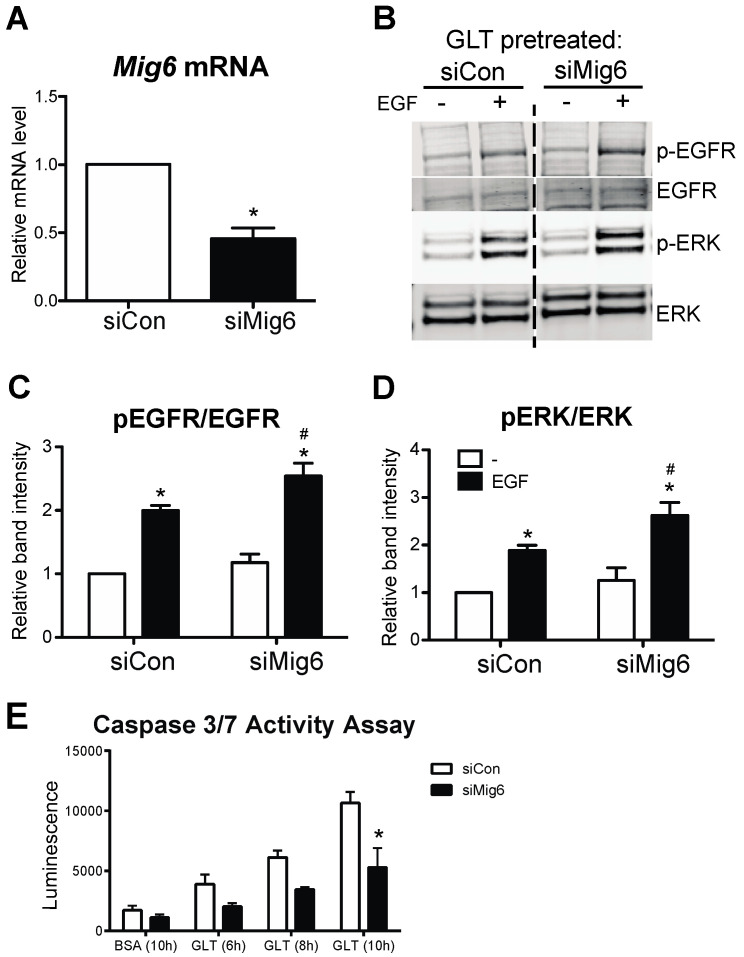
A loss of functional beta cell mass is a final etiological event in the development of frank type 2 diabetes (T2D). To preserve or expand beta cells and therefore treat/prevent T2D, growth factors have been considered therapeutically but have largely failed to achieve robust clinical success. The molecular mechanisms preventing the activation of mitogenic signaling pathways from maintaining functional beta cell mass during the development of T2D remain unknown. We speculated that endogenous negative effectors of mitogenic signaling cascades impede beta cell survival/expansion. Thus, we tested the hypothesis that a stress-inducible epidermal growth factor receptor (EGFR) inhibitor, mitogen-inducible gene 6 (Mig6), regulates beta cell fate in a T2D milieu. To this end, we determined that: (1) glucolipotoxicity (GLT) induces Mig6, thereby blunting EGFR signaling cascades, and (2) Mig6 mediates molecular events regulating beta cell survival/death. We discovered that GLT impairs EGFR activation, and Mig6 is elevated in human islets from T2D donors as well as GLT-treated rodent islets and 832/13 INS-1 beta cells. Mig6 is essential for GLT-induced EGFR desensitization, as Mig6 suppression rescued the GLT-impaired EGFR and ERK1/2 activation. Further, Mig6 mediated EGFR but not insulin-like growth factor-1 receptor nor hepatocyte growth factor receptor activity in beta cells. Finally, we identified that elevated Mig6 augmented beta cell apoptosis, as Mig6 suppression reduced apoptosis during GLT. In conclusion, we established that T2D and GLT induce Mig6 in beta cells; the elevated Mig6 desensitizes EGFR signaling and induces beta cell death, suggesting Mig6 could be a novel therapeutic target for T2D.

Keywords: Errfi1; diabetes; islet.


Conflict of interest statement

The authors declare no conflict of interest.

Figures

Figure 1
Figure 1
Glucolipotoxicity impairs EGFR activation in beta cells and human islets. Human islets and 832/13 cells were cultured in media with 5 mM glucose and BSA, or 25 mM glucose and 400 μM palmitic acid complexed to BSA (glucolipotoxicity, GLT) for 48 or 8 h, respectively, followed by starvation in 5 mM glucose medium for 2 h, and then stimulated with recombinant human EGF (50 ng/mL for 10 min for islets and 10 ng/mL for 5 min for cells). Protein levels of p-EGFR, EGFR, p-eIF2α, and tubulin were analyzed by immunoblotting. Shown are representative immunoblots from human islets (A,B) and 832/13 cells (C,D), and quantified data are reported as fold induction relative to BSA, non-stimulated samples. Groups were compared using ANOVA with Bonferroni post hoc tests. n = 3 independent human islet preparations and 3 independent cell line experiments; * p < 0.05 vs. BSA, non-stimulated; # p < 0.05 vs. BSA, EGF-stimulated.
Figure 2
Figure 2
ER stress impairs EGFR phosphorylation. (A) To verify induction of ER stress, 832/13 cells were cultured in media containing 5 mM glucose and BSA or 25 mM glucose and increasing concentrations of palmitic acid complexed to BSA (0, 0.1, 0.2, or 0.4 mM) for 8 h. (B) In a complementary experiment, cells were exposed to 25 mM glucose and 0.4 mM palmitic acid for up to 8 h. Cells were harvested, and lysates were immunoblotted using antibodies directed against p-JNK, JNK, p-eIF2α, eIF2α, and cleaved caspase 3 to establish the extent of ER stress produced by glucolipotoxicity. Shown are representative, confirmatory immunoblots. (C) To induce ER stress, 832/13 cells were treated with DMSO (vehicle control) or 1 μM thapsigargin (Tg) for 4 h, followed by starvation and EGF stimulation as before. Protein levels of p-EGFR, EGFR, and tubulin were analyzed by immunoblotting. Representative blots of n ≥ 3 experiments are shown, and results are quantified in (D). Groups were compared using ANOVA with Bonferroni post hoc tests. * p < 0.05 vs. BSA, non-stimulated; # p < 0.05 vs. BSA, EGF-stimulated.).
Figure 3
Figure 3
Apoptosis is not required for glucolipotoxicity-impaired EGFR activation. (A) To promote apoptosis, 832/13 and Bcl-2 overexpressing 828/33 cells were treated with 1 μM camptothecin (CA) for 8 h. To demonstrate resistance to cell death in 828/33 cells, protein levels of Bcl-2, full-length and cleaved caspase 3, and tubulin were analyzed by immunoblotting. (B) A total of 828/33 cells were cultured in media, as in Figure 1. Protein levels of p-EGFR, EGFR, and tubulin were analyzed by immunoblotting, and quantified results are reported in (C). Groups were compared using ANOVA with Bonferroni post hoc tests. n = 3; * p < 0.05 vs. all other groups.
Figure 4
Figure 4
Mig6, but not other feedback inhibitors of EGFR, is induced by glucolipotoxicity. (A) 832/13 and (B) 828/33 cells were cultured in control (white bars) or glucolipotoxic (black bars) media for up to 8 h. Expression of Mig6, SOCS4, SOCS5, FRS1, and LRIG1 mRNA was quantified using qRT-PCR. Groups were compared using ANOVA. n = 3; * p < 0.05 vs. control media.
Figure 5
Figure 5
Gluco-, but not lipotoxicity, alone induces Mig6 expression. 832/13 cells were treated with (A) 5, 10, 15, 20, or 25 mM glucose for 4 h, (B) 25 mM glucose or 5 mM glucose + 20 mM mannitol (as an osmotic stress control) for 0, 2, 4, or 6 h. (C) BSA, 100, 200, 400 μM palmitic acid complexed to BSA for 4 h. (D) A total of 400 μM palmitic acid for the indicated times, or (E) 0, 10, 100, or 1000 nM recombinant human insulin for 4 h. Mig6 mRNA levels were determined by qRT-PCR. Groups were compared using ANOVA. n ≥ 3 experiments. * p < 0.05 vs. BSA/5 mM glucose + 20 mM mannitol.
Figure 6
Figure 6
Mig6 is elevated in T2DM human and rodent islets treated with glucolipotoxicity. (A) MIG6 mRNA was measured in human islets from normal (white bar) and type 2 diabetic (black bar) cadaver donors. (B) Rat islets were cultured in media containing 5 mM glucose and BSA (white bar), 25 mM glucose and BSA (glucotoxicity, GT; light gray bar), 5 mM glucose and 0.4 mM palmitic acid complexed to BSA (lipotoxicity, LT; dark gray bar), or 25 mM glucose and 0.4 mM palmitic acid (glucolipotoxicity, GLT; black bar) for 8 h. Mig6 mRNA was measured by RT-PCR. (C) Rat islet lysates were immunoblotted with antibodies directed against Mig6, p-eIF2α, eIF2α, and tubulin, and (D) results for Mig6 content were quantified. Groups were compared using ANOVA with Bonferroni post hoc tests. N = 3–4; * p < 0.05 vs. normal or 5 mM glucose with BSA.
Figure 7
Figure 7
Mig6 controls EGF, but neither IGF1 nor HGF, pro-survival signaling pathways. (AF) 832/13 cells were transduced with adenoviruses carrying cmvGFP vs. cmvMig6 or siCon vs. siMig6. Post transduction, cells were starved in 5 mM glucose and 0.1% BSA medium for 2 h, followed by 10 ng/mL recombinant rat EGF stimulation for 5 min. (G,H) After adenoviral transduction and starvation as in ((A,D), 832/13 cells were treated with recombinant human HGF or IGF-1 for 5 min. Protein levels of p-EGFR, p-Erk, Erk, p-Akt, Akt, and tubulin were analyzed by immunoblotting. Groups were compared using ANOVA with Bonferroni post hoc tests. n ≥ 3. * p < 0.05 vs. non-stimulated. # p < 0.05 vs. control virus, stimulated condition.
Figure 8
Figure 8
Mig6 suppression dampens apoptosis during glucolipotoxicity. (A) 832/13 cells were transduced with adenoviral vectors carrying either a scrambled control siRNA (siCon) or shRNA sequence against Mig6 (siMig6). Mig6 mRNA levels were determined by qRT-PCR. Groups were compared using Student’s t-test. n = 4; * p < 0.05. (BD) Transduced cells were treated with GLT and EGF, as described previously. Protein levels of p-EGFR, EGFR, p-Erk, and Erk were determined by immunoblotting. Data are reported as fold induction related to the GLT-treated, non-EGF-stimulated group. Groups were compared using ANOVA with Bonferroni post hoc tests. n ≥ 3. * p < 0.05 vs. EGF-treated. # p < 0.05 vs. siCon EGF-stimulated. (E) Caspase 3/7 activity was measured following exposure to glucolipotoxic conditions in 832/13 cells siCon or siMig6. Groups were compared using ANOVA with Bonferroni post hoc tests. n = 3 experiments; * p < 0.05 vs. siCon.

Similar articles

Cited by

References

    1. Shcheglova E., Blaszczyk K., Borowiak M. Mitogen Synergy: An Emerging Route to Boosting Human Beta Cell Proliferation. Front. Cell Dev. Biol. 2021;9:734597. doi: 10.3389/fcell.2021.734597. - DOI - PMC - PubMed
    1. Hakonen E., Ustinov J., Mathijs I., Palgi J., Bouwens L., Miettinen P.J., Otonkoski T. Epidermal growth factor (EGF)-receptor signalling is needed for murine beta cell mass expansion in response to high-fat diet and pregnancy but not after pancreatic duct ligation. Diabetologia. 2011;54:1735–1743. doi: 10.1007/s00125-011-2153-1. - DOI - PubMed
    1. Hakonen E., Ustinov J., Palgi J., Miettinen P.J., Otonkoski T. EGFR signaling promotes beta-cell proliferation and survivin expression during pregnancy. PLoS ONE. 2014;9:e93651. doi: 10.1371/journal.pone.0093651. - DOI - PMC - PubMed
    1. Christensen A.A., Gannon M. The Beta Cell in Type 2 Diabetes. Curr. Diabetes Rep. 2019;19:81. doi: 10.1007/s11892-019-1196-4. - DOI - PubMed
    1. Cousin S.P., Hugl S.R., Wrede C.E., Kajio H., Myers M.G., Jr., Rhodes C.J. Free fatty acid-induced inhibition of glucose and insulin-like growth factor I-induced deoxyribonucleic acid synthesis in the pancreatic beta-cell line INS-1. Endocrinology. 2001;142:229–240. doi: 10.1210/endo.142.1.7863. - DOI - PubMed