. 2023 Jul 1;30(Pt 4):788-795.
doi: 10.1107/S1600577523003685. Epub 2023 May 26.

Micropipette aspiration as a tool for single-particle X-ray imaging and diffraction

Affiliations

Micropipette aspiration as a tool for single-particle X-ray imaging and diffraction

Hendrik Bruns et al. J Synchrotron Radiat. .

Abstract

A sample environment and manipulation tool is presented for single-particle X-ray experiments in an aqueous environment. The system is based on a single water droplet, positioned on a substrate that is structured by a hydrophobic and hydrophilic pattern to stabilize the droplet position. The substrate can support several droplets at a time. Evaporation is prevented by covering the droplet by a thin film of mineral oil. In this windowless fluid which minimizes background signal, single particles can be probed and manipulated by micropipettes, which can easily be inserted and steered in the droplet. Holographic X-ray imaging is shown to be well suited to observe and monitor the pipettes, as well as the droplet surface and the particles. Aspiration and force generation are also enabled based on an application of controlled pressure differences. Experimental challenges are addressed and first results are presented, obtained at two different undulator endstations with nano-focused beams. Finally, the sample environment is discussed in view of future coherent imaging and diffraction experiments with synchrotron radiation and single X-ray free-electron laser pulses.

Keywords: holographic X-ray imaging; micropipette aspiration; sample delivery of biophysical samples; single-particle diffraction.


Figures

Figure 1
Figure 1
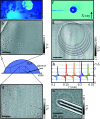
(a) Sketch of the micropipette sample environment (top view) on a glass slide. The sample (green) is held by micropipettes with 30° tilted tips, inserted into the sample solution. The droplet is stabilized by a hydrophobic PTFE pattern, or a mini pap pen coating on the supporting glass slide. (b) Cross-sectional view of the sample environment with mineral oil engulfing the aqueous solution to prevent evaporation. The X-ray beam traverses both the thin mineral oil film and the water droplet with the sample. No window materials are involved.
Figure 2
Figure 2
Experimental realization of the micropipette aspiration setup. (a) Rendering of the manipulators controlling the movement of the pipettes relative to the sample environment. (b) Close-up rendering of pipettes inserted into the sample solution. The inset shows the pipettes bringing two GUVs into contact. (c) PTFE-coated diagnostic slide with twelve 5.2 mm-diameter wells, fixing the positions of the sample droplets. (df) Two opposing pipettes (inclined tips with angle of 30°, 80 µm outer diameter, 15 µm inner diameter; GYNEMED, Germany) centered above the droplet and inserted into the droplet. (g) The assembly is moved into the focus of an optical microscope with images recorded by an optical network camera.
Figure 3
Figure 3
(a) Schematic of the ID01 beamline, ESRF, operated at 11 keV. Behind the two U27 undulators (u) and the double-reflection monochromator (mm), the beam is focused by compound refractive lenses (crl). A pinhole (ph) is used as a spatial filter in the focal plane, and a fiber-coupled sCMOS detector (d) captures the images. (b) Photograph of the hexapod (1) with the sample stage (2) and an optical microscope (3), supplied by coaxial LED illumination via a fiberglass cable (4). (c) Background illumination provided by the setup; (d) with pipettes in the field of view. Scale bars: 100 µm.
Figure 4
Figure 4
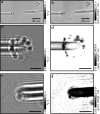
Holographic imaging at ID01. (ad) Coffee grain aspirated by a pipette and used as a test object. (a) Optical microscope top view showing the sample reaching into the opening. (b) Hologram of the aspirated sample. (c) Hologram corrected by a flat field containing the pipette. (d) Nonlinear Fresnel Tikhonov phase reconstruction (Huhn et al., 2022; Lohse et al., 2020 ▸) (β/δ = 0.0286, lim1 = 10−4, lim2 = 3 × 10−1). (e) Hologram of GUV imaging attempt not yet showing sufficient contrast. Scale bars: 30 µm.
Figure 5
Figure 5
(a) Setup schematic of the GINIX endstation at beamline P10, DESY, showing the 5 m U32 undulator (u), the Si(111) double-crystal monochromator (mm), the KB mirrors and the waveguide (wg). The sample is positioned in defocus of the waveguide illumination and magnified inline holograms are recorded by a fiber-coupled sCMOS detector positioned 5.1 m behind the sample. (b) Photograph of the sample environment. (c) Waveguide empty beam illumination. Scale bar: 50 µm.
Figure 6
Figure 6
(a) Birds-eye-view microscopy image of aspirated polystyrene beads (30 µm diameter). (b) Hologram of polystyrene beads sticking out of the water droplet. (c) Positions of the images (b, d) with respect to the droplet. (d) Hologram of the pipette with an aspirated bead; several beads accumulate at the air–water interface of the droplet. (e) Hologram of the pipette with a bead aspirated at the tip. (f) Water droplet suspended from a pipette (top view microscope). (g) Six successive holograms (added), showing the evaporation process. (h) Water–air interface profiles of the holograms, taken along the radial cross section of the magenta region in (g). Scale bars: 100 µm.
Figure 7
Figure 7
Holograms of aspirated macrophages, stained with barium (BaSO4). (a) Hologram of opposing pipettes, each having a macrophage aspirated at a wg-to-sample distance of z 01 = 19 cm. (b) Tikhonov reconstruction (Huhn et al., 2022; Lohse et al., 2020 ▸). (c) Hologram of the left macrophage. (d) Tikhonov reconstruction with a wg-to-sample distance of z 01 = 10 cm. (e, f) Hologram of the right macrophage. (f) Tikhonov reconstruction with a wg-to-sample distance of z 01 = 10 cm. Scale bars: 10 µm.
Figure 8
Figure 8
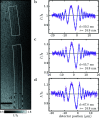
(a) Holographic propagation imaging of a so-called black lipid membrane (BLM), i.e. lipid membranes spanned over an aperture between two aqueous compartments in a Teflon chamber with polyimide windows for X-ray transmission. Since the lipids system is prepared by ‘painting’ a solution of lipids in decane, the bilayer is still swollen with decane. The exact thickness of the BLM can be determined by analysis of the Fresnel finges. Following Beerlink et al. (2009 ▸), we can model the density profile (or equivalently phase profile) and use Fresnel propagation for least-square fitting of the radial intensity profiles (b, c, d). The experimental profiles are shown as a function of radial distance r from the center of a circle describing the averaging over a range of azimuthal angles, as indicated in (a), to increase the signal-to-noise ratio. Here, the BLM thickness d was ranged between 50 nm and 70 nm, but this depends on the configuration, and in particular on the solvent outflow (BLM thinning).

Similar articles

References

    1. Ashkin, A. (1970). Phys. Rev. Lett. 24, 156–159.
    1. Ashkin, A. (1978). Phys. Rev. Lett. 40, 729–732.
    1. Ashkin, A. & Dziedzic, J. (1987). Science, 235, 1517–1520. - PubMed
    1. Beerlink, A., Mell, M., Tolkiehn, M. & Salditt, T. (2009). Appl. Phys. Lett. 95, 203703.
    1. Beerlink, A., Thutupalli, S., Mell, M., Bartels, M., Cloetens, P., Herminghaus, S. & Salditt, T. (2012). Soft Matter, 8, 4595–4601.