

doi: 10.1007/s00417-023-06111-3.
Epub 2023 May 26.
Cone letter charts: rapid color test using a range of letter sizes
Affiliations
- PMID: 37233827
- PMCID: PMC10667385
- DOI: 10.1007/s00417-023-06111-3
Item in Clipboard
Cone letter charts: rapid color test using a range of letter sizes
Graefes Arch Clin Exp Ophthalmol.
2023 Dec.
No abstract available
Keywords: Color vision; Contrast sensitivity; Ocular disease; Visual acuity.
Conflict of interest statement
The authors declare no competing interests.
Figures

L cone- and S cone-specific VA charts (left panels) and small letter CS charts (right panels) as seen on the surface display. Letters were visible only to the specified cone type (please see text for further details). L and M cone VA charts were displayed at 8% contrast (color normals initially tested at 16% had scores corrected to 8% by adding 0.1 logMAR, S cone VA charts displayed at 64% contrast). The right panels show L and M cone small letter CS charts with contrast varying from 16 to 1% contrast for both small and large letter CS (please see text for additional details). Three versions of each test were used to discourage learning effects
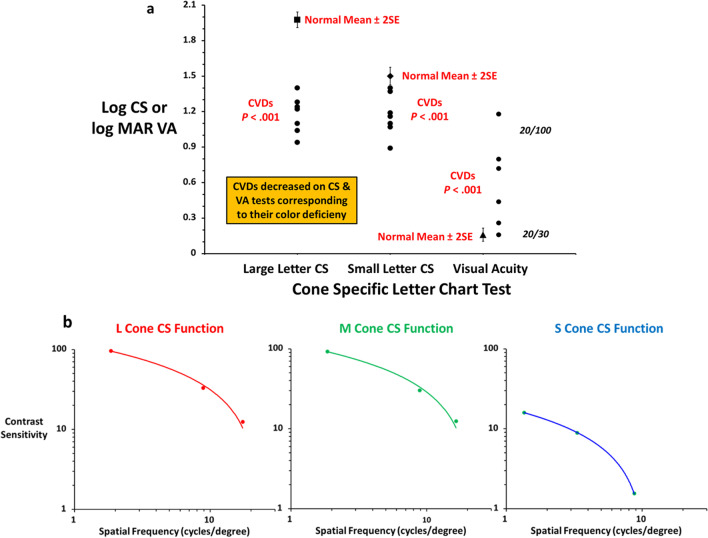
a Mean VA (logMAR) and large and small letter CS (logCS) are plotted for CVN subjects (mean ± 2SE, n = 15) with individual results shown for each CVD for their color defective cone type. Mean comparisons were highly significant for each test (P < .001, please see text for further details). b L, M, and S cone-specific CS functions derived from the best fit of CVD means across spatial frequency and contrast. The Y-axes are contrast sensitivity (1/contrast threshold), and the X-axes are spatial frequency (cycles/degree) with data plotted on absolute scales showing differences between L, M, and S cones. Please see text for additional comment and relevance
References
-
- White KM, Livnat I, Frambach CR, Doan J, Mehta UV, Yuh C, Palma AM, Jameson KA, Kenney MC, Mehta MC, Boisvert CJ, Crow WR, Browne AW. Quantitative cone contrast threshold testing in patients with differing pathophysiological mechanisms causing retinal diseases. Int J Retin Vitr. 2023;9:9. doi: 10.1186/s40942-023-00442-3. - DOI - PMC - PubMed
Publication types
MeSH terms
Grants and funding
LinkOut - more resources
Full Text Sources
