. 2023 Apr 23;26(5):106714.
doi: 10.1016/j.isci.2023.106714. eCollection 2023 May 19.

Modeling breast cancer proliferation, drug synergies, and alternating therapies

Affiliations

Modeling breast cancer proliferation, drug synergies, and alternating therapies

Wei He et al. iScience. .

Abstract

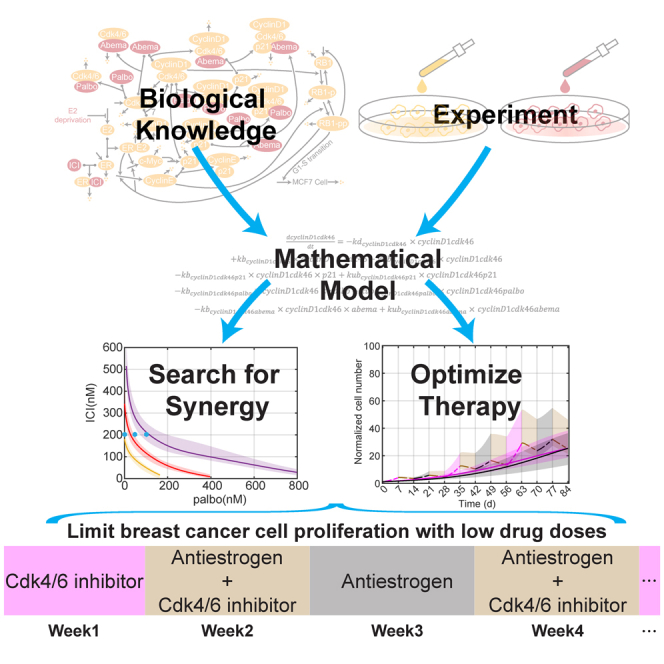
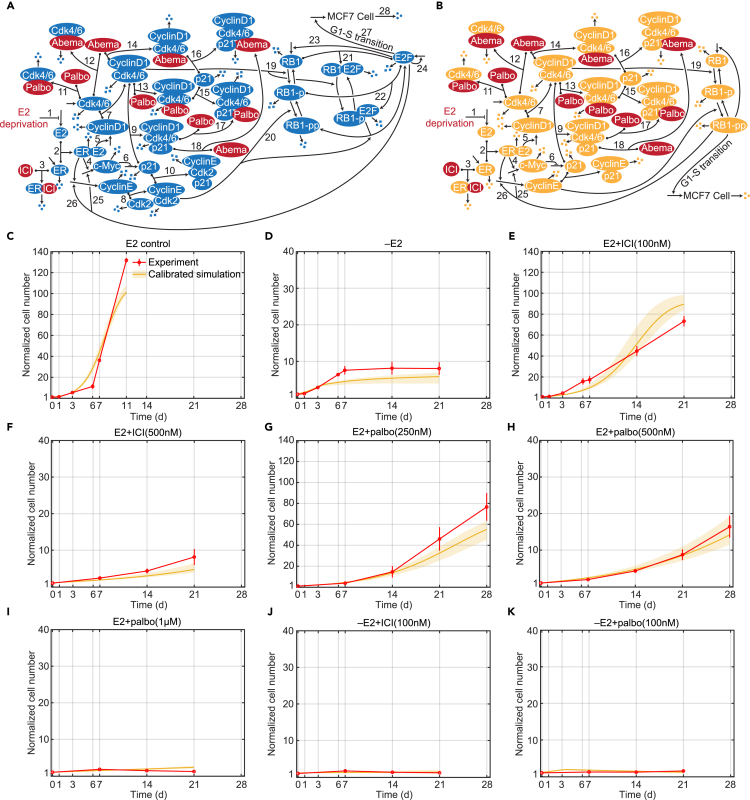
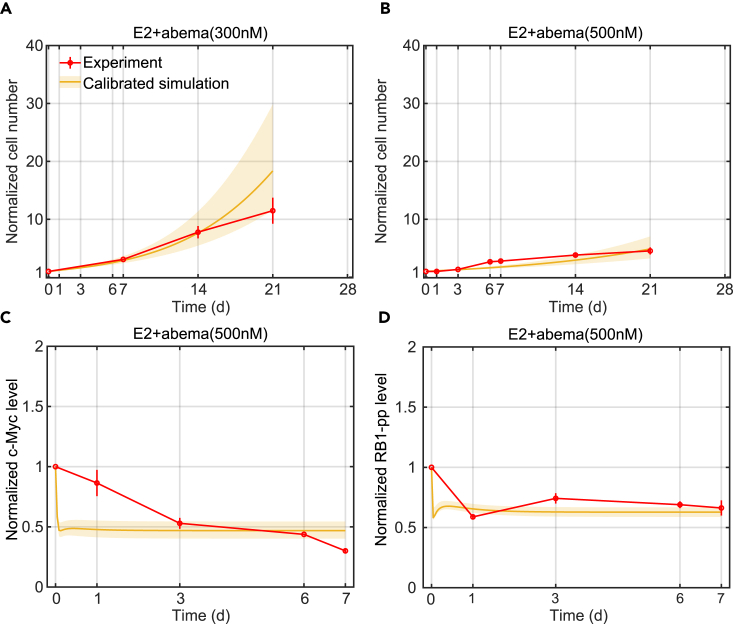
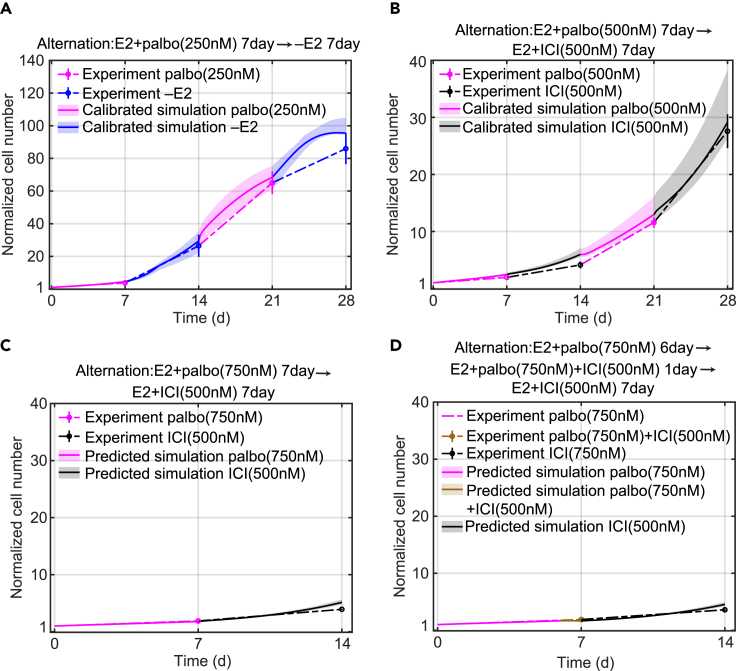
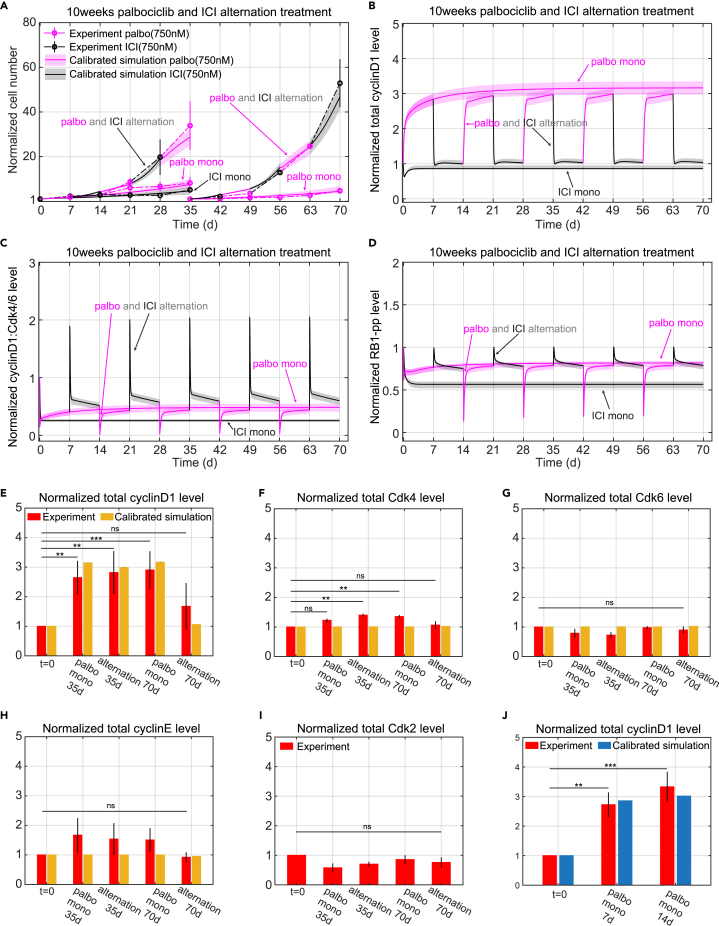
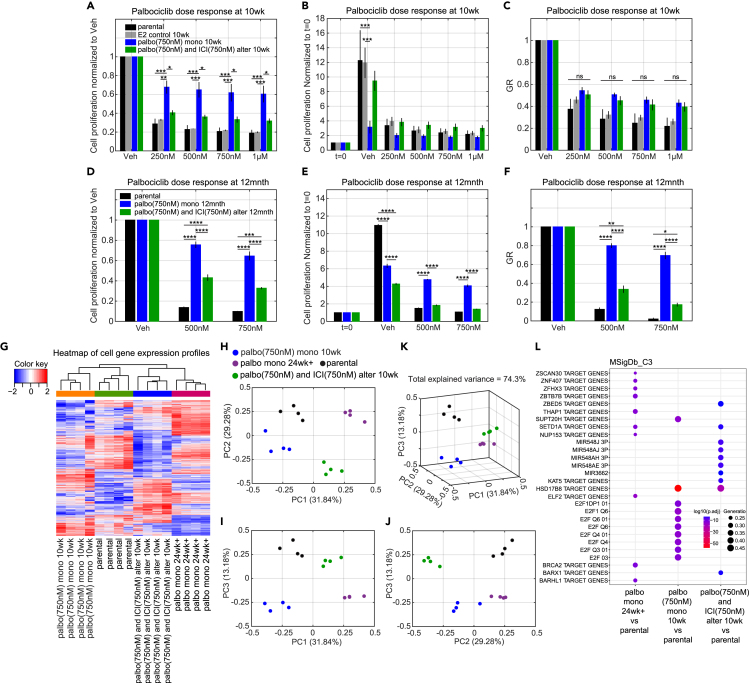
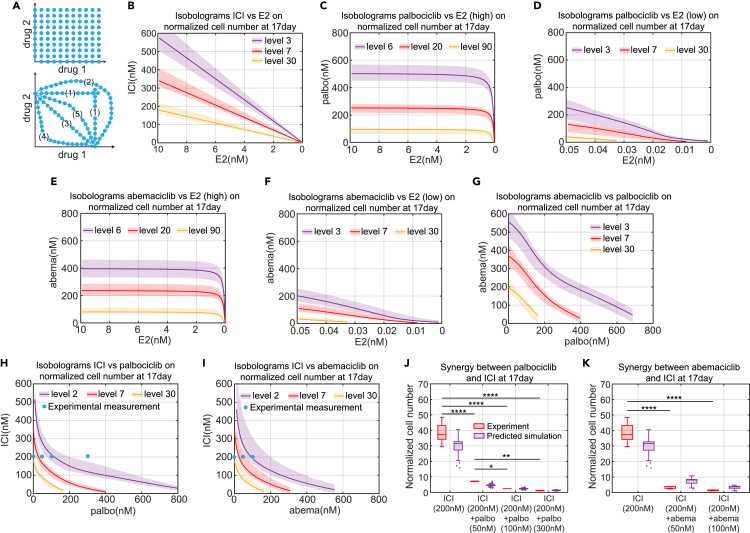
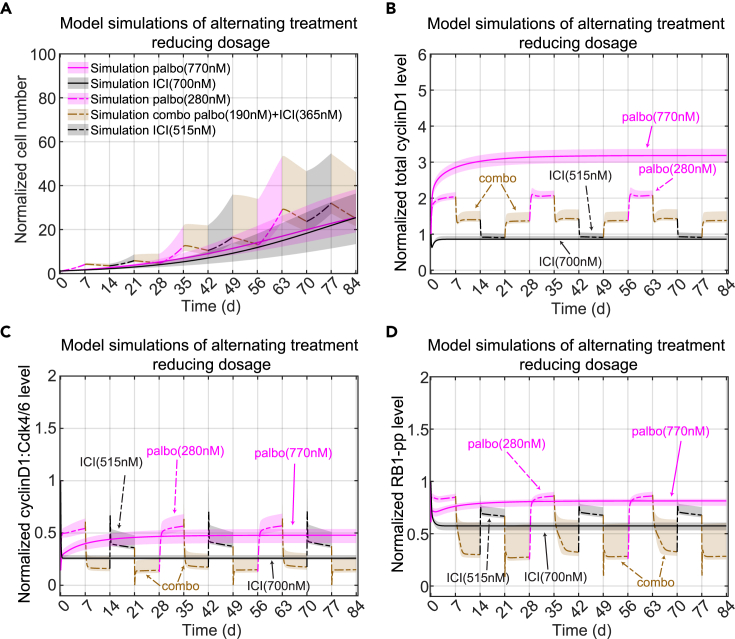
Estrogen receptor positive (ER+) breast cancer is responsive to a number of targeted therapies used clinically. Unfortunately, the continuous application of targeted therapy often results in resistance, driving the consideration of combination and alternating therapies. Toward this end, we developed a mathematical model that can simulate various mono, combination, and alternating therapies for ER + breast cancer cells at different doses over long time scales. The model is used to look for optimal drug combinations and predicts a significant synergism between Cdk4/6 inhibitors in combination with the anti-estrogen fulvestrant, which may help explain the clinical success of adding Cdk4/6 inhibitors to anti-estrogen therapy. Furthermore, the model is used to optimize an alternating treatment protocol so it works as well as monotherapy while using less total drug dose.

Keywords: Cancer; Cancer systems biology; Computational bioinformatics; Mathematical biosciences; Pharmacoinformatics.


Conflict of interest statement

The authors declare no competing interests.

Figures

None
Graphical abstract
Figure 1
Figure 1
Signaling diagram of the biological mechanism, model structure and model calibrations (A) Detailed reactions of the biological mechanism related to estrogen signaling and Cdk4/6 inhibition. Reversible binding reactions are represented by dots on the components and an arrow to the complex. Three dots represent degradation of a protein or the death of a cell. Arrows pointing from blank space to a protein or MCF7 cell represent production of the protein or proliferation of the cell. Arrows pointing from one protein to another protein represent phosphorylation or dephosphorylation of the protein. Lines pointing to other lines represent enhancement (arrow) or inhibition (blunt head) of the reactions. Treatments are colored red. The numbered biological mechanism consisting of the following process: 1. –E2 decreases estrogen; 2. E2 binds to ER; 3. ICI binds to ER; 3. E2:ER increases transcription of c-Myc; 5. E2:ER increases transcription of cyclinD1; 6. c-Myc inhibits transcription of p21; 7. CyclinD1 binds to Cdk4/6; 8. CyclinE binds to Cdk2; 9. p21 binds to cyclinD1:Cdk4/6; 10. p21 binds to cyclinE:Cdk2; 11. Palbociclib binds to Cdk4/6; 12. Abemaciclib binds to Cdk4/6; 13. Palbociclib binds to cyclinD1:Cdk4/6; 14. Abemaciclib binds to cyclinD1:Cdk4/6; 15. p21 binds to cyclinD1:Cdk4/6:palbociclib; 16. p21 binds to cyclinD1:Cdk4/6:abemaciclib; 17. Palbociclib binds to cyclinD1:Cdk4/6:p21; 18. Abemaciclib binds to cyclinD1:Cdk4/6:p21; 19. CyclinD1:Cdk4/6 phosphorylates RB1; 20. CyclinE:Cdk2 phosphorylates RB1-p; 21. RB1 binds to E2F; 22. RB1-p binds to E2F; 23. E2F up-regulates RB1; 24. E2F up-regulates itself; 25. E2F up-regulates c-Myc; 26. E2F up-regulates cyclinE; 27. E2F drives the G1-S cell cycle transition and proliferation; 28. Cell death. (STAR Methods). (B) Structure of the mathematical model, a simplified version of the biological mechanism in (A). (C) Model calibration to experimental data (mean ± s.e., n = 3) in E2 control condition. The experimental data are shown in red and the calibration simulation results are shown in yellow (solid line represents the lowest cost value simulation and the shaded regions contains the central 98% of the cohort simulations). (D) Model calibration to experimental data (mean ± s.e., n = 3) in –E2 condition. (E) Model calibration to experimental data (mean ± s.e., n = 3) in E2+ICI(100 nM) condition. (F) Model calibration to experimental data (mean ± s.e., n = 3) in E2+ICI(500 nM) condition. (G) Model calibration to experimental data (mean ± s.e., n = 3) in E2+palbo(250 nM) condition. (H) Model calibration to experimental data (mean ± s.e., n = 3) in E2+palbo(500 nM) condition. (I) Model calibration to experimental data (mean ± s.e., n = 3) in E2+palbo(1 μM) condition. (J) Model calibration to experimental data (mean ± s.e., n = 3) in –E2+ICI(100 nM) condition. (K) Model calibration to experimental data (mean ± s.e., n = 3) in E2+palbo(100 nM) condition.
Figure 2
Figure 2
Model calibration simulations compared to experimental data for abemaciclib treatments (A) Model calibration of normalized cell number to experimental data (mean ± s.e., n = 3) in E2+abema(300 nM) condition. The experimental data are shown in red and the calibration simulation results are shown in yellow (solid line represents the lowest cost value simulation and the shaded regions contains the central 98% of the cohort simulations). (B) Model calibration of normalized cell number to experimental data (mean ± s.e., n = 3) in E2+abema(500 nM) condition. (C) Model calibration of normalized c-Myc level to experimental data (mean ± s.e., n = 3) in E2+abema(500 nM) condition. (D) Model calibration of normalized RB1-pp level to experimental data (mean ± s.e., n = 3) in E2+abema(500 nM) condition.
Figure 3
Figure 3
Model calibration and prediction simulations of normalized cell number compared to experimental data for alternating treatments (A) Model calibration to experimental data (mean ± s.e., n = 3) of E2+palbo(250 nM) alternating with –E2 treatment. The experimental data is linked by dashed lines. The E2+palbo(250 nM) treatment is shown in purple and the –E2 condition in blue. The calibration simulation results are shown in the same colors as the experimental data with the solid line representing the lowest cost value simulation and the shaded regions containing the central 98% of the cohort simulations. (B) Model calibration to experimental data (mean ± s.e., n = 3) of E2+palbo(500 nM) alternating with E2+ICI(500 nM) treatment. E2+palbo(500 nM) treatment is shown in purple and E2+ICI(500 nM) in black. (C) Model prediction of experimental data (mean ± s.e., n = 3) for E2+palbo(750 nM) alternating with E2+ICI(500 nM). E2+palbo(750 nM) treatment is shown in purple and E2+ICI(500 nM) in black. The treatment started with E2+palbo(750 nM) with 7days then altered to E2+ICI(500 nM) with 7days. (D) Model prediction of experimental data (mean ± s.e., n = 3) for E2+palbo(750 nM) alternating with E2+palbo(750 nM)+ICI(500 nM) and E2+ICI(500 nM) treatment. E2+palbo(750 nM) condition is shown in purple, E2+palbo(750 nM)+ICI(500 nM) in brown and E2+ICI(500 nM) in black. The treatment started with E2+palbo(750 nM) for 6days, then changed to E2+palbo(750 nM)+ICI(500 nM) for 1day and then changed to E2+ICI(500 nM) for 7 days.
Figure 4
Figure 4
Model simulations of normalized cell number and protein level changes compared to experimental data for long time mono and alternating treatments (A) Model calibration to experimental data (mean ± s.e., n = 3) for E2+palbo(750 nM), E2+ICI(750 nM), and E2+palbo(750 nM) alternating with E2+ICI(750 nM) treatments. The experimental data are linked by dashed lines. In both the mono and alternating treatments, the E2+palbo(750 nM) condition is shown in purple and the E2+ICI(750 nM) condition in black. In the alternating treatment, each treatment period is 7days, starting with E2+palbo(750 nM). MCF7 cells are re-plated at 35days in the E2+palbo(750 nM) mono and alternating treatments. The normalized cell number from 35 to 70 days is relative to the number plated at 35days. The calibration simulation results are shown in same color as the experimental data with the solid line representing the lowest cost value simulation and the shaded regions containing the central 98% of the cohort simulations. (B) Model simulation of normalized total cyclinD1 level changes in the mono and alternating treatments shown in (A). (C) Model simulation of normalized cyclinD1:Cdk4/6 level changes in the mono and alternating treatments shown in (A). (D) Model simulation of normalized RB1-pp levels changes in the mono and alternating treatments shown in (A). (E) Bar plot of model simulation for total cyclinD1 level compared to experimental data (mean ± s.e., n = 3) in E2+palbo(750 nM) and E2+palbo(750 nM) alternating with E2+ICI(750 nM) treatments shown in (A). Total cyclinD1 levels are measured at 35 days and 70 days. The simulation results shown in yellow are the average results from all cohort simulations. Statistical testing was performed by one-way ANOVA (ns: non-significant; ∗: p < 0.05; ∗∗: p ≤ 0.01; ∗∗∗: p ≤ 0.001; ∗∗∗∗: p ≤ 0.0001). (F) Bar plot of model simulation and experimental results (mean ± s.e., n = 3) for total Cdk4 level changes in E2+palbo(750 nM) and E2+palbo(750 nM) alternating with E2+ICI(750 nM) treatments shown in (A). (G) Bar plot of model simulation and experimental results (mean ± s.e., n = 3) for total Cdk6 level changes in E2+palbo(750 nM) and E2+palbo(750 nM) alternating with E2+ICI(750 nM) treatments shown in (A). (H) Bar plot of model simulation and experimental results (mean ± s.e., n = 3) for total cyclinE level changes in E2+palbo(750 nM) and E2+palbo(750 nM) alternating with E2+ICI(750 nM) treatments shown in (A). (I) Bar plot of experimental results (mean ± s.e., n = 3) for total Cdk2 level changes in E2+palbo(750 nM) and E2+palbo(750 nM) altering with E2+ICI(750 nM) treatments shown in (A). (J) Bar plot of model calibration for total cyclinD1 level changes to experimental data (mean ± s.e., n = 3) in E2+palbo(750 nM) treatment. Total cyclinD1 levels are measured at 7days and 14days. The statistical testing is the same as (B). The simulation results are average results from all the cohort simulations.
Figure 5
Figure 5
Palbociclib dose response and gene expression profiles for cells after long time mono and alternating treatments (A) Palbociclib dose response normalized to vehicle on cells after 10 weeks palbociclib (750 nM) monotreatment and alternating treatment compared to parental MCF7 cells and MCF7 cells in 10 weeks E2 control condition. The alternating treatment is the same as Figure 4A, which is E2+palbo(750 nM) alternating with E2+ICI(750 nM). Each treatment period is 7days and starts with E2+palbo(750 nM). The cells in all conditions are re-plated at 35days and the dose responses are tested at 70 days. (B) Palbociclib dose response normalized to t = 0, otherwise same as (A). (C) The GR value of palbociclib dose response, otherwise same as (A). (D) Palbociclib dose response normalized to vehicle for cells after 12 months palbociclib (750 nM) monotreatment and alternating treatment compared to parental MCF7 cells. Treatments are the same as (A) except the alternation period is 1 month, the duration is extended to 12 months, and the dose responses are tested at 12 months. (E) Palbociclib dose response normalized to t = 0, otherwise same as (D). (F) The GR value of palbociclib dose response, otherwise same as (D). (G) Heatmap of gene expression profiles for cells after 10 weeks palbociclib monotreatment, cells after 10 weeks alternating treatment, parental MCF7 cells and cells cultured over 24 weeks in palbociclib (500 nM). The cells from palbociclib monotreatment and alternating treatment are the same as (A). (H) Principal component analysis of gene expression profiles on the same cells as (G). (PC1 vs. PC2). (I) Principal component analysis of gene expression profile on the same cells as (G). (PC1 vs. PC3). (J) Principal component analysis of gene expression profile on the same cells as (G). (PC2 vs. PC3). (K) Principal component analysis of gene expression profile on the same cells as (G). (PC1 vs. PC2 vs. PC3). (L) Gene Set Enrichment Analysis (GSEA) was performed on the same cells as (G). The C3 regulatory target gene sets in the Molecular Signatures Database (MSigDB) were used.
Figure 6
Figure 6
Model simulation of isobolograms among various treatment methods and experimental verifications (A) Illustration of the isobologram. Each blue hexagon represents a measurement point for mono or combination drug treatment effects. The lines joining the (interpolated) points of equal measured effect are isoboles, such as lines in the lower plot, which represent different interaction types: (1) Independence of effect; (2) Antagonism; (3) Additive; (4) Super-additive; (5) Sub-additive. (B) Model simulation of isobologram between ICI and E2 for the normalized cell number at 17days. Different colors of the isobole represents the different levels of normalized cell number. The solid line represents the lowest cost value simulation and the shaded regions contain the central 98% of the cohort simulations. (C) Model simulation of isobologram between palbociclib and E2 (high concentration) for the normalized cell number at 17days. (D) Model simulation of isobologram between palbociclib and E2 (low concentration) for the normalized cell number at 17days. (E) Model simulation of isobologram between abemaciclib and E2 (high concentration) for the normalized cell number at 17days. (F) Model simulation of isobologram between abemaciclib and E2 (low concentration) for the normalized cell number at 17days. (G) Model simulation of isobologram between palbociclib and abemaciclib for the normalized cell number at 17days. (H) Model simulation of isobologram between palbociclib and ICI for the normalized cell number at 17days. (I) Model simulation of isobologram between abemaciclib and ICI for the normalized cell number at 17days. (J) Boxplot of the model predictions and experimental verifications of normalized cell number showing the synergism between palbociclib and ICI. The doses of drug combinations used in the experiment are marked by the blue hexagons in (H). The prediction results shown in purple are from all cohort simulation results. Statistical testing was performed by two-way ANOVA (ns: non-significant; ∗: p < 0.05; ∗∗: p ≤ 0.01; ∗∗∗: p ≤ 0.001; ∗∗∗∗: p ≤ 0.0001). Center line on each box is the median. The bottom and top lines on each box are the 25th and 75th percentiles, respectively. The whiskers are maximum and minimum values without considering outliers. Data points are considered outliers if they are more than 1.5× IQR (interquartile range) below the 25th percentile or above the 75th percentile. (K) Boxplot of the model predictions and experimental verifications of normalized cell number showing the synergism between abemaciclib and ICI. The doses of drug combinations used in the experiment are marked by the blue hexagons in (I). The prediction results shown in purple are from all cohort simulation results. The statistical testing used and explanation of the boxplot are the same as (J).
Figure 7
Figure 7
Optimal treatment design using the model (A) Proposed Alternating treatment to reduce total drug dosage. E2+palbo(770 nM) monotreatment is shown in purple with a solid line. E2+ICI(700 nM) monotreatment is shown in black with a solid line. For the alternating treatment, each treatment period is 7days. In a 28 days cycle, the alternation starts with E2+palbo(280 nM) shown in purple with a dashed line, then changes to a combination treatment of E2+palbo(190 nM)+ICI(365 nM) shown in a brown dashed line, then changes to E2+ICI(515 nM) shown in a black dashed line, then changes to the combination treatment again. The cycle is repeated 3 times for a total of 84 days. The solid and dashed lines represent the lowest cost value simulation and the shaded regions contain the central 98% of the cohort simulations. (B) Model simulation of normalized total cyclinD1 level changes in the proposed alternating treatments shown in (A). The lines and shaded regions have the same meaning as (A). (C) Model simulation of normalized cyclinD1:Cdk4/6 level changes in the proposed alternating treatment shown in (A). (D) Model simulation of normalized RB1-pp level changes in the proposed alternating treatment shown in (A).

Similar articles

Cited by

References

    1. Siegel R.L., Miller K.D., Fuchs H.E., Jemal A. Cancer statistics, 2022. CA. Cancer J. Clin. 2022;72:7–33. doi: 10.3322/caac.21708. - DOI - PubMed
    1. Özdemir B.C., Sflomos G., Brisken C. The challenges of modeling hormone receptor-positive breast cancer in mice. Endocr. Relat. Cancer. 2018;25:R319–R330. doi: 10.1530/ERC-18-0063. - DOI - PubMed
    1. Chia Y.H., Ellis M.J., Ma C.X. Neoadjuvant endocrine therapy in primary breast cancer: indications and use as a research tool. Br. J. Cancer. 2010;103:759–764. doi: 10.1038/sj.bjc.6605845. - DOI - PMC - PubMed
    1. Tremont A., Lu J., Cole J.T. Endocrine therapy for early breast cancer: updated review. Ochsner J. 2017;17:405–411. - PMC - PubMed
    1. Xi J., Ma C.X. Sequencing endocrine therapy for metastatic breast cancer: what do we do after disease progression on a CDK4/6 inhibitor? Curr. Oncol. Rep. 2020;22:57. doi: 10.1007/s11912-020-00917-8. - DOI - PubMed