. 2023 Mar-Apr;33(2):93-100.
doi: 10.4103/ijn.ijn_521_21. Epub 2023 Feb 20.

Effects of the mTOR Pathway on the Balance of Th2/Treg Cells in Children with Idiopathic Nephrotic Syndrome

Affiliations

Effects of the mTOR Pathway on the Balance of Th2/Treg Cells in Children with Idiopathic Nephrotic Syndrome

Fen Fen Ni et al. Indian J Nephrol. 2023 Mar-Apr.

Abstract

Introduction: Immune dysfunction contributes to the progression of idiopathic nephrotic syndrome (INS), but the details of the pathogenesis of progression remain unknown. This study of children with INS investigated the relationship of activation of the mechanistic target of rapamycin (mTOR) pathway (PI3K/AKT/mTOR/p70S6K) with the levels of T helper 2/regulatory T (Th2/Treg) cells.

Materials and methods: Twenty children with active INS (before steroid treatment), 20 children with remitting INS (INS-R, after steroid treatment), and 20 healthy control children (Ctrl) were enrolled. The levels of Th2/Treg cells in their peripheral circulatory systems were measured using flow cytometry, and the concentration of interleukin (IL)-4 was determined using a cytometric bead array (CBA). The levels of PI3K, AKT, mTOR, p70S6K, and transcription factors associated with Th2/Treg cells were measured using real-time polymerase chain reaction.

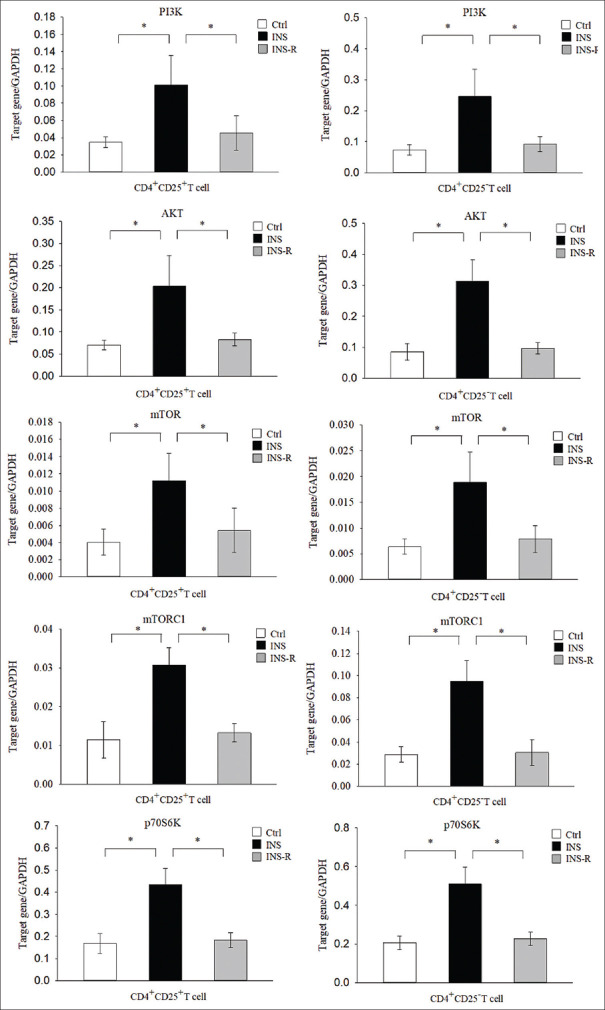
Results: The INS group had a greater proportion of circulating Th2 cells; level of IL-4 protein; and levels of GATA, PI3K, AKT, mTOR, and p70S6K mRNAs than the Ctrl group (all P < 0.05), but a lower proportion of circulating Tregs and expression of Foxp3 (both P < 0.05). Patients in the INS-R group had normalization of these markers (all P < 0.05). Patients in the INS group had negative correlation in the percentage of Treg cells with Th2 cells and with IL-4 level and a negative correlation in the levels of GATA3 and Foxp3 mRNAs.

Conclusions: Patients with active INS had an imbalance of Th2/Treg cells, which might result from the aberrant signaling of the mTOR pathway (PI3K/AKT/mTOR/p70S6K).

Keywords: Idiopathic nephrotic syndrome; Th2 cells; Treg cells; mTOR pathway.


Conflict of interest statement

There are no conflicts of interest.

Figures

Figure 1
Figure 1
Proportion of circulating Th2 and CD4+CD25+Foxp3+ Treg cells in the three groups. (a) Flow cytometric analysis of Th2 cells. (b) Flow cytometric analysis of CD4+CD25+Foxp3+ Treg cells. (c and d) Percentages of Th2 cells and CD4+CD25+Foxp3+ Treg cells. Here and below: All data are shown as mean ± SD; *P < 0.05 and **P > 0.05. Ctrl, n = 20, INS, n = 20, and INS-R, n = 20. Ctrl = healthy control, INS = active phase idiopathic nephrotic syndrome, INS-R = remission phase INS, SD = standard deviation, Th2 = T helper type 2, Treg cells = regulatory T cells
Figure 2
Figure 2
Expression of Th2-associated factors and Treg transcription factors in the three groups. GATA3 and Treg-related factor Foxp3 were determined by real-time PCR using GAPDH as an endogenous reference. IL-4 concentration was measured using a CBA assay. CBS = cytometric bead array, IL-4 = interleukin-4, PCR = polymerase chain reaction, Th2 = T helper type 2, Treg cells = regulatory T cells
Figure 3
Figure 3
(a) Correlation of Treg cells with Th2cells; (b) Correlation of Treg cells with IL-4 concentration; (c) Correlation of Foxp3 wtih GATA3 mRNAs in the INS group. Data were analyzed by Pearson correlation analysis. IL-4 = interleukin-4, INS = idiopathicnephrotic syndrome, Th2 = T helper type2, Treg cells = regulatory T cells
Figure 4
Figure 4
Expression of mTOR signaling molecules in the three groups. Expression of mTOR signaling molecules (PI3K, AKT, mTOR, mTORC1, and p70S6K) was measured in purified CD4+CD25+ cells and CD4+CD25 T cells using real-time PCR with GAPDH as an endogenous reference. mTOR = mechanistic target of rapamycin, PCR = polymerase chain reaction

Similar articles

Cited by

  • The Journey of Indian Journal of Nephrology.
    Duttagupta S. Duttagupta S. Indian J Nephrol. 2024 Jan-Feb;34(1):4-5. doi: 10.25259/IJN_48_2024. Epub 2024 Mar 30. Indian J Nephrol. 2024. PMID: 38645914 Free PMC article. No abstract available.

References

    1. Yang JY, Yao Y. [Analysis of 1268 patients with chronic renal failure in childhood: A report from 91 hospitals in China from 1990 to 2002] Zhonghua Er Ke Za Zhi. 2004;42:724–30. - PubMed
    1. Vivarelli M, Massella L, Ruggiero B, Emma F. Minimal change disease. Clin J Am Soc Nephrol. 2017;12:332–45. - PMC - PubMed
    1. Colucci M, Corpetti G, Emma F, Vivarelli M. Immunology of idiopathic nephrotic syndrome. Pediatr Nephrol. 2018;33:573–84. - PubMed
    1. Bertelli R, Bonanni A, Caridi G, Canepa A, Ghiggeri GM. Molecular and cellular mechanisms for proteinuria in minimal change disease. Front Med (Lausanne) 2018;5:170. - PMC - PubMed
    1. Guimarães FTL, Ferreira RN, Brito-Melo GEA, Rocha-Vieira E, de Fátima Pereira W, Pinheiro SVB, et al. Pediatric patients with steroid-sensitive nephrotic syndrome have higher expression of T regulatory lymphocytes in comparison to steroid-resistant disease. Front Pediatr. 2019;7:114. - PMC - PubMed