. 2023 May 10:13:1146431.
doi: 10.3389/fcimb.2023.1146431. eCollection 2023.

Role of serotype and virulence determinants of Streptococcus pyogenes biofilm bacteria in internalization and persistence in epithelial cells in vitro

Affiliations

Role of serotype and virulence determinants of Streptococcus pyogenes biofilm bacteria in internalization and persistence in epithelial cells in vitro

Feiruz Alamiri et al. Front Cell Infect Microbiol. .

Abstract

Streptococcus pyogenes causes a multitude of local and systemic infections, the most common being pharyngitis in children. Recurrent pharyngeal infections are common and are thought to be due to the re-emergence of intracellular GAS upon completion of antibiotic treatment. The role of colonizing biofilm bacteria in this process is not fully clear. Here, live respiratory epithelial cells were inoculated with broth-grown or biofilm bacteria of different M-types, as well as with isogenic mutants lacking common virulence factors. All M-types tested adhered to and were internalized into epithelial cells. Interestingly, internalization and persistence of planktonic bacteria varied significantly between strains, whereas biofilm bacteria were internalized in similar and higher numbers, and all strains persisted beyond 44 hours, showing a more homogenous phenotype. The M3 protein, but not the M1 or M5 proteins, was required for optimal uptake and persistence of both planktonic and biofilm bacteria inside cells. Moreover, the high expression of capsule and SLO inhibited cellular uptake and capsule expression was required for intracellular survival. Streptolysin S was required for optimal uptake and persistence of M3 planktonic bacteria, whereas SpeB improved intracellular survival of biofilm bacteria. Microscopy of internalized bacteria showed that planktonic bacteria were internalized in lower numbers as individual or small clumps of bacteria in the cytoplasm, whereas GAS biofilm bacteria displayed a pattern of perinuclear localization of bacterial aggregates that affected actin structure. Using inhibitors targeting cellular uptake pathways, we confirmed that planktonic GAS mainly uses a clathrin-mediated uptake pathway that also required actin and dynamin. Clathrin was not involved in biofilm internalization, but internalization required actin rearrangement and PI3 kinase activity, possibly suggesting macropinocytosis. Together these results provide a better understanding of the potential mechanisms of uptake and survival of various phenotypes of GAS bacteria relevant for colonization and recurrent infection.

Keywords: Streptococcus pyogenes; adherence; epithelial cells; internalization; localization; persistence; uptake pathways; virulence factors.


Conflict of interest statement

The authors declare that the research was conducted in the absence of any commercial or financial relationships that could be construed as a potential conflict of interest.

Figures

Figure 1
Figure 1
Bacterial growth, cell association, internalization and persistence and inflammatory response in respiratory epithelial cells exposed to Streptococcus pyogenes. Live respiratory epithelial (H292) cells were infected with S. pyogenes strain GAS-771 grown planktonically or as biofilms. (A) Cells were inoculated with bacteria at 34°C for 4 h without antibiotic treatment, or 2.5 h followed by antibiotic treatment for 1.5 h to eliminate extracellular bacteria. Bacterial growth in the culture supernatant (Supernatant, orange bars), total association to the cells (Association, green bars), or internalization levels (Internalization, purple bars) were assessed by determining the Log10 CFUs, 4 h post infection. P1 and B1 indicate inoculation of bacteria with planktonic (P) and biofilm (B) bacteria at a multiplicity of infection (MOI) of 1. The results represent mean data from four separate experiments ± standard deviation (SD) (n = 4). Differences in supernatant growth (orange), association (green), or internalization (purple), between planktonic and biofilm bacteria was compared using one-way ANOVA using Dunnett’s multiple comparison tests. (B) Persistence of intracellular planktonic (MOI 1; black line) or biofilm bacteria (MOIs of 0.025-1; blue to purple lines) was measured by assessing the Log10 CFU in lysates of antibiotic treated cells at 4, 7, 20, or 44 h post infection and displayed as mean data ± SD (n = 4 experiments). The elimination rates of intracellular bacteria were determined by linear regression analysis for Log10 CFU of intracellular bacteria over time (dotted lines from 0-20 h). As indicated, no significant difference was observed between the elimination rates of the various MOIs of biofilms. The significant difference in elimination rates between planktonic MOI 1 and biofilm MOI of 0.025 is shown to the right. (C) To assess the cell viability, the cytotoxicity percentage of antibiotic treated and uninfected cells (green line) or cells infected with planktonic (black line) or biofilm bacteria (purple line) at an MOI of 1, was determined by measuring the release of lactate dehydrogenase (LDH) into the culture supernatant during antibiotic treatment. Data is displayed as mean ± SD for n=9 experiments. Differences between untreated cells and planktonic bacteria or biofilm bacteria were compared using one-way ANOVA with Dunnett’s multiple comparison tests. Significance was displayed with black (planktonic) or purple (biofilms) stars. For all statistical analyses *P < 0.05, **P < 0.01, ***P < 0.001, ****P < 0.0001, and ns, non-significant difference.
Figure 2
Figure 2
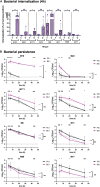
Bacterial internalization and persistence of different GAS serotypes in respiratory epithelial cells. Live respiratory epithelial (H292) cells were infected with S. pyogenes M1T1, M6, M11, M12, M18, M22, M77 or M89 grown planktonically or as biofilms. (A) Cells were inoculated with bacteria at 34°C for 2.5 h followed by antibiotic treatment for 1.5 h to eliminate extracellular bacteria or for 4 h without antibiotics to assess total cell association. Bacterial internalization and cell-association levels were assessed by determining the Log10 CFUs, 4 h post infection (data shown in Figure S2 ). Internalization was then presented in the graph as the percentage of cell-associated bacteria that were internalized for each experiment (purple). P and B indicate inoculation of bacteria with planktonic (P) or biofilm (B) bacteria at a multiplicity of infection (MOI) of 0.1. The results represent mean data from four separate experiments ± SD (n = 4) with individual data points presented in the graph. Differences in internalization between planktonic and biofilm bacteria for each M type was compared using one-way ANOVA using Dunnett’s multiple comparison test and is displayed on top of each bar. (B) Persistence of intracellular planktonic (black line) or biofilm (purple line) bacteria was measured by assessing the Log10 CFU in lysates of antibiotic treated cells at 4, 7, 20, or 44 h post infection and displayed as mean data ± SD (n = 4 experiment). P0.1 and B0.1 indicate inoculation of bacteria with planktonic (P) or biofilm (B) bacteria at a multiplicity of infection (MOI) of 0.1. The difference between internalization levels of planktonic and biofilm bacteria for each timepoint was evaluated using Student’s t-test (shown on top of each time point in black). The elimination rates of intracellular bacteria were determined by assessing the linear correlation between Log10 CFU of intracellular bacteria over time (dotted lines). Linear coefficients significantly different from zero are presented in purple or black stars next to each line. Significant differences in elimination rates between intracellular planktonic and biofilm bacteria is shown to the right of bracket in black. For all statistical analyses *P < 0.05, **P < 0.01, ***P < 0.001, ****P < 0.0001 and ns, non-significant difference.
Figure 3
Figure 3
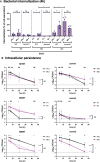
Role of the M protein in GAS bacterial internalization and persistence during respiratory epithelial cell infection. GAS M1 (SF370), M3 (GAS-771) and M5 (Manfredo) strains expressing (WT) or lacking the M protein (Δemm) and grown planktonically or as biofilms were used to infect live respiratory epithelial (H292) cells. (A) Cells were inoculated with bacteria at 34°C 2.5 h followed by antibiotic treatment for 1.5 h to eliminate extracellular bacteria or for 4 h without antibiotics to assess total cell association. Bacterial internalization and cell-association levels were assessed by determining the Log10 CFUs, 4 h post infection (data shown in Figure S3 ). Internalization was then presented in the graph as the percentage of cell-associated bacteria that were internalized for each experiment (purple). P1 (or P0.1) and B1 (or B0.1) represent planktonic (P) or biofilm (P) bacteria used at a multiplicity of infection (MOI) of 1 (or 0.1). The results represent mean data from four (or three in Δemm3) separate experiments ± SD. Differences internalization between planktonic and biofilm bacteria in each strain, or between WT and Δemm, was compared using one-way ANOVA using Dunnett’s multiple comparison tests and is displayed by stars in the graph. (B) Persistence of intracellular planktonic (black line) or biofilm (purple line) bacteria was measured by assessing the Log10 CFU in lysates of antibiotic treated cells at 4, 7, 20, or 44 h post infection and displayed as mean data ± SD (n = 4 experiments for all strains except n = 3 in Δemm3). Differences between internalization levels of planktonic and biofilm bacteria for each timepoint was evaluated using Student’s t-test (stars shown on top of each time point in black). The elimination rates of intracellular bacteria were determined by determining the linear correlation between Log10 CFU of intracellular bacteria over time (purple and black dotted lines for planktonic and biofilm bacteria, respectively). Linear coefficients significantly different from zero are presented in purple or black stars next to each line. Significant differences in elimination rates between intracellular planktonic and biofilm bacteria is shown to the right of bracket in black. For all statistical analyses *P < 0.05, **P < 0.01, ***P < 0.001, ****P < 0.0001 and ns, non-significant difference.
Figure 4
Figure 4
Role of virulence factors in GAS internalization and persistence during respiratory epithelial cell infection. To determine the role of virulence factors during GAS infection, M3 (GAS-771) strain expressing wild-type (WT) or lacking capsule (ΔhasA), SLO (Δslo), or both (ΔhasAΔslo), or SpeB (ΔspeB), or SLS (ΔsagA) grown planktonically or as biofilms, were used to infect live respiratory epithelial (H292) cells. (A) Cells were inoculated with bacteria at 34°C for 2.5 h followed by antibiotic treatment for 1.5 h to eliminate extracellular bacteria or for 4 h without antibiotics to assess total cell association. Bacterial internalization and cell-association levels were assessed by determining the Log10 CFUs, 4 h post infection (data shown in Figure S4 ). Internalization was then presented in the graph as the percentage of cell-associated bacteria that were internalized for each experiment (purple). P1 (or P0.1) and B1 (or B0.1) represent planktonic (P) and biofilm (B) bacteria a multiplicity of infection (MOI) of 1 (or 0.1). The results represent mean data from three (in ΔspeB, or ΔsagA), four (in ΔhasA, Δslo, or ΔhasAΔslo), or seven (M3WT), separate experiments ± SD (n = 3 experiments in ΔspeB, or ΔsagA, or n = 4 experiments in ΔhasA, Δslo, or ΔhasAΔslo, or n = 7 experiments in M3WT). Differences internalization between planktonic and biofilm bacteria in WT and mutant strains was compared using one-way ANOVA using Dunnett’s multiple comparison tests and are shown on top of each bar, and the difference between planktonic and biofilm bacteria is shown on top of the black line. (B) Persistence of intracellular planktonic (black line) or biofilm (purple line) bacteria was measured by assessing the Log10 CFU in lysates of antibiotic treated cells 4, 7, 20, or 44 h post infection and displayed as mean data ± SD (n = 3 experiments in ΔspeB, or ΔsagA, or n = 4 experiments in ΔhasA, Δslo, or ΔhasAΔslo, or n = 7 experiments in M3WT). Significant differences between internalization levels of planktonic and biofilm bacteria for each timepoint was evaluated using Student’s t-test (shown on top of each time point in black). The elimination rates of intracellular bacteria were determined by assessing the linear correlation between Log10 CFU of intracellular bacteria over time (dotted lines). Linear coefficients significantly different from zero are presented in purple or black stars next to each line. The significant difference in elimination rates between intracellular planktonic and biofilm bacteria is shown to the right of bracket in black. For all statistical analyses *P < 0.05, **P < 0.01, ***P < 0.001, ****P < 0.0001 and ns, non-significant difference.
Figure 5
Figure 5
Co-localization of intracellular non-encapsulated GAS bacteria in respiratory epithelial cells. To localize intracellular planktonic or biofilm bacteria in GAS, a GFP-expressing M3 (GAS-771) strain lacking capsule (ΔhasA-GFP) was grown planktonically or as a biofilm and used to infect live respiratory epithelial H292 cells at an MOI of 10 for 4 h and then fixed with 4% PFA. To visualize cell structures, samples were stained with Hoechst (DNA; blue) and AlexaFluor 561 conjugated phalloidin (actin; orange). Extracellular bacteria were stained with an anti-GAS antibody and counterstained with anti-goat antibody conjugated with AlexaFluor 647 (GAS; red) and indicated using yellow arrows whereas intracellular bacteria (green only) are indicated using white arrows. Fluorescence was visualized using a Nikon Ti2 Eclipse microscope and NIS-Elements software. Images are representative 60X magnification images from multiple locations selected from a 3x3 area imaged at 20X magnification for each sample. Z-stacks were collected in each instance, and deconvolved center planes are shown. Size bar = 10 µm.
Figure 6
Figure 6
Cellular uptake pathways utilized by intracellular GAS bacteria in respiratory epithelial cells. To determine the cellular uptake pathways utilized during GAS internalization, live respiratory epithelial (H292) cells were pre-treated with inhibitors targeting proteins involved in uptake pathways, including cytochalasin D (actin, 50 μg/ml), nocodazole (microtubulin, 10 μg/ml), pitstop 2 (clathrin-mediated uptake, 11.8 μg/ml), dynasore (dynamin, 25.7 μg/ml), nystatin (lipid-raft mediated uptake, 7.5 μg/ml) or wortmannin (macropinocytosis, 100 µg/ml) for 1h. Inhibitor- or non-treated cells (No inhibitor) were inoculated with planktonic (A) or biofilm (B) S. pyogenes GAS-771 in RPMI supplemented with 2% serum (please observe the different scales of the Y-axis). Cells were inoculated with bacteria at 34°C for 4 h without antibiotic treatment, or 2.5 h followed by antibiotic treatment for 1.5 h to eliminate extracellular bacteria. Bacterial internalization and cell-association levels were assessed by determining the Log10 CFUs, 4 h post infection (data shown in Figure S4 ). Internalization was then presented in the graph as the percentage of cell-associated bacteria that were internalized for each experiment (purple). The dotted line represents the internalization level for the no inhibitor control (0.34% for planktonic organisms and 3.74% for biofilm bacteria). One-way ANOVA using Dunnett’s multiple comparison tests were used to compare the means of inhibitor treated cells as compared to the non-treated cells ± SD (n = 3 to 7 experiments). For the internalization experiments each individual significance level is displayed in the figure. For all statistical analyses *P < 0.05, **P < 0.01, and ns, non-significant difference. .

References

    1. Abbot E. L., Smith W. D., Siou G. P., Chiriboga C., Smith R. J., Wilson J. A., et al. . (2007). Pili mediate specific adhesion of streptococcus pyogenes to human tonsil and skin. Cell Microbiol. 9, 1822–1833. doi: 10.1111/j.1462-5822.2007.00918.x - DOI - PubMed
    1. Alamiri F., Chao Y., Baumgarten M., Riesbeck K., Hakansson A. P. (2020). A role of epithelial cells and virulence factors in biofilm formation by streptococcus pyogenes In vitro . Infect. Immun. 88, e00133–e00120. doi: 10.1128/IAI.00133-20 - DOI - PMC - PubMed
    1. Alamiri F., Riesbeck K., Hakansson A. P. (2019). HAMLET, a protein complex from human milk has bactericidal activity and enhances the activity of antibiotics against pathogenic streptococci. Antimicrob. Agents Chemother. 63, e01193–e01119. doi: 10.1128/AAC.01193-19 - DOI - PMC - PubMed
    1. Anthony B. F., Kaplan E. L., Wannamaker L. W., Chapman S. S. (1976). The dynamics of streptococcal infections in a defined population of children: serotypes associated with skin and respiratory infections. Am. J. Epidemiol. 104, 652–666. doi: 10.1093/oxfordjournals.aje.a112344 - DOI - PubMed
    1. Ashbaugh C. D., Moser T. J., Shearer M. H., White G. L., Kennedy R. C., Wessels M. R. (2000). Bacterial determinants of persistent throat colonization and the associated immune response in a primate model of human group a streptococcal pharyngeal infection. Cell Microbiol. 2, 283–292. doi: 10.1046/j.1462-5822.2000.00050.x - DOI - PubMed

Publication types