. 2023 Jun:37:100702.
doi: 10.1016/j.gfs.2023.100702. Epub 2023 May 22.

COVID-19 mobility restrictions and stay-at-home behaviour in 2020 were associated with higher retail food prices worldwide

Affiliations

COVID-19 mobility restrictions and stay-at-home behaviour in 2020 were associated with higher retail food prices worldwide

Jessica Wallingford et al. Glob Food Sec. 2023 Jun.

Abstract

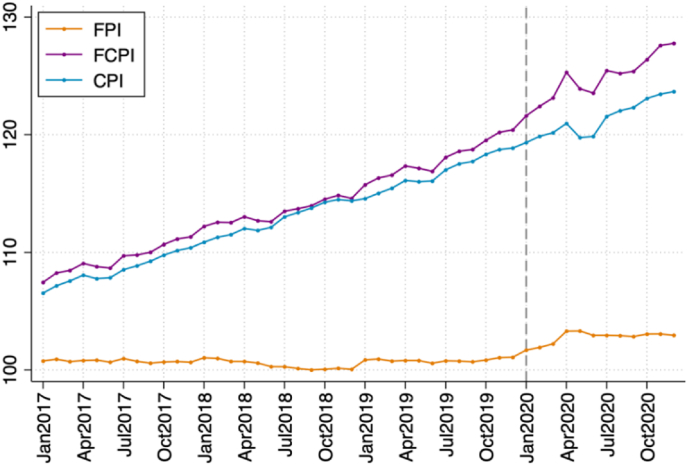
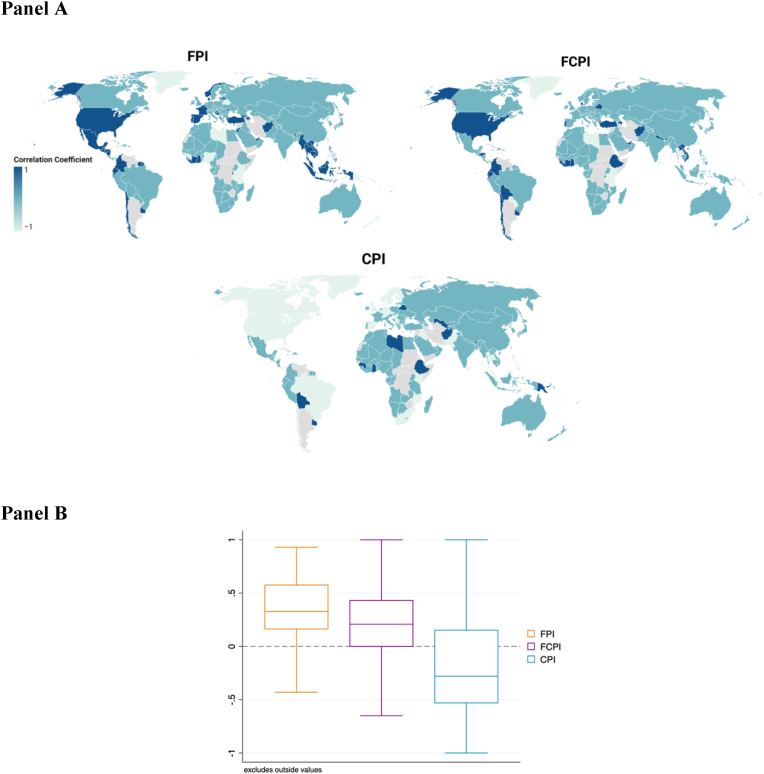
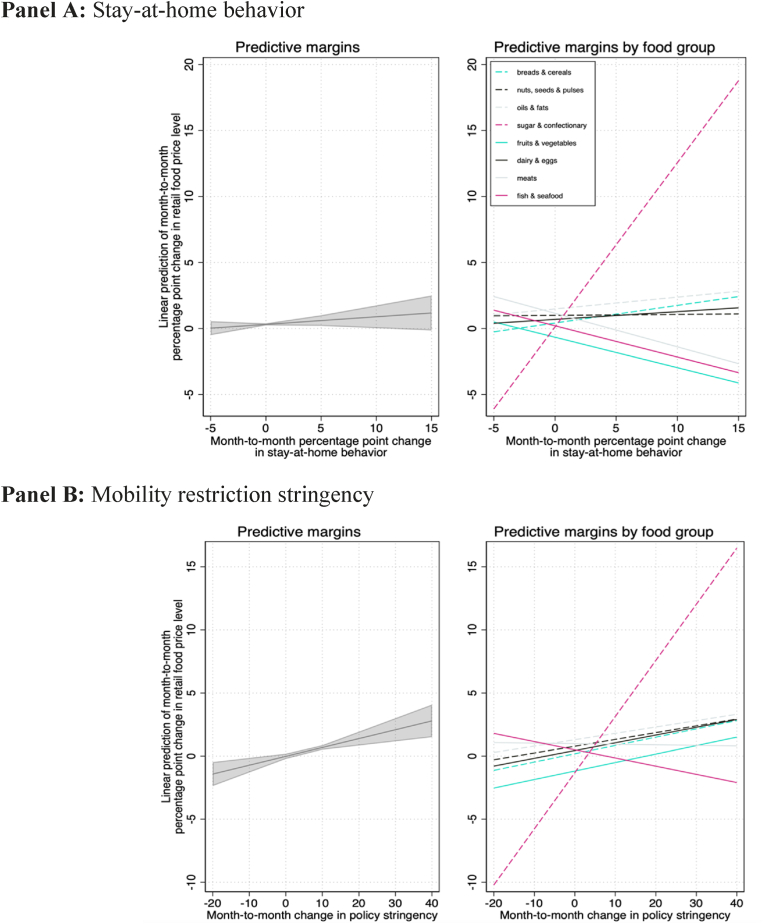
COVID-19 policy responses have included mobility restrictions, and many people have chosen to stay at home to avoid exposure. These actions have ambiguous impacts on food prices, lowering demand for food away from home and perishables, while increasing supply costs for items where workers are most affected by the pandemic. We use evidence from 160 countries to identify the net direction and magnitude of association between countries' real cost of all food and mobility restriction stringency. We investigate the deviation of each month's price level in 2020 from that month's average price level during the previous three years and find that an increase in mobility restriction stringency from no restrictions to most restrictive is associated with an increase in the real cost of all food of more than one percentage point across all models. We then examine the relationship between retail food price levels by food group and stay-at-home behaviour around markets in 36 countries and find positive associations for non-perishables, dairy and eggs.

Keywords: Affordability; Diet costs; Food security; Pandemic response.


Conflict of interest statement

The authors declare the following financial interests/personal relationships which may be considered as potential competing interests: William A. Masters reports financial support and article publishing charges were provided by Bill & Melinda Gates Foundation through the Food Prices for Nutrition Project (INV-016158), with additional financial support from the Foreign Commonwealth & Development Office of the United Kingdom.

Figures

Fig. 1
Fig. 1
Price change scenarios in response to supply and demand shifts associated with the COVID-19 pandemic. Notes: Solid blue and orange lines represent original supply and demand functions, and dashed blue and orange lines represent shifted supply and demand functions. Grey circles represent the initial equilibrium between supply and demand, while purple circles represent the new equilibrium following shifts in supply and demand. (For interpretation of the references to colour in this figure legend, the reader is referred to the Web version of this article.)
Fig. 2
Fig. 2
Geographical coverage of price data, 2020 Notes: Panel A shows the 160 countries included in our national-level analysis, with darker shades of blue indicating a larger number of months during the year 2020 for which complete price index data, stringency data, and COVID-19 case and mortality data were available. Countries in grey were not included in the national-level analysis. Panel B shows the 395 market locations monitored by early warning systems and included in our market-level analysis.
Fig. 3
Fig. 3
Global average price index levels for food and other consumer goods, January 2017 to December 2020 Notes: Consumer price index data were obtained from the Food and Agriculture Organization of the United Nations on March 17, 2022 and include each country's national consumer price index (CPI), food and non-alcoholic beverage consumer price index (FCPI), and real food price level (FPI) reported monthly from January 2017 to December 2020 (2015 = 100). Values displayed represent the average monthly price levels across 160 countries.
Fig. 4
Fig. 4
Correlations between mobility restriction stringency and the deviation of each month's price level in 2020 from the average 2017–2019 price level in the same country and month. Notes: Panel A displays Spearman's rank correlation coefficients calculated for each country and for each price index (FPI, FCPI, and CPI). Darker shades of blue indicate correlation coefficients closer to positive 1. Panel B displays a box plot to show the spread of correlation coefficients for the FPI, FCPI, and CPI. Monthly national consumer price index data were obtained from the Food and Agriculture Organization of the United Nations on March 17, 2022, and stringency index data were obtained from the Oxford COVID-19 Government Response Tracker on April 28, 2021.
Fig. 5
Fig. 5
OLS regression estimates of coefficients for mobility restriction stringency Notes: Data shown are coefficients, 95 percent confidence intervals, and p-values for the mobility restriction stringency term from six different OLS regressions run for each price index (FPI, FCPI, and CPI). All models include country fixed effects and country time trends, and use robust standard errors clustered at the country level.
Fig. 6
Fig. 6
Stay-at-home behavior, mobility restriction stringency, COVID-19 cases and mortality, and retail food price levels across 395 markets in 36 countries, 2020 Notes: Panel A shows monthly averages for stay-at-home behaviour (obtained from Google's COVID-19 Community Mobility Trends, https://www.google.com/covid19/mobility), mobility restriction stringency (obtained from the Oxford COVID-19 Government Response Tracker Stringency Index, https://covidtracker.bsg.ox.ac.uk), and new confirmed COVID-19 cases and mortality per million (obtained from Our World in Data's COVID-19 Data Explorer, https://ourworldindata.org/coronavirus) from February to December 2020. Panel B shows monthly average price levels during 2020, by food group, for food items in markets monitored by early warning systems, including the Global Information and Early Warning System (GIEWS) from the Food and Agriculture Organization (FAO) (http://www.fao.org/giews/en/), the Famine Early Warning System Network (FEWS NET) funded by USAID (https://fews.net/), and the Vulnerability Analysis and Mapping (VAM) system from the World Food Programme (WFP) (https://data.humdata.org/dataset/global-wfp-food-prices). Dashed lines indicate less perishable food groups, while solid lines indicate more perishable groups. Values represent monthly levels averaged across 395 markets in 36 countries.
Fig. 7
Fig. 7
Predictive margins from OLS regression of month-to-month change in stay-at-home behaviour or mobility restriction stringency on month-to-month change in food price level. Notes: Data shown are predictive margins from OLS regressions of month-to-month change in stay-at-home behavior (Panel A) or month-to-month change in mobility restriction stringency (Panel B) on month-to-month change in food price level. Visualizations on the left show predictive margins from OLS regressions with all food items pooled together, while visualizations on the right show predictive margins by food group. Dashed lines indicate less perishable food groups, while solid lines indicate more perishable groups. Models control for log(x+1)-transformed COVID-19 case counts and mortality per million per month and include market fixed effects, month fixed effects, and county time trends, and use robust standard errors clustered at the market level. Positive values along the x-axis indicate more time spent at home (Panel A) or higher stringency (Panel B).

References

    1. Adewopo J.B., Solano-Hermosilla G., Colen L., Micale F. Using crowd-sourced data for real-time monitoring of food prices during the COVID-19 pandemic: insights from a pilot project in northern Nigeria. Global Food Secur. 2021;29 - PMC - PubMed
    1. Agyei S.K., Isshaq Z., Frimpong S., Adam A.M., Bossman A., Asiamah O. COVID-19 and food prices in sub-Saharan Africa. Afr. Dev. Rev. 2021;33(S1):S102–S113. - PMC - PubMed
    1. Akter S. The impact of COVID-19 related ‘stay-at-home’ restrictions on food prices in Europe: findings from a preliminary analysis. Food Secur. 2020;12(4):719–725. - PMC - PubMed
    1. Baker A., Larcker D.F., Wang C.C.Y. How much should we trust staggered difference-in-difference estimates? J. Financ. Econ. 2022;144(2):370–395.
    1. Bai Y., Alemu R., Block S.A., Headey D., Masters W.A. Cost and affordability of nutritious diets at retail prices: evidence from 177 countries. Food Pol. 2021;99 - PMC - PubMed

LinkOut - more resources