. 2023 May 26;9(21):eabq7806.
doi: 10.1126/sciadv.abq7806. Epub 2023 May 26.

Microglia mediate neurocognitive deficits by eliminating C1q-tagged synapses in sepsis-associated encephalopathy

Affiliations

Microglia mediate neurocognitive deficits by eliminating C1q-tagged synapses in sepsis-associated encephalopathy

Ha-Yeun Chung et al. Sci Adv. .

Abstract

Sepsis-associated encephalopathy (SAE) is a severe and frequent complication of sepsis causing delirium, coma, and long-term cognitive dysfunction. We identified microglia and C1q complement activation in hippocampal autopsy tissue of patients with sepsis and increased C1q-mediated synaptic pruning in a murine polymicrobial sepsis model. Unbiased transcriptomics of hippocampal tissue and isolated microglia derived from septic mice revealed an involvement of the innate immune system, complement activation, and up-regulation of lysosomal pathways during SAE in parallel to neuronal and synaptic damage. Microglial engulfment of C1q-tagged synapses could be prevented by stereotactic intrahippocampal injection of a specific C1q-blocking antibody. Pharmacologically targeting microglia by PLX5622, a CSF1-R inhibitor, reduced C1q levels and the number of C1q-tagged synapses, protected from neuronal damage and synapse loss, and improved neurocognitive outcome. Thus, we identified complement-dependent synaptic pruning by microglia as a crucial pathomechanism for the development of neuronal defects during SAE.


Figures
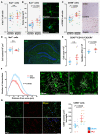
Fig. 1.
Fig. 1.. Microglia activation in the acute phase of SAE.
(A) Ratio between Iba1-positive microglia and all cells per image in human hippocampal postmortem tissue (n = 9 per group; two-tailed Student’s t test). (B) Analysis of soma size of Iba1-positive microglia in human CA1 hippocampal postmortem tissue (control, n = 4 and sepsis: n = 5; 3 to 16 images per patient; two-tailed Student’s t test); representative image of microglia in control and patients with sepsis. Scale bar, 10 μm. (C) Ratio between CD68+ cells and all cells per image in hippocampus of patients with sepsis compared to control (n = 9 per group; Mann-Whitney test); representative image of CD68+ staining. Scale bars, 50 μm. (D) Cell count of Iba1-positive microglia in mice 3 days following sepsis induction (mice, n = 4 per group; images, n = 3 per mouse; two-tailed Student’s t test); representative confocal image of the hippocampus (sagittal section) stained with Iba1 and DAPI (4′,6-diamidino-2-phenylindole). Scale bar, 500 μm. (E) FACS analysis of CD45lowCD11b+CX3CR1+ cells showing absolute cell count and geometric mean (GeoMean) of the forward scatter (FSC) representing the cell size (sham, n = 7; PCI, n = 10; two-tailed Student’s t test). (F) Sholl analysis of hippocampal Iba1+ cells in sham- and PCI-treated mice at day 3 after sepsis induction [n = 4 per group; two-way analysis of variance (ANOVA) repeated measures]; representative image with highlighted ramifications of microglia processes in sham and sepsis mice. Scale bar, 50 μm. (G) Immunofluorescence staining of Iba1 and CD68 in hippocampus. Scale bar, 20 μm. Quantification of CD68 volume per microglia (n = 5 per group; images, n = 2 per mouse; two-tailed Student’s t test). Data are presented as means ± SEM. Individual values are presented as small dots, and each circle represents an average of one mouse; individual values and averages are color coded. Gray shaded background [in (A to C)] indicates human data. n.s., not significant.
Fig. 2.
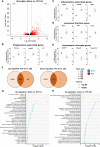
Fig. 2.. Short- and long-term microglia transcriptional changes in SAE.
(A) Volcano plot of gene expression comparing microglia isolated of sham- and PCI-treated animals showing 1392 up-regulated (log2FC >1, Padj < 0.05) and 1031 (log2FC < −1, Padj < 0.05) down-regulated genes at day 3 following sepsis induction (n = 4 per group). (B to E) Expression of DEGs associated to phagocytosis, inflammation, lysosomal function, and homeostasis of isolated microglia after PCI- and sham-treated animals at day 3 following sepsis induction (n = 4 per group). (F) Venn diagram of DEGs in microglia comparing day 3 (n = 4 per group) and day 20 (n = 3 per group) following sepsis induction. (G and H) Enrichment analysis of top 25 up-regulated GO-BP terms and top 5 up-regulated KEGG pathways comparing PCI versus sham at day 3 (G) (n = 4, Padj < 0.05) and day 20 (H) (n = 3, Padj < 0.05) following sepsis induction. Data are presented as means ± SEM. Each circle represents one mouse.
Fig. 3.
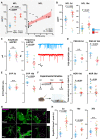
Fig. 3.. Neuronal damage and microglia-induced synaptic pruning in SAE.
(A) Measurement of Nfl in control patients and patients with mild or severe sepsis (n = 10 per group; one-way ANOVA with Bonferroni’s multiple comparisons). Correlation analysis between serum Nfl and SOFA score (n = 30; Pearson correlation). (B) Measurement of Nfl in serum of PCI- and sham-treated animals at day 3 [n = 19 per group; Mann-Whitney U (MWU) test] and day 10 (sham, n = 21; PCI, n = 18; two-tailed Student’s t test) following sepsis induction as a marker of neuronal injury. (C) Patch-clamp recordings of hippocampal CA1 pyramidal cells and analyses of mEPSC in sham- and PCI-treated animals 8 weeks after PCI (n = 9 to 10 cells per group; MWU test). (D to E) Quantitative analysis of hippocampal pre- [synaptophysin (SYP)] and postsynaptic (PSD-95) proteins at day 3 (sham, n = 7; PCI, n = 7; two-tailed Student’s t test) and day 10 (n = 8 per group; two-tailed Student’s t test) comparing sham- and PCI-treated animals. (F) NOR test at day 10 (sham, n = 7; PCI, n = 11; two-tailed Student’s t test) and day 30 (sham, n = 7; PCI, n = 10; two-tailed Student’s t test) in sham- and PCI-treated animals. (G) Analysis of microglia-induced synaptic pruning. Representative three-dimensional (3D) reconstruction of microglia Airyscan imaging (left) (middle, higher magnification). Arrows indicate engulfed Homer1 spots, and circles show microglia attached Homer1 spots. Right: Individual image sections. Scale bar, 10 μm. (H) Quantitative analysis of microglia engulfed Homer1 spots on day 3 (n = 13; two-tailed Student’s t test), on day 10 (n = 10; MWU test), and on day 38 (n = 15; two-tailed Student’s t test) following PCI induction or sham injection. Data are presented as means ± SEM. Gray shaded background [in (A)] indicates human data.
Fig. 4.
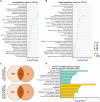
Fig. 4.. Transcriptional profile of hippocampal tissue indicating neuroinflammation and synaptic damage.
(A and B) Enrichment analysis of top 25 up-regulated GO-BP terms and top 5 up-regulated KEGG pathways for PCI versus sham (n = 4 Padj < 0.05) in whole hippocampus tissue at day 3 following sepsis induction. (C) Venn diagram of DEGs of hippocampal tissue comparing day 3 (n = 4 per group) and day 10 (n = 4 per group) following sepsis induction. (D) Top nine GO-BP and top nine KEGG pathway analysis of 95 up-regulated intersection genes comparing PCI day 3 (n = 4, Padj < 0.05) and PCI day 10 (n = 3, Padj < 0.05) following sepsis induction.
Fig. 5.
Fig. 5.. Involvement of complement factor C1q in SAE.
(A) Expression heatmap of top 40 DEGs of hippocampal tissue in PCI- and sham-treated animals at day 3 (n = 4, Padj < 0.05). The color scale represents the gene-wise z score calculated from normalized gene expression levels. (B) Expression of DEGs encoding for complement factor C1q in hippocampal tissue of PCI- and sham-treated animals at day 3 following sepsis induction. (C) STRING network showing protein-protein interactions of DEGs in hippocampal tissue associated with complement factor C1q in PCI- and sham-treated animals at day 3 following sepsis (n = 4; medium-confidence cutoff of 0.4).
Fig. 6.
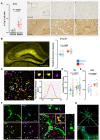
Fig. 6.. Sepsis leads to synapse tagging by complement factor C1q and its opsonization by microglia.
(A) C1q staining in human postmortem hippocampus (I, CA1; II, gyrus dentatus) comparing sepsis and control patients (n = 9 per group; Mann-Whitney test). Representative images showing cell associated (arrow) and neuronal C1q staining patterns and a diffuse staining of the parenchyma (asterisk). Scale bars, 200 μm (left), 50 μm (insets). (B) C1q expression in the hippocampus of PCI- and sham-treated animals at day 3 following sepsis. Representative confocal image of the hippocampus (PCI animal; midsagittal section) and analysis of C1q immunofluorescence (sham, n = 7; PCI, n = 9; images, n = 3 per mouse; two-tailed Student’s t test). Scale bar, 500 μm. (C) Colocalization analysis of C1q and Homer1 at (D) day 3 (3d; sham, n = 13; PCI, n = 16; images, n = 5 per mouse; two-tailed Student’s t test) and (E) day 10 (10d; n = 5 per group; images, n = 5 per mouse; two-tailed Student’s t test) in the hippocampus of sham- and PCI-treated animals. Arrows indicated C1q-tagged synapses. Scale bars, 1 μm and 200 nm (inset). (F) Representative high-resolution Airyscan image of Iba1, CD68, C1q, and Homer1 showing a colocalization of C1q-tagged synapses in the lysosomes of a microglia after PCI; the inset shows only C1q/Homer 1 colocalization. Scale bars, 2 μm and 1 μm (inset). (G) 3D reconstruction of microglia shown in (F). green, microglia; blue, lysosome; yellow, C1q; magenta, Homer1. Note the localization of C1q-tagged Homer1 spots within microglial lysosomes. Scale bar, 8 μm. Data are presented as means ± SEM. Gray shaded background [in (A)] indicates human data. Individual values are presented as small dots, and each circle represents an average of one mouse; individual values and averages are color coded. A.U., arbitrary units.
Fig. 7.
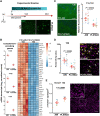
Fig. 7.. Microglia depletion decreases C1q expression and increases synapse number after sepsis.
(A) Schematic timeline of the experiments. Nine to 13-week-old male mice were randomized to PCI or sham treatment. Both groups received meropenem treatment for 10 days. At day 3 following sepsis induction or sham treatment, AIN control diet or PLX5622 diet was started until the end of experiment. Insets show Iba1-positive microglia in the CA1 region of mice 10 days after PCI and AIN (left) or PLX5622 (right) treatment, respectively. Scale bar, 50 μm. (B) Expression of DEGs encoding complement factor C1q in PCI-AIN– and PCI-PLX5622–treated animals at day 10 following sepsis induction (n = 4 per group). Expression heatmap of top 40 DEGs of hippocampal tissue of PCI-AIN–treated versus PCI-PLX5622–treated animals (n = 4, Padj < 0.05). The color scale represents the gene-wise z score calculated from normalized gene expression levels. (C) Representative image (scale bar, 20 μm) and quantification of C1q immunoreactivity in PCI-AIN and PCI-PLX5622–treated animals at day 10 in the CA1 region of the hippocampus (PCI-AIN, n = 6; PCI-PLX5622, n = 5; analyzed images, n = 3 per mouse; two-tailed Student’s t test). (D) Colocalization analysis of C1q and Homer1 at day 10 (10d) after sepsis (PCI-AIN, n = 4; PCI-PLX5622, n = 4; images, n = 5 per mouse; two-tailed Student’s t test) in the CA1 region of the hippocampus. Arrows indicate C1q-tagged synapses. Scale bar, 2 μm. (E) Superresolved lattice-SIM (structured illumination microscopy) images of Homer1 spots at day 10 (10d) after sepsis (PCI-AIN, n = 6; PCI-PLX5622, n = 5; two-tailed Student’s t test) in the CA1 region of the hippocampus. Scale bars, 5 and 2 μm (inset). Data are presented as means ± SEM. Individual values are presented as small dots, and each circle represents an average of one mouse; individual values and averages are color coded.
Fig. 8.
Fig. 8.. Microglia depletion improves neurocognitive outcome after sepsis.
(A) Schematic timeline of the experiments. Nine- to 13-week-old male mice were randomized to PCI or sham treatment. Both groups received meropenem treatment for 10 days. At day 3 following sepsis induction or sham treatment, AIN control diet or PLX5622 diet was started until the end of the experiment. NOR tests were performed at the indicated time points. (B) Measurement of serum Nfl as a marker of neuronal injury in serum of PLX5622- or AIN-treated animals at day 10 after sepsis (sham-AIN, n = 21; PCI-AIN, n = 18; sham-PLX5622, n = 16; PCI-PLX5622, n = 8; one-way ANOVA with Bonferroni’s multiple comparisons test). (C) NOR at day 10 (sham, n = 14; PCI, n = 22; sham-PLX5622, n = 9; PCI-PLX5622, n = 8) and day 30 (sham, n = 14; PCI, n = 17; sham-PLX5622, n = 9; PCI-PLX5622, n = 5; Kruskal-Wallis ANOVA with Dunn’s method for multiple comparisons test) following sepsis induction in PLX5622- and AIN-treated animals. Data are presented as means ± SEM. Individual values are presented as small dots, and each circle represents an average of one mouse; individual values and averages are color coded.
Fig. 9.
Fig. 9.. C1q-blocking antibody decreases C1q-induced synapse pruning after sepsis.
(A) Validation of the blocking functionality of the C1q-blocking antibody (C1q Ab) by ELISA testing C1q-dependent classical complement activation using complement active human serum. Downstream C3b concentration is determined in three different groups: phosphate-buffered saline (PBS), positive control group; C1q Ab, blocking antibody; C1q-depleted serum, negative control (n = 6 per group, one-way ANOVA with Bonferroni’s multiple comparisons test). (B) Top: Representative confocal image of a coronal brain section showing both hippocampi after in vivo microinjection (left: control antibody; right: C1q-blocking antibody) demonstrating a locally restricted distribution of C1q antibody in the respective hippocampus at the site of C1q expression. Scale bar, 500 μm. Bottom images left and middle: Colocalization of commercial C1q detection antibody (Abcam) and in vivo injected C1q-blocking antibody showing specificity of the blocking antibody. Scale bar, 500 μm. High-resolution imaging (right) reveals colabeling of single C1q-positive spots [scale bars, 5 μm (left) and 1 μm (right)]. (C) Schematic timeline of the experiments. Nine- to 13-week-old male mice received intrahippocampal injection of blocking C1q antibodies into one hemisphere and control antibodies into the other hemisphere to avoid any potential interindividual differences. Two days after, experimental sepsis was induced by PCI followed by meropenem treatment until the end of experiment. At day 3 following PCI, brain tissue was harvested for analysis. (D) Analysis of microglia-induced synaptic pruning after intrahippocampal C1q blocking (n = 12) or control antibody injection (n = 9). Representative 3D reconstruction of microglia Airyscan imaging [scale bar, 5 μm (left) and 1 μm (right, higher magnification)]. Arrows indicate engulfed Homer1 spots. Data are presented as means ± SEM. Individual values are color coded.

References

    1. C. Fleischmann, A. Scherag, N. K. J. Adhikari, C. S. Hartog, T. Tsaganos, P. Schlattmann, D. C. Angus, K. Reinhart; International Forum of Acute Care Trialists , Assessment of global incidence and mortality of hospital-treated sepsis. Current estimates and limitations. Am. J. Respir. Crit. Care Med. 193, 259–272 (2016). - PubMed
    1. H. Y. Chung, J. Wickel, F. M. Brunkhorst, C. Geis, Sepsis-associated encephalopathy: From delirium to dementia? J. Clin. Med. 9, (2020). - PMC - PubMed
    1. R. Sonneville, E. de Montmollin, J. Poujade, M. Garrouste-Orgeas, B. Souweine, M. Darmon, E. Mariotte, L. Argaud, F. Barbier, D. Goldgran-Toledano, G. Marcotte, A. S. Dumenil, S. Jamali, G. Lacave, S. Ruckly, B. Mourvillier, J. F. Timsit, Potentially modifiable factors contributing to sepsis-associated encephalopathy. Intensive Care Med. 43, 1075–1084 (2017). - PubMed
    1. T. E. Gofton, G. B. Young, Sepsis-associated encephalopathy. Nat. Rev. Neurol. 8, 557–566 (2012). - PubMed
    1. A. Semmler, C. N. Widmann, T. Okulla, H. Urbach, M. Kaiser, G. Widman, F. Mormann, J. Weide, K. Fliessbach, A. Hoeft, F. Jessen, C. Putensen, M. T. Heneka, Persistent cognitive impairment, hippocampal atrophy and EEG changes in sepsis survivors. J. Neurol. Neurosurg. Psychiatry 84, 62–69 (2013). - PubMed