. 2023 May 26:14:543-560.
doi: 10.18632/oncotarget.28447.

Deconstructing the role of MALAT1 in MAPK-signaling in melanoma: insights from antisense oligonucleotide treatment

Affiliations

Deconstructing the role of MALAT1 in MAPK-signaling in melanoma: insights from antisense oligonucleotide treatment

Valentin Feichtenschlager et al. Oncotarget. .

Abstract

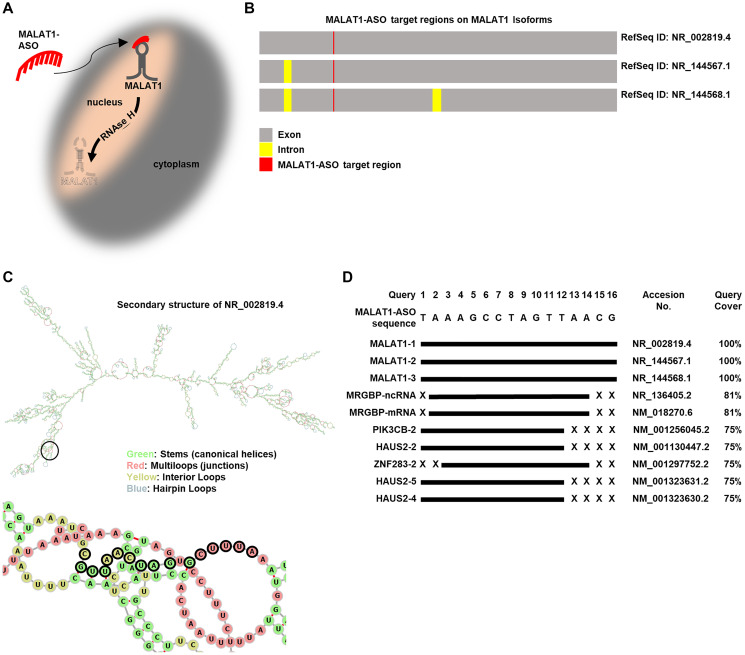
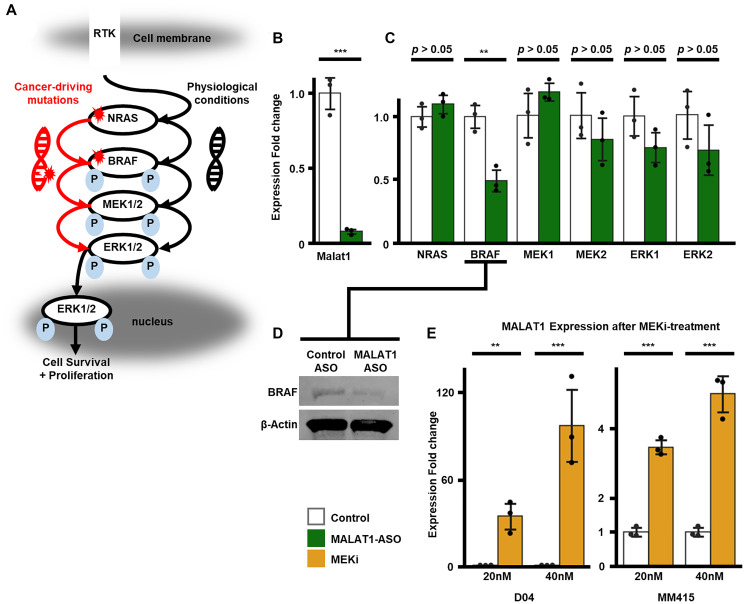
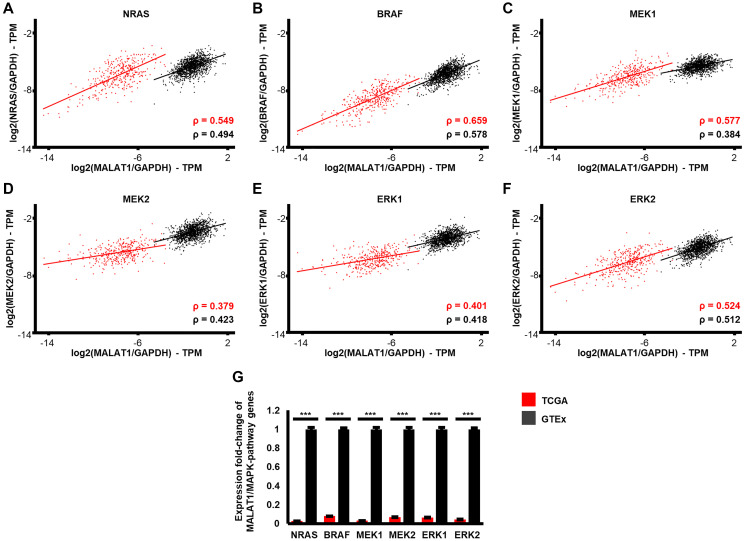
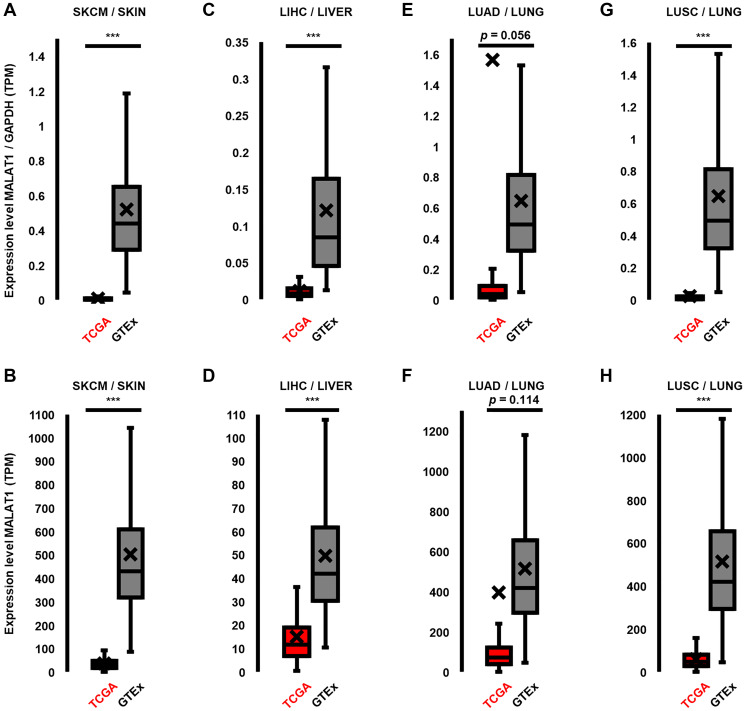
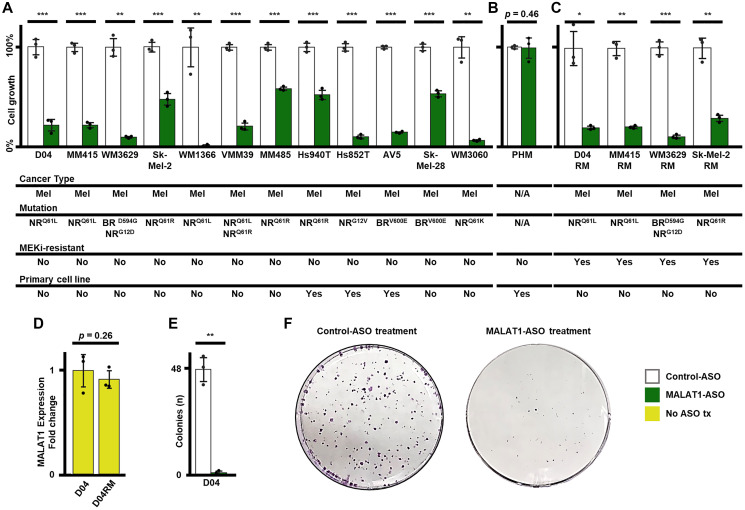
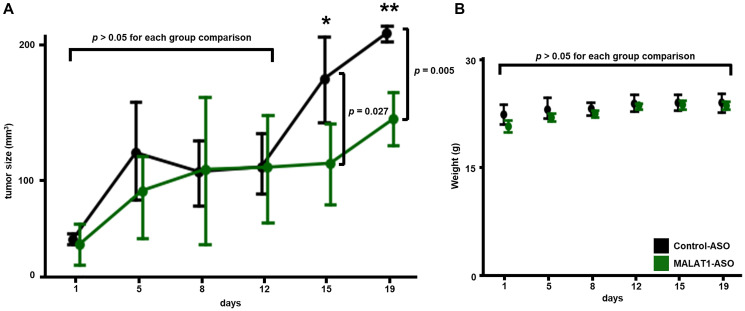
The long non-coding RNA (lncRNA) MALAT1 is a regulator of oncogenesis and cancer progression. MAPK-pathway upregulation is the main event in the development and progression of human cancer, including melanoma and recent studies have shown that MALAT1 has a significant impact on the regulation of gene and protein expression in the MAPK pathway. However, the role of MALAT1 in regulation of gene and protein expression of the MAPK-pathway kinases RAS, RAF, MEK and ERK in melanoma is largely unknown. We demonstrate the impacts of antisense oligonucleotide (ASO)-based MALAT1-inhibition on MAPK-pathway gene regulation in melanoma. Our results showed that MALAT1-ASO treatment decreased BRAF RNA expression and protein levels, and MALAT1 had increased correlation with MAPK-pathway associated genes in melanoma patient samples compared to healthy skin. Additionally, drug-induced MAPK inhibition upregulated MALAT1-expression, a finding that resonates with a paradigm of MALAT1-expression presented in this work: MALAT1 is downregulated in melanoma and other cancer types in which MALAT1 seems to be associated with MAPK-signaling, while MALAT1-ASO treatment strongly reduced the growth of melanoma cell lines, even in cases of resistance to MEK inhibition. MALAT1-ASO treatment significantly inhibited colony formation in vitro and reduced tumor growth in an NRAS-mutant melanoma xenograft mouse model in vivo, while showing no aberrant toxic side effects. Our findings demonstrate new insights into MALAT1-mediated MAPK-pathway gene regulation and a paradigm of MALAT1 expression in MAPK-signaling-dependent cancer types. MALAT1 maintains essential oncogenic functions, despite being downregulated.

Keywords: BRAF; MALAT1; MAPK-pathway; antisense oligonucleotides; melanoma.


Conflict of interest statement

CONFLICTS OF INTEREST

Authors have no conflicts of interest to declare.

Figures

Figure 1
Figure 1. MALAT1-ASO specifically targets MALAT1-lncRNAs.
(A) Schematic illustration of the MALAT1-ASO bypassing the cell-membrane and entering the nucleus of melanoma cells to inhibit MALAT1 through target-binding and RNAse H mediated degradation. (B) Schematic illustration of the three MALAT1 isoforms that are targeted by MALAT1-ASO, highlighting intron, exon and MALAT1-ASO target-binding regions. (C) Top: Secondary RNA-structure (MFE) of NR_002819.4 and the target binding region of the MALAT1-ASO (black circle). Below: Selected cutout and zoom of the secondary structure of the target region, showing that the MALAT1-ASO target site is an accessible structure for RNA-ASO binding. The nucleotides that are targeted by the MALAT1-ASO sequence are highlighted with black outline. Contrary to the complete structure (top), the selected cutout (bottom) does not include hairpin loops. (D) The top10 hits of matching targets to the MALAT1-ASO sequence in the human transcriptome show high specificity of MALAT1-ASO to MALAT1 isoforms. Other targets have at least three mismatches, indicating a low “off-target” binding probability of the MALAT1-ASO. Targets are ranked by the expect value (E-value). The graphical illustration of the target sequences corresponds to their mRNA sequences.
Figure 2
Figure 2. Relative fold enrichment analysis of MAPK-pathway genes and MALAT1.
(A) A schematic illustration of activation and phosphorylation cascade of the RAS/RAF/MEK/ERK (MAPK) signaling pathway. Under physiological conditions, a receptor tyrosine kinase (RTK) which is located in the cellular membrane, activates NRAS. NRAS activates BRAF through phosphorylation (P), which activates MEK1/2, which then activates ERK1/2. Activated ERK1/2 phosphorylates downstream targets which regulate cell survival, proliferation and apoptosis and transfers into the nucleus. Alternatively, activating mutations in NRAS and BRAF can auto-activate the proteins and hyperactivate the MAPK-pathway, without the requirement of ligand mediated activation. (B) Strong (11-fold, SD = 0.02) and significant (p < 0.001) downregulation of MALAT1 RNA levels was measured in D04 cells treated with non-targeting control ASO versus D04 samples treated with MALAT1-ASO. Final ASO concentration in media was 50 nM for a treatment period of 24 hours. (C) When comparing D04 samples treated with non-targeting control ASO versus D04 samples treated with MALAT1-ASO, significant RNA-expression downregulation of the MAPK-signaling kinase BRAF (1.01-fold decrease, SD = 0.01, p = 0.006) was measured, while no significant expression alteration was measured for NRAS (0.1-fold increase, SD = 0.09, p = 0.13), MEK1 (0.2-fold increase, SD = 0.09, p = 0.14), MEK2 (0.23-fold decrease, SD = 0.2, p = 0.16), ERK1 (0.33-fold decrease, SD = 0.14, p = 0.07) and ERK2 (0.37-fold decrease, SD = 0.24, p = 0.11). Final ASO concentration in media was 50 nM for a treatment period of 24 hours. (D) Immunoblotting showing a decrease of BRAF protein levels 24 hours after MALAT1-ASO treatment compared to Control-ASO treatment in D04 cell lysate (50 nM final ASO concentration). β-actin served as a loading control. (E) MEKi caused significant and dose dependent MALAT1-upregulation. D04 cells responded with 34-fold upregulation (SD = 10.87, p = 0.001) to 20 nM MEKi treatment and 96-fold enrichment (SD = 30.49, p < 0.001) to 40 nM MEKi treatment. MM415 cells are less vulnerable to MEKi treatment and reacted with 2.5-fold increase (20 nM; SD = 0.25, p < 0.001), respectively 4-fold increase (40 nM; SD = 0.63, p < 0.001) of MALAT1-expression. Cells were either treated with trametinib (MEKi) or DMSO (control). Treatment period was 72 hours. For (B, C, E) CT-values were normalized to GAPDH, and fold enrichment was calculated using the 2–ΔΔCt method. Error bars represent standard deviation (SD). All experiments were performed in triplicates (n = 3/group). Significance is shown as p-values calculated by Students t-test. * p < 0.05, ** p < 0.01, *** p < 0.001.
Figure 3
Figure 3. Expression patterns of MALAT1 and MAPK-signaling associated genes in patient derived healthy skin compared to NRAS and BRAF mutated melanoma samples.
Expression-correlation is shown for MALAT1 and the proto-oncogenes (A) NRAS, (B) BRAF, (C) MEK1, (D) MEK2, (E) ERK1, and (F) ERK2. The black (GTEx database, n = 1305) and red (TCGA database, n = 366) lines represent Spearman correlation (ρ). Expression correlation was significant (p < 0.001) in all comparisons. Expression correlation was stronger in melanoma than healthy skin in all comparisons, except MALAT1-MEK2 and MALAT1-ERK1. Expression values of genes in (A–F) were normalized to GAPDH. (G) MALAT1 is significantly reduced in melanoma samples compared to healthy skin, when put into relation to expression to the MAPK-pathway genes NRAS (38-fold, p < 0.001), BRAF (13-fold, p < 0.001), MEK1 (33-fold, p < 0.001), MEK2 (15-fold, p < 0.001), ERK1 (16-fold, p < 0.001) and ERK2 (23-fold, p < 0.001). Error bars represent standard error of the mean and significance is shown as p-values calculated by Students t-test. * p < 0.05, ** p < 0.01, *** p < 0.001.
Figure 4
Figure 4. MALAT1 is downregulated in cancer types in which it is associated with the MAPK pathway.
(A, B) In patient-derived tissue samples of NRAS and BRAF mutated melanoma, MALAT1 expression was significantly and strongly reduced by 63-fold (normalized)/14-fold (not normalized, both: p < 0.001), compared to healthy skin. (C, D) Similarly, in liver hepatocellular carcinoma (LIHC), MALAT1 expression was significantly reduced by 9.2-fold (normalized)/3-fold (not normalized, both: p < 0.001) in comparison to healthy liver tissue. (E, F) MALAT1 expression in lung adenocarcinoma (LUAD) did not show a significant change when compared to healthy lung tissue (normalized: 1.42-fold increase, p = 0.056; not normalized: 0.3-fold decrease, p = 0.0114). (G, H) In lung squamous cell carcinoma (LUSC) MALAT1 expression was significantly reduced by 28-fold (normalized)/9-fold (not normalized, both: p < 0.001) in comparison to healthy lung tissue. Center line is median, box spans first quartile (Q1) to third quartile (Q3), whiskers extend to furthest value < 1.5 x IQR from lower/upper quartile. Mean is marked as X. TPM Expression values of genes were normalized to TPM of GAPDH. Significance is shown as p-values calculated by Students t-test. * p < 0.05, ** p < 0.01, *** p < 0.001.
Figure 5
Figure 5. MALAT1-ASO treatment significantly reduces cell-growth in NRAS (NR) and BRAF (BR) mutated melanoma (mel) cells
in vitro. (A) The treatment causes reduction (re) of cell growth in the D04 (re = 77.74%, SD = 7%, p < 0.001), MM415 (re = 77.83%, SD = 2.8%, p < 0.001), WM3629 (re = 89.83%, SD = 1.4%, p = 0.002), Sk-Mel-2 (re = 52.02%, SD = 6.9%, p < 0.001), WM1366 (re = 98.64%, SD = 1.1%, p = 0.009), VMM39 (re = 79.28%, SD = 4.4% p < 0.001), MM485 (re = 41.41%, SD = 1.8%, p < 0.001), Hs940T (re = 47.59%, SD = 5.6%, p < 0.001), Hs852T (re = 89.34%, SD = 2.1%, p < 0.001), AV5 (re = 85.14% SD = 1%, p < 0.001), Sk-Mel-28 (re = 46.11%, SD = 3.5%, p < 0.001) and WM3060 (re = 92.94%, SD = 1.1%, p = 0.003) melanoma cell lines. (B) MALAT1-ASO treatment does not significantly reduce cell growth (re = 0.72%, SD = 12.4%, p = 0.46) in pooled primary derived human melanocytes (PHM). (C) MALAT1-ASO treatment significantly reduces cell growth in the MEKi-treatment resistant cell lines D04RM (re = 80.34%, SD = 2.1%, p = 0.01), MM415RM (re = 79.68%, SD = 1.6%, p = 0.001) WM3629RM (re = 89.05%, SD = 2%, p < 0.001) and Sk-Mel-2RM (re = 70.32%, SD = 4%, p = 0.003). (D) MALAT1 expression is not significantly altered (1.09-fold decrease, SD = 0.1, p = 0.29) in the MEKi-treatment resistant cell line D04RM, which was constantly exposed to 5 nM of trametinib. CT-values were normalized to GAPDH, and fold enrichment was calculated using the 2–ΔΔCt method. (E) MALAT1-ASO treatment significantly (48-fold decrease, SD = 0.02, p = 0.003) reduced the ability of D04 cells to form colonies. (F) Representative images of 6cm-dishes of D04 cells that either received Control- or MALAT1-ASO treatment. Cells were treated for 5 days (A, B, C) or 7 days (E, F) with 50 nM final concentration of MALAT1-ASO or Control-ASO. Error bars represent standard deviation. All experiments were performed in triplicates (n = 3/group). Significance is shown as p -values calculated by Students t-test. * p < 0.05, ** p < 0.01, *** p < 0.001.
Figure 6
Figure 6. MALAT1-ASO treatment inhibits tumor growth in vivo and does not cause weight loss.
(A) Mice, that were carrying subcutaneous D04 xenografts on their right flank (group size: n = 4), were either treated with MALAT1-ASO (green) or Control-ASO (black), twice a week, for 5 treatments. Subcutaneous ASO injections were co-applied with the transfection reagent in vivo-jetPEI®, close (~0.5 cm) to the tumor site. Significant smaller average tumor size was observed in the group of MALAT1-ASO treated mice on day 15 (MALAT1-ASO: 113 mm3, SD = 42 mm3; Control-ASO: 174 mm3, SD = 38 mm3; p = 0.027) and day 19 (MALAT1-ASO: 145 mm3, SD = 28 mm3; Control-ASO: 208 mm3, SD = 7 mm3; p = 0.005). (B) No significant difference in weight change in comparison of MALAT1-ASO and Control-ASO treatment groups could be observed during the treatment period. Data points represent average tumor size in (A) and average animal weight in (B). Error bars represent standard deviation. Significance is shown as p-values calculated by Students t-test. * p < 0.05, ** p < 0.01, *** p < 0.001.

References

    1. Surveillance, Epidemiology, and End Results (SEER) Program (www.seer.cancer.gov) SEER*Stat Database: Populations - Total U.S. (1969–2019) <Katrina/Rita Adjustment> - Linked To County Attributes - Total U.S., 1969-2019 Counties, National Cancer Institute, DCCPS, Surveillance Research Program, released December 2020.
    1. Yuan J, Dong X, Yap J, Hu J. The MAPK and AMPK signalings: interplay and implication in targeted cancer therapy. J Hematol Oncol. 2020; 13:113. 10.1186/s13045-020-00949-4. - DOI - PMC - PubMed
    1. Attwood MM, Fabbro D, Sokolov AV, Knapp S, Schiöth HB. Author Correction: Trends in kinase drug discovery: targets, indications and inhibitor design. Nat Rev Drug Discov. 2021; 20:798. 10.1038/s41573-021-00303-4. - DOI - PubMed
    1. Inamdar GS, Madhunapantula SV, Robertson GP. Targeting the MAPK pathway in melanoma: why some approaches succeed and other fail. Biochem Pharmacol. 2010; 80:624–37. 10.1016/j.bcp.2010.04.029. - DOI - PMC - PubMed
    1. Sun YM, Chen YQ. Principles and innovative technologies for decrypting noncoding RNAs: from discovery and functional prediction to clinical application. J Hematol Oncol. 2020; 13:109. 10.1186/s13045-020-00945-8. - DOI - PMC - PubMed

Publication types

MeSH terms

Substances