. 2023 Jul 11;56(7):1649-1663.e5.
doi: 10.1016/j.immuni.2023.04.019. Epub 2023 May 25.

Allogeneic immunity clears latent virus following allogeneic stem cell transplantation in SIV-infected ART-suppressed macaques

Affiliations

Allogeneic immunity clears latent virus following allogeneic stem cell transplantation in SIV-infected ART-suppressed macaques

Helen L Wu et al. Immunity. .

Abstract

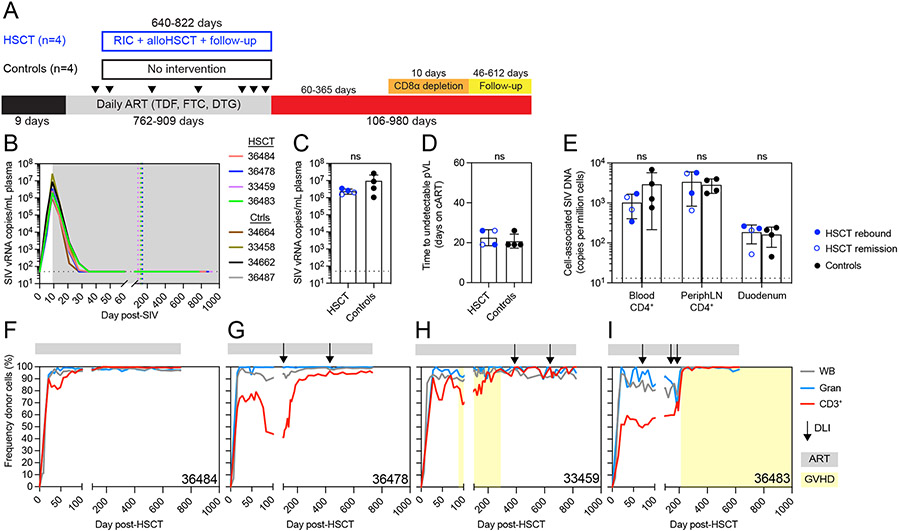
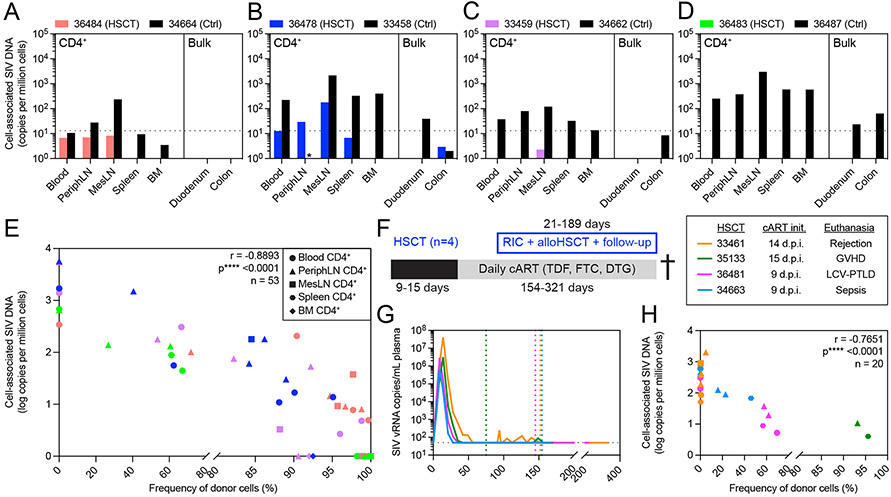
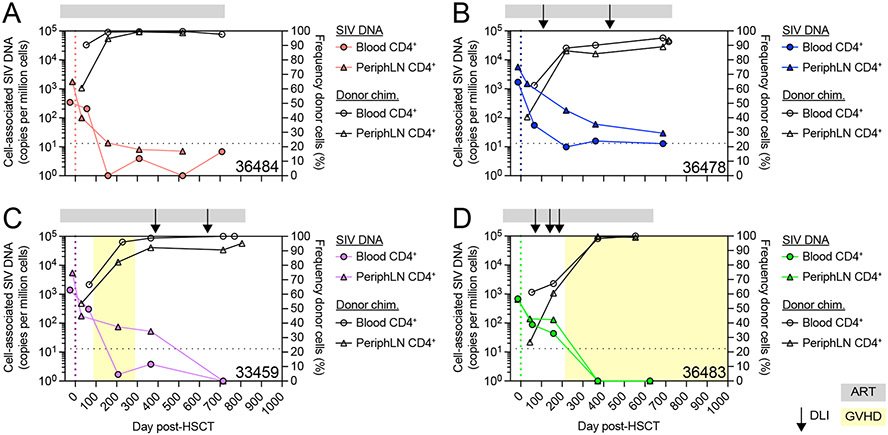
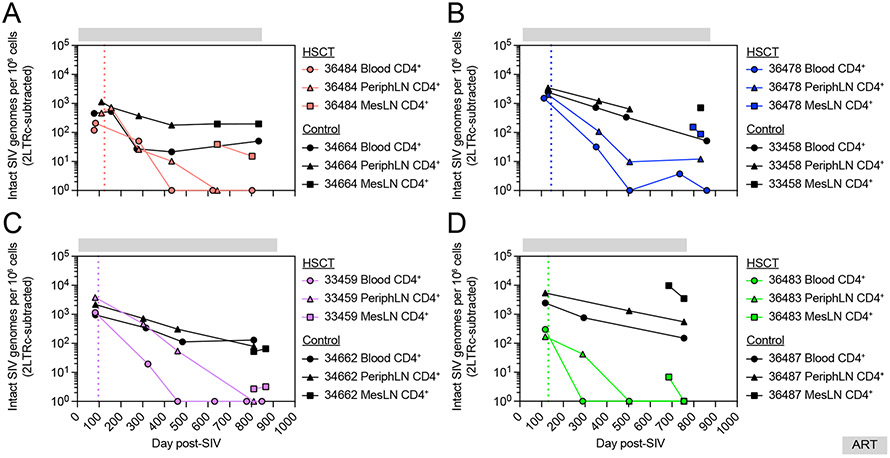
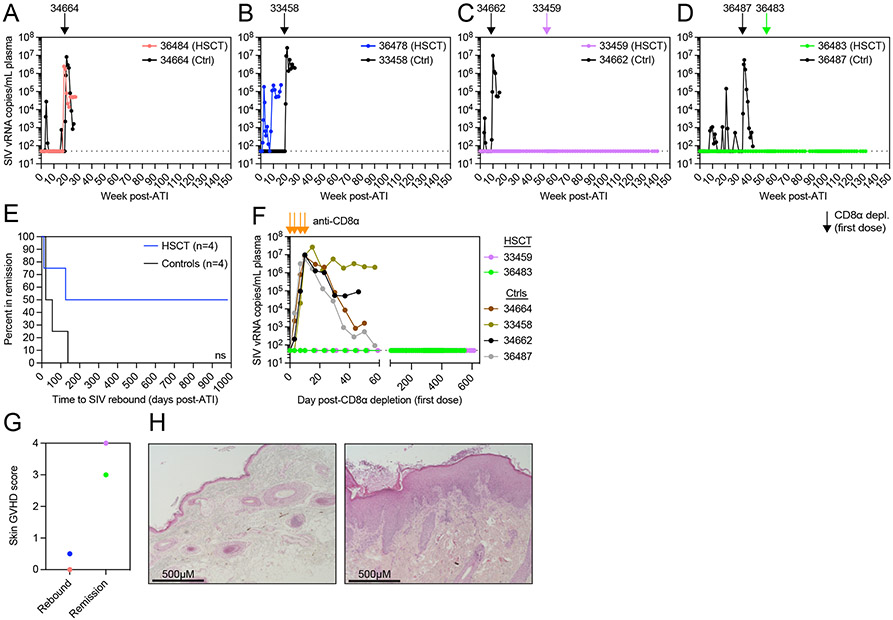
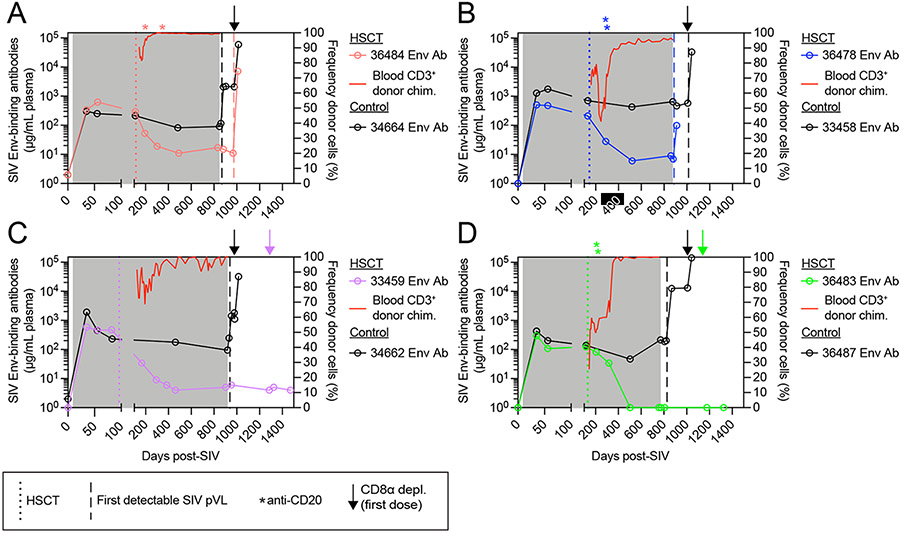
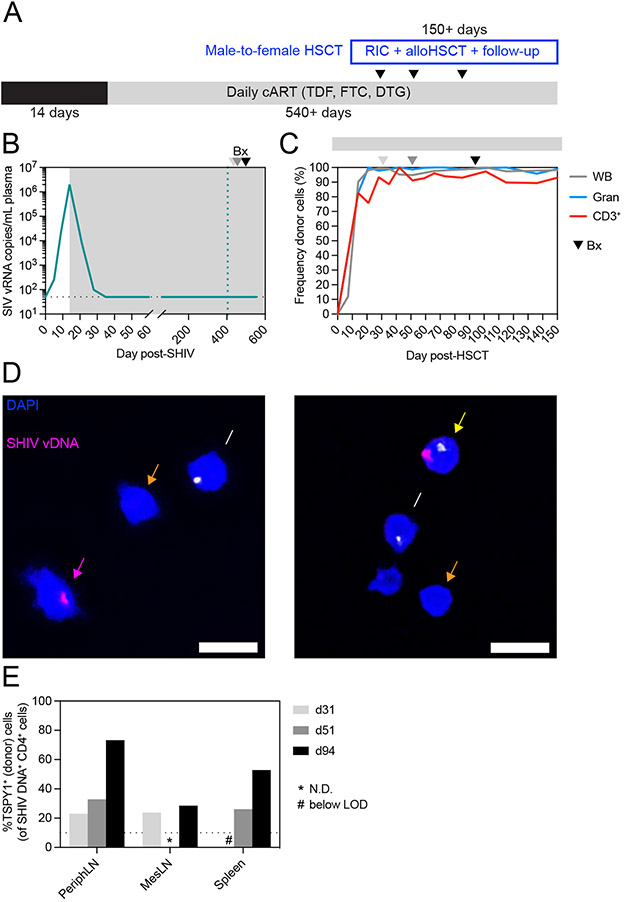
Allogeneic hematopoietic stem cell transplantation (alloHSCT) from donors lacking C-C chemokine receptor 5 (CCR5Δ32/Δ32) can cure HIV, yet mechanisms remain speculative. To define how alloHSCT mediates HIV cure, we performed MHC-matched alloHSCT in SIV+, anti-retroviral therapy (ART)-suppressed Mauritian cynomolgus macaques (MCMs) and demonstrated that allogeneic immunity was the major driver of reservoir clearance, occurring first in peripheral blood, then peripheral lymph nodes, and finally in mesenteric lymph nodes draining the gastrointestinal tract. While allogeneic immunity could extirpate the latent viral reservoir and did so in two alloHSCT-recipient MCMs that remained aviremic >2.5 years after stopping ART, in other cases, it was insufficient without protection of engrafting cells afforded by CCR5-deficiency, as CCR5-tropic virus spread to donor CD4+ T cells despite full ART suppression. These data demonstrate the individual contributions of allogeneic immunity and CCR5 deficiency to HIV cure and support defining targets of alloimmunity for curative strategies independent of HSCT.

Keywords: CCR5; GVHD; HIV; HSCT; SIV.


Conflict of interest statement

Declaration of interests J.B.S. has a significant financial interest in and serves on the scientific advisory board of CytoDyn, a company that may have a financial interest in the results of this research and technology. This potential individual conflict of interest has been reviewed and managed by OHSU.

Figures

Figure 1.
Figure 1.. Reduced intensity alloHSCT in ART-suppressed SIVmac239-infected MCMs.
(A) Study outline for a cohort of alloHSCT (n=4) and time-matched no-transplant control (n=4) MCM. RIC = reduced intensity conditioning, ATI = analytic treatment interruption. Black arrows indicate biopsy timepoints. (B) Longitudinal SIVmac239 plasma viral loads from infection until ATI. Gray box denotes ART treatment. Colored dotted vertical lines indicate the day of HSCT for each recipient. Black dotted horizontal lines in B-D indicate the limit of quantification (LOQ = 50 copies/mL). Undetectable values are graphed at the LOQ. (C) Peak SIVmac239 plasma viral loads (day 9 post-infection, day of ART initiation). ns = not significantly different by Mann-Whitney test (C and D). Bars show mean ±SD (C-E). (D) Time to suppression of plasma viremia (days on ART). (E) Cell-associated SIV DNA copies in blood and tissues from HSCT recipients (blue, n=4) prior to alloHSCT and controls (black, n=4). HSCT recipients in SIV remission post-ATI are shown in open symbols. Black dotted horizontal lines indicate the LOQ for SIV DNA (13 copies/million cells). Undetectable values are graphed at 1. ns = not significantly different by repeated measures ANOVA. (F-I) Longitudinal donor chimerism in whole blood, blood granulocytes (Gran), and blood T cells (CD3+) in the alloHSCT recipients, from HSCT until ATI. Donor lymphocyte infusions (DLIs) are shown in the black arrows (see Figure S1C for doses). Gray bars above each graph denote ART treatment. Yellow boxes denote clinical GVHD. See also figures S1, S2, S3, S4.
Figure 2.
Figure 2.. Elimination of recipient-derived CD4+ T cells after alloHSCT results in profound decreases in cell-associated SIV DNA across blood and tissue reservoirs.
(A-D) Cell-associated SIV DNA in blood and tissues from alloHSCT recipients (colored bars) and time-matched controls (black bars) from Figure 1. Black dotted horizontal lines indicate the LOQ for SIV DNA (13 copies/million cells). Bars not shown represent undetectable SIV DNA copies. Asterisks (*) indicate measurements not performed due to technical issues. (E) Correlation of CD4+ cell-associated SIV DNA copy number and CD4+ donor chimerism in blood and tissues sampled from the HSCT recipients shown in A. Symbol colors and shapes correspond to a particular recipient (see A-D) and tissue, respectively. Undetectable SIV DNA were considered 0 for this analysis. r and p-values calculated by Spearman test: *p ≤ 0.05, ** p ≤ 0.01, ***p ≤ 0.001, ****p ≤ 0.0001. PeriphLN = peripheral (axillary/inguinal) lymph nodes, MesLN = mesenteric lymph nodes, BM = bone marrow. (F) Study outline for alloHSCT macaques (n=4) euthanized post-HSCT during ART treatment. RIC = reduced intensity conditioning. (G) Longitudinal SIVmac239 plasma viral loads from infection until euthanasia. Colored dotted vertical lines indicate the day of HSCT for each HSCT recipient. Black dotted horizontal line indicates the LOQ (50 copies/mL). Undetectable values are graphed at the LOQ. Macaques were maintained on daily ART from the indicated initiation timepoint until euthanasia. (H) Correlation of CD4+ T cell-associated SIV DNA copy number and CD4+ T cell donor chimerism in blood and tissues sampled from the recipients shown in F and G. Symbol colors and shapes correspond to a particular recipient macaque and tissue (see part E legend), respectively. r and p-values calculated by Spearman test using log-transformed SIV DNA copies: *p ≤ 0.05, ** p ≤ 0.01, ***p ≤ 0.001, ****p ≤ 0.0001. Undetectable SIV DNA were considered 1 for this analysis. See also figures S1, S2, S4.
Figure 3.
Figure 3.. SIV DNA persists early post-HSCT but decreases as CD4+ T cell donor chimerism increases.
(A-D) Longitudinal CD4+ T cell-associated SIV DNA copy number (colored symbols, left axis) and CD4+ T cell donor chimerism (open black symbols, right axis) in the alloHSCT recipients from Figure 1. DLIs are shown as black arrows. Colored dotted vertical lines indicate the day of HSCT. Gray bars above each graph denote ART treatment. Yellow boxes denote clinical GVHD. Black dotted horizontal lines indicate the LOQ for SIV DNA (13 copies/million cells). Undetectable SIV DNA values are graphed at 1.
Figure 4.
Figure 4.. AlloHSCT mediates profound decreases in intact SIV proviruses.
Longitudinal intact SIV provirus copies in CD4+ T cells from blood and LN of alloHSCT recipients (colored symbols) and time-matched no-transplant controls (black symbols) from Figure 1. Measurements shown are corrected for double positive 2-LTR circles. Undetectable values are graphed at 0. Colored dotted vertical lines indicate the day of HSCT for each recipient macaque. Gray bars above each graph denote ART treatment. See also figure S4.
Figure 5.
Figure 5.. Long-term ART-free SIV remission despite CD8α+ cell depletion in two alloHSCT recipients.
(A-D) SIVmac239 plasma viral loads after ATI. Arrows indicate the first dose of anti-CD8α depleting antibody for alloHSCT recipients (colored) and time-matched controls (black) from Figure 1. Black dotted horizontal lines in A-D,F indicate the LOQ (50 copies/mL). Undetectable values are graphed at the LOQ. (E) Kaplan-Meier curve of time in remission. ns = not significantly different by Log-rank (Mantel-Cox) test. (F) SIVmac239 plasma viral loads during period of CD8α+ cell depletion. Orange arrows indicate doses of anti-CD8α depleting antibody. (G) Skin biopsy GVHD histopathology scores for HSCT recipients that rebounded after ATI or remain in SIV remission. Symbol colors correspond to recipients shown in A. (H) Representative images of hematoxylin and eosin stained tissue sections from HSCT recipient skin biopsies scored in Figure 5G. 36478 (left) shows minimal findings, GVHD score = 0.5. 33459 (right) shows hyperkeratosis and epidermal hyperplasia with mononuclear cell infiltrate, GVHD score = 4. Images taken with 10X objective lens (total 100X magnification). See also figure S5.
Figure 6.
Figure 6.. SIV Env-binding antibody titers wane in alloHSCT recipient macaques as T cell donor chimerism increases and remain low after ATI only in aviremic HSCT recipients.
(A-D) Longitudinal plasma titers of SIV Env-binding antibodies in alloHSCT recipients (left axis, colored symbols) and time-matched controls (left axis, black symbols) from Figure 1, alongside blood CD3+ T cell donor chimerism in HSCT recipients (right axis, red traces). Colored dotted vertical lines indicate the day of HSCT for each recipient macaque. Asterisks indicate anti-CD20 depleting antibody administration in alloHSCT recipients. Gray boxes denote ART treatment. Vertical dashed lines indicate the timepoint of first detectable SIV plasma viral load for alloHSCT recipients (colored) and controls (black). Arrows indicate the first dose of anti-CD8α depleting antibody for alloHSCT recipients (colored) and controls (black). See also figure S6.
Figure 7.
Figure 7.. Virus spreads to donor CD4+ T cells despite ART.
(A) Study outline for a female HSCT recipient macaque (38142) transplanted with cells from a male donor. RIC = reduced intensity conditioning. (B) Longitudinal SHIV-AD8-EOM plasma viral loads from HSCT recipient 38142. Gray box denotes ART treatment. Colored dotted vertical line indicates the day of alloHSCT. Arrowheads in B-C denote biopsy timepoints. Black dotted horizontal line indicates LOQ (50 copies/mL). Undetectable values are graphed at the LOQ. (C) Longitudinal donor chimerism in whole blood, blood granulocytes (Gran), and blood T cells (CD3+) in HSCT recipient 38142. Gray bar above the graph denotes ART treatment. (D) Representative images from DNAscope cytospin assay of peripheral LN CD4+ cells from HSCT recipient 38142 at day 51 post-HSCT. Yellow arrow indicates an infected (male) donor cell (TSPY1+SHIV+), pink arrow indicates an infected (female) recipient cell (TSPY1SHIV+), white arrow indicates an uninfected (male) donor cell (TSPY1+SHIV), and orange arrow indicates an uninfected (female) recipient cell (TSPY1SHIV). (E) Frequency of SHIV DNA+ cells that are TSPY1+ (male). Asterisks (*) indicate measurements not determined due to insufficient cell numbers. Hashtags (#) indicate measurements below the limit of detection. See also figure S1, S2, S7.

Similar articles

Cited by

References

    1. Finzi D, Hermankova M, Pierson T, Carruth LM, Buck C, Chaisson RE, Quinn TC, Chadwick K, Margolick J, Brookmeyer R, et al. (1997). Identification of a Reservoir for HIV-1 in Patients on Highly Active Antiretroviral Therapy. Science 278, 1295–1300. 10.1126/science.278.5341.1295. - DOI - PubMed
    1. Chun T-W, Stuyver L, Mizell SB, Ehler LA, Mican JAM, Baseler M, Lloyd AL, Nowak MA, and Fauci AS (1997). Presence of an inducible HIV-1 latent reservoir during highly active antiretroviral therapy. Proc National Acad Sci 94, 13193–13197. 10.1073/pnas.94.24.13193. - DOI - PMC - PubMed
    1. Chun T-W, Carruth L, Finzi D, Shen X, DiGiuseppe JA, Taylor H, Hermankova M, Chadwick K, Margolick J, Quinn TC, et al. (1997). Quantification of latent tissue reservoirs and total body viral load in HIV-1 infection. Nature 387, 183–188. 10.1038/387183a0. - DOI - PubMed
    1. Finzi D, Blankson J, Siliciano JD, Margolick JB, Chadwick K, Pierson T, Smith K, Lisziewicz J, Lori F, Flexner C, et al. (1999). Latent infection of CD4+ T cells provides a mechanism for lifelong persistence of HIV-1, even in patients on effective combination therapy. Nat Med 5, 512–517. 10.1038/8394. - DOI - PubMed
    1. Davey RT, Bhat N, Yoder C, Chun TW, Metcalf JA, Dewar R, Natarajan V, Lempicki RA, Adelsberger JW, Miller KD, et al. (1999). HIV-1 and T cell dynamics after interruption of highly active antiretroviral therapy (HAART) in patients with a history of sustained viral suppression. P Natl Acad Sci Usa 96, 15109–15114. 10.1073/pnas.96.26.15109. - DOI - PMC - PubMed

Publication types