. 2023 May 26;14(1):3041.
doi: 10.1038/s41467-023-38722-z.

Odor-regulated oviposition behavior in an ecological specialist

Affiliations

Odor-regulated oviposition behavior in an ecological specialist

Raquel Álvarez-Ocaña et al. Nat Commun. .

Abstract

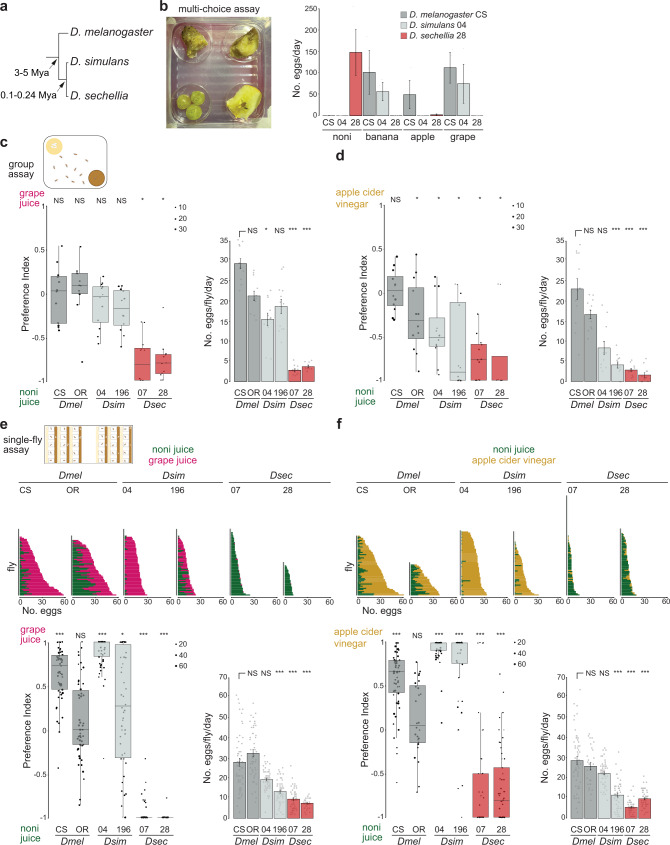
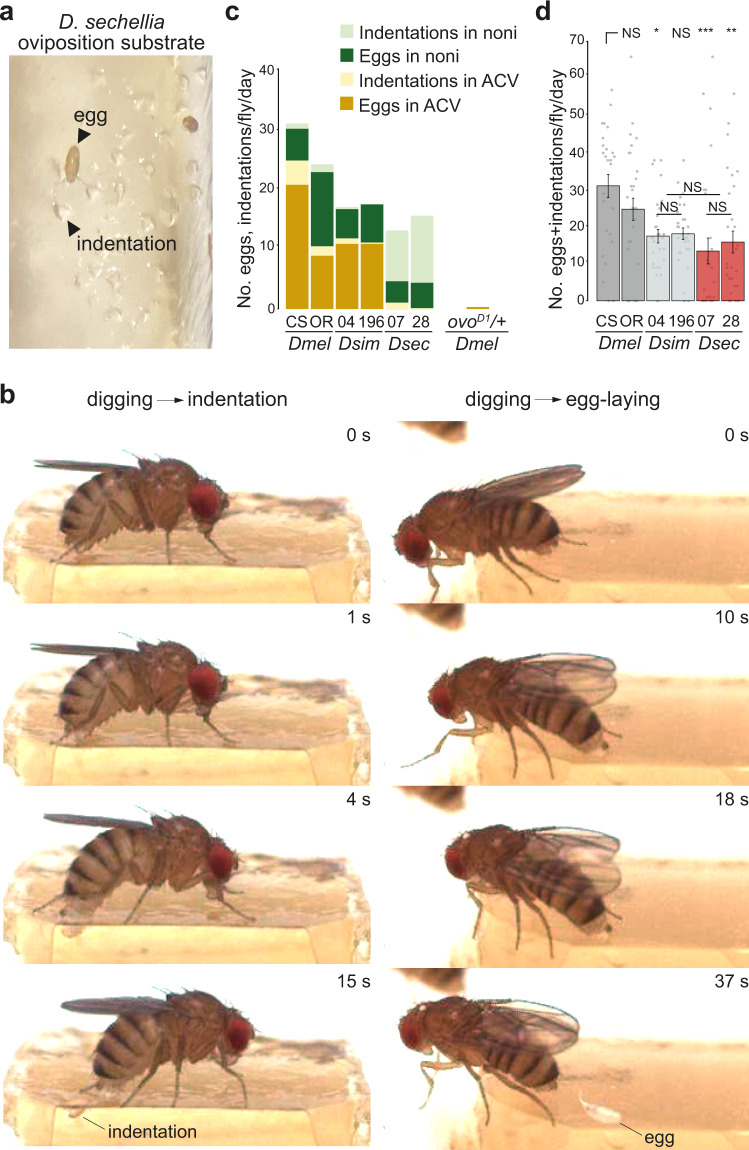
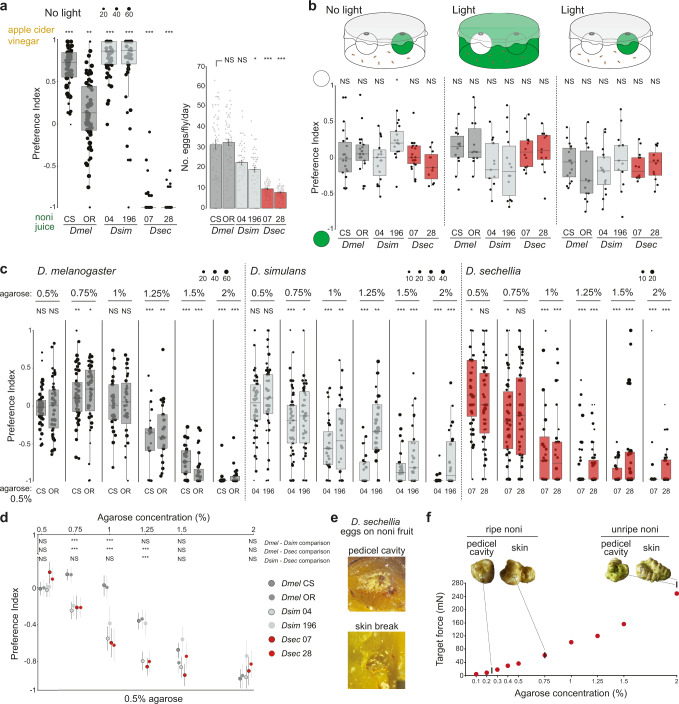
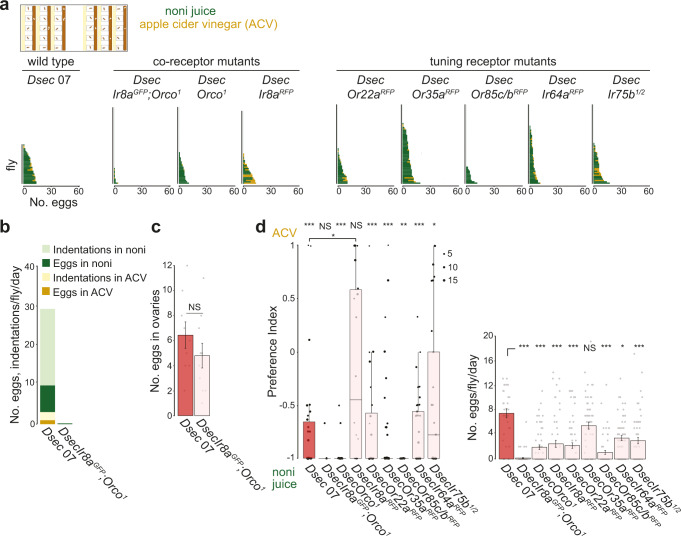
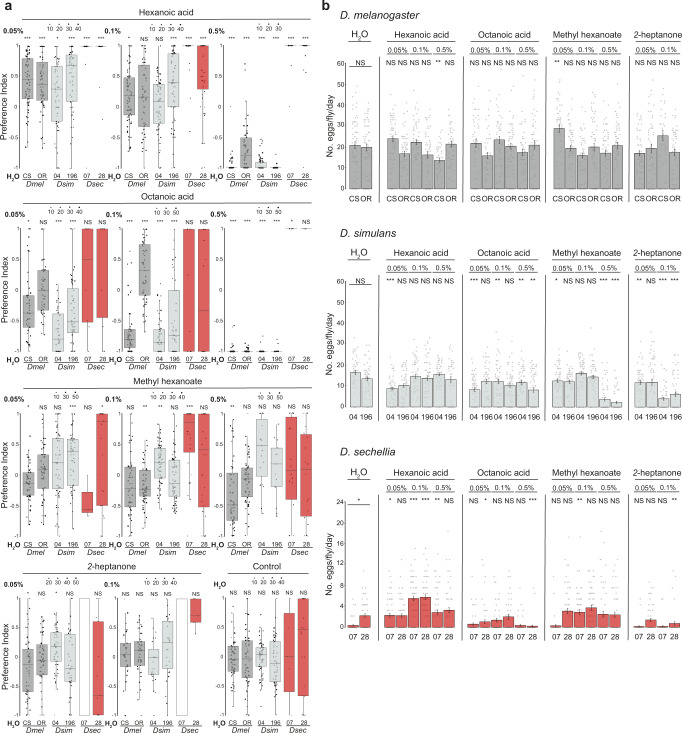
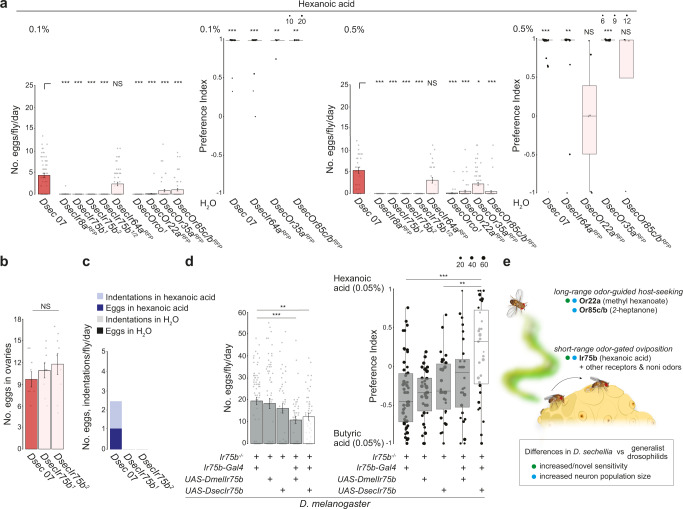
Colonization of a novel ecological niche can require, or be driven by, evolution of an animal's behaviors promoting their reproductive success. We investigated the evolution and sensory basis of oviposition in Drosophila sechellia, a close relative of Drosophila melanogaster that exhibits extreme specialism for Morinda citrifolia noni fruit. D. sechellia produces fewer eggs than other drosophilids and lays these almost exclusively on noni substrates. We show that visual, textural and social cues do not explain this species-specific preference. By contrast, we find that loss of olfactory input in D. sechellia, but not D. melanogaster, essentially abolishes egg-laying, suggesting that olfaction gates gustatory-driven noni preference. Noni odors are detected by redundant olfactory pathways, but we discover a role for hexanoic acid and the cognate Ionotropic receptor 75b (Ir75b) in odor-evoked oviposition. Through receptor exchange in D. melanogaster, we provide evidence for a causal contribution of odor-tuning changes in Ir75b to the evolution of D. sechellia's oviposition behavior.


Conflict of interest statement

The authors declare no competing interests.

Figures

Fig. 1
Fig. 1. D. sechellia displays robust, species-specific preference for oviposition on noni substrates.
a Phylogeny of the drosophilid species studied in this work. Mya, million years ago. b Fruit multi-choice oviposition preference assay. Left: image of the assay with noni, banana, apple and grape (clockwise from top left) in the arena. Right: quantification of the number of eggs laid per day; N = 3 assays/species, using 50 flies each for a duration of 3 days. Strains used: D. melanogaster Canton-S (CS), D. simulans 14021-0251.004 (04) and D. sechellia 14021-0248.28 (28); see Supplementary Table 1 for details of all strains used in this work. In these and all other bar plots, mean values ± standard error of the mean (SEM) are shown, overlaid with individual data points. All raw behavioral data are provided in the Source Data files. c Group oviposition preference assays for noni juice versus grape juice (see Supplementary Table 2 for sources of all chemical stimuli) in 0.67% agarose using two strains each of wild-type D. melanogaster (Dmel: CS and Oregon R (OR)) (dark grey bars, here and elsewhere), D. simulans (Dsim: 04 and 14021-0251.196 (196)) (light grey bars, here and elsewhere) and D. sechellia (Dsec: 14021-0248.07 (07) and 28) (red bars, here and elsewhere). Left: box plots of oviposition preference index. In these and all other box plots, the middle line represents the median, and the lower and upper hinges indicate the first and third quartiles, respectively. Individual data points are overlaid on the box plots; point size is scaled by the total number of eggs laid in an assay (key at top right of the plot); data beyond the whiskers are considered outliers. For these and other box plots, statistically-significant differences from 0 (no preference) are indicated: ***P < 0.001; **P < 0.01; *P < 0.05; NS (not significant) P > 0.05 (Wilcoxon test with Bonferroni correction for multiple comparisons); N = 12 (representing 4 group assays, each scored on 3 successive days with fresh oviposition plates each day). Exact P values for the statistical comparisons are provided in the Source Data files. Right: bar plots of egg-laying rate per fly per day in these assays. Statistically-significant differences from the D. melanogaster CS strain are indicated: ***P < 0.001; **P < 0.01; *P < 0.05; NS P > 0.05 (Kruskal-Wallis rank sum test with Nemenyi post-hoc test). d Group oviposition preference assays, as in c, for noni juice versus apple cider vinegar; N = 12, as in c. e Single-fly oviposition preference assays for noni juice versus grape juice in agarose for the same strains as in c. Top: total number of eggs laid in each substrate by each female. Bottom left: oviposition preference index. Statistically-significant differences from 0 (no preference) are indicated as in c; N = 30–60 flies across 1-2 technical replicates (precise N values for these and all following assays are provided in the Source Data files). Bottom right: egg-laying rate, presented as in c. f Single-fly oviposition preference assays, as in e, for noni juice versus apple cider vinegar; N = 30–90 flies across 1–3 technical replicates.
Fig. 2
Fig. 2. D. sechellia make frequent substrate indentations during oviposition.
a Photo of the noni juice/agarose substrate at the end of a single-fly oviposition assay with D. sechellia illustrating the many indentations in the agarose surface and rare eggs. b Still images from high-speed movie sequences of D. sechellia oviposition behavior illustrating a digging event that does not lead to egg deposition, which results in the formation of a visible indentation on the substrate (left), and a digging event that culminates in egg deposition (right). The full movies are provided in Supplementary Movies 4 and 5. c Rate and distribution of egg-laying and indentation formation of different species and strains on different substrates in a single-fly two-choice oviposition assay with noni juice and apple cider vinegar (ACV) as oviposition substrates (indicated by different colors in the figure); N = 19–60 flies across 1-2 technical replicates. To obtain D. melanogaster ovoD1/+ females, ovoD1v24/Y/C(1)Dx,y,f males were crossed to D. melanogaster CS females. d Summed egg-laying and indentation rate of the experiments in c. Statistically-significant differences from the CS strain are indicated: ***P < 0.001; **P < 0.01; *P < 0.05; NS P > 0.05 (Kruskal-Wallis rank sum test with Nemenyi post-hoc test). Exact P values for the statistical comparisons are provided in the Source Data files.
Fig. 3
Fig. 3. Analysis of visual and textural contributions to D. sechellia’s noni preference.
a Single-fly oviposition preference assays in the dark for noni juice versus apple cider vinegar in agarose (fly strains as in Fig. 1c). Left: oviposition preference index. Statistically-significant differences from 0 (no preference) are indicated: ***P < 0.001; **P < 0.01 (Wilcoxon test with Bonferroni correction for multiple comparisons); N = 60 flies across 2 technical replicates. Right: egg-laying rate in these assays; Kruskal-Wallis rank sum test with Nemenyi post-hoc test. Statistically-significant differences from the D. melanogaster CS strain are indicated: ***P < 0.001; *P < 0.05; NS P > 0.05. b Group color preference assays in which flies are given a choice to enter two traps containing the same chemical stimulus (balsamic vinegar (D. melanogaster and D. simulans) or noni juice (D. sechellia)) and distinguished only by colored casings with different light and background conditions. Statistically-significant differences from 0 (no preference) are indicated: *P < 0.05; NS P > 0.05 (Wilcoxon test with Bonferroni correction for multiple comparisons); N = 12–24 assays across at least 2 technical replicates. c Single-fly oviposition preference assays testing between the agarose concentrations indicated at the top and 0.5% agarose in the counter-substrate. Both substrates contain apple cider vinegar (D. melanogaster and D. simulans) or noni juice (D. sechellia). Statistically-significant differences from 0 (no preference) are indicated: ***P < 0.001; **P < 0.01 *P < 0.05; NS P > 0.05 (Wilcoxon test with Bonferroni correction for multiple comparisons); N = 30–60 flies across 1-2 technical replicates. d Graph recapitulating data from c. Dots represent the mean values and the bars represent ± SEM. The statistical comparisons shown are between the most similar strains of the different species: ***P < 0.001; NS P > 0.05 (Kruskal-Wallis rank sum test with Nemenyi post-hoc test). e Close-up image of noni fruit illustrating the concentration of D. sechellia eggs in the pedicel cavity (where the fruit was attached to the stem) and in the flesh exposed by a skin break. Flies were placed in a group assay oviposition chamber containing whole noni fruits during 72 h. f Graph of stiffness of substrates of different agarose concentrations (in noni juice), overlaid with the stiffness ranges of unripe and ripe noni fruits (illustrated in the photos) within the pedicel cavity or on the external skin. Measurements were made using Semmes-Weinstein Monofilaments following the procedure described in. Exact P values for the statistical comparisons are provided in the Source Data files.
Fig. 4
Fig. 4. Olfactory pathways required for D. sechellia oviposition.
a Single-fly oviposition preference assays for noni juice versus apple cider vinegar in agarose for the indicated genotypes (Supplementary Table 1). The plots show the number of eggs laid per fly; N = 30–60 flies across 1-2 technical replicates. DsecIr75b1/2 is a transheterozygous mutant combination. b Quantification of the number of eggs and indentations on different substrates of the indicated genotypes; N = 30 (Dsec 07) and 58 (DsecIr8aGFP;Orco1) across 1-2 technical replicates. c Mean number (± SEM) of mature eggs per fly (i.e., a pair of ovaries) of the indicated genotypes. NS P > 0.05 (two-sample t-test); N = 9–10 flies. d Left: oviposition preference index for the assays shown in a. Statistically-significant differences from 0 (no preference) are indicated: ***P < 0.001; **P < 0.01; *P < 0.05; NS P > 0.05 (Wilcoxon test with Bonferroni correction for multiple comparisons); N = 30–60 flies across 1-2 technical replicates. Dsec 07 and DsecIr8aRFP are statistically-significantly different: P = 0.0328 (Wilcoxon test with Bonferroni correction). Right: egg-laying rate. Statistically-significant differences from the Dsec 07 strain are indicated: ***P < 0.001; *P < 0.05; NS P > 0.05 (Kruskal-Wallis rank sum test with Nemenyi post-hoc test). The non-significant preference index for the DsecIr8aGFP,Orco1 double mutant was calculated from the 4/60 animals that laid >2 eggs. Exact P values for the statistical comparisons are provided in the Source Data files.
Fig. 5
Fig. 5. Analysis of the effect of individual noni chemicals on oviposition.
a Single-fly oviposition assays of the indicated strains testing different odors and concentrations in an instant medium substrate. Oviposition preference index. Statistically-significant differences from 0 (no preference) are indicated: ***P < 0.001; **P < 0.01; *P < 0.05; NS P > 0.05 (Wilcoxon test with Bonferroni correction for multiple comparisons); N = 30–60 flies across 1-2 technical replicates. For Dsec 07 assays with 2-heptanone (indicated with a white rectangle), the low number of flies laying eggs prevented calculation of a preference index. b Egg-laying rate of the assays in a. Statistical comparisons of the effect of odors on egg-laying rate were performed across strains: ***P < 0.001; **P < 0.01; *P < 0.05; NS P > 0.05 (Kruskal-Wallis rank sum test with Nemenyi post-hoc test). Exact P values for the statistical comparisons are provided in the Source Data files.
Fig. 6
Fig. 6. D. sechellia Ir75b is required for hexanoic acid responses and sufficient to shift oviposition preference in D. melanogaster.
a Single-fly oviposition assays testing H2O versus 0.1% hexanoic acid and H2O versus 0.5% hexanoic acid in instant medium. Left: egg-laying rate. ***P < 0.001; *P < 0.05; NS P > 0.05 (Kruskal-Wallis rank sum test with Nemenyi post-hoc test). Right: oviposition preference indices are only shown for genotypes that laid at least 2 eggs in these assays. Statistically-significant differences from 0 (no preference) are indicated: ***P < 0.001; **P < 0.01; NS P > 0.05 (Wilcoxon test with Bonferroni correction for multiple comparisons); N = 30–83 flies across 1–3 technical replicates. b Mean number (± SEM) of mature eggs per pair of ovaries per fly. NS P > 0.05 (two-sample t-test); N = 9 flies. c Quantification of the number of eggs and indentations on different substrates of the indicated genotypes; N = 30 flies in 1 technical replicate. d Single-fly oviposition assays testing 0.05% hexanoic acid versus 0.05% butyric acid of D. melanogaster Ir75b mutant and rescue genotypes. Left: egg-laying rate for Ir75b-Gal4 control (w;Ir75b-Gal4/+;Ir75bDsRed), UAS-DmelIr75b control (w;UAS-DmelIr75b/+;Ir75bDsRed), UAS-DsecIr75b control (w;UAS-DsecIr75b/+;Ir75bDsRed), DmelIr75b rescue (w;Ir75b-Gal4/UAS-DmelIr75b;Ir75bDsRed), and DsecIr75b rescue (w;Ir75b-Gal4/UAS-DsecIr75b;Ir75bDsRed). Both rescue strains showed small but significant reduction in the number of eggs compared to DmelIr75b-Gal4 control. Right: oviposition preference indices for these genotypes. No significant differences were detected between Ir75b-Gal4 control, UAS-DmelIr75b control and DmelIr75b rescue strains. The DsecIr75b rescue strain showed a significant shift in preference toward 0.05% hexanoic acid compared to both DmelIr75b-Gal4 and UAS-DsecIr75b controls. ***P < 0.001; **P < 0.01 (Wilcoxon tests with Bonferroni correction for multiple comparisons); N = 28–55 flies per genotype measured across at least 2 technical replicates. e Schematic summarizing the contributions of different olfactory pathways to niche specialization in D. sechellia. Exact P values for the statistical comparisons are provided in the Source Data files.

References

    1. Sexton J. P., Montiel J., Shay J. E., Stephens M. R., Slatyer R. A. Evolution of Ecological Niche Breadth. Annual Review of Ecology, Evolution, and Systematics. 48, 183–206 (2017).
    1. Rundle HD, Nosil P. Ecological speciation. Ecol. Lett. 2005;8:336–352. doi: 10.1111/j.1461-0248.2004.00715.x. - DOI
    1. Seehausen O. African cichlid fish: a model system in adaptive radiation research. Proc. Biol. Sci. 2006;273:1987–1998. - PMC - PubMed
    1. Caillaud MC, Via S. Specialized Feeding Behavior Influences Both Ecological Specialization and Assortative Mating in Sympatric Host Races of Pea Aphids. Am. Nat. 2000;156:606–621. doi: 10.1086/316991. - DOI - PubMed
    1. Grant PR, Grant BR. Darwin’s finches. Curr. Biol. 2005;15:R614–R615. doi: 10.1016/j.cub.2005.08.014. - DOI - PubMed

Publication types

LinkOut - more resources