. 2023 May 26;14(1):3050.
doi: 10.1038/s41467-023-38784-z.

TRABID inhibition activates cGAS/STING-mediated anti-tumor immunity through mitosis and autophagy dysregulation

Affiliations

TRABID inhibition activates cGAS/STING-mediated anti-tumor immunity through mitosis and autophagy dysregulation

Yu-Hsuan Chen et al. Nat Commun. .

Abstract

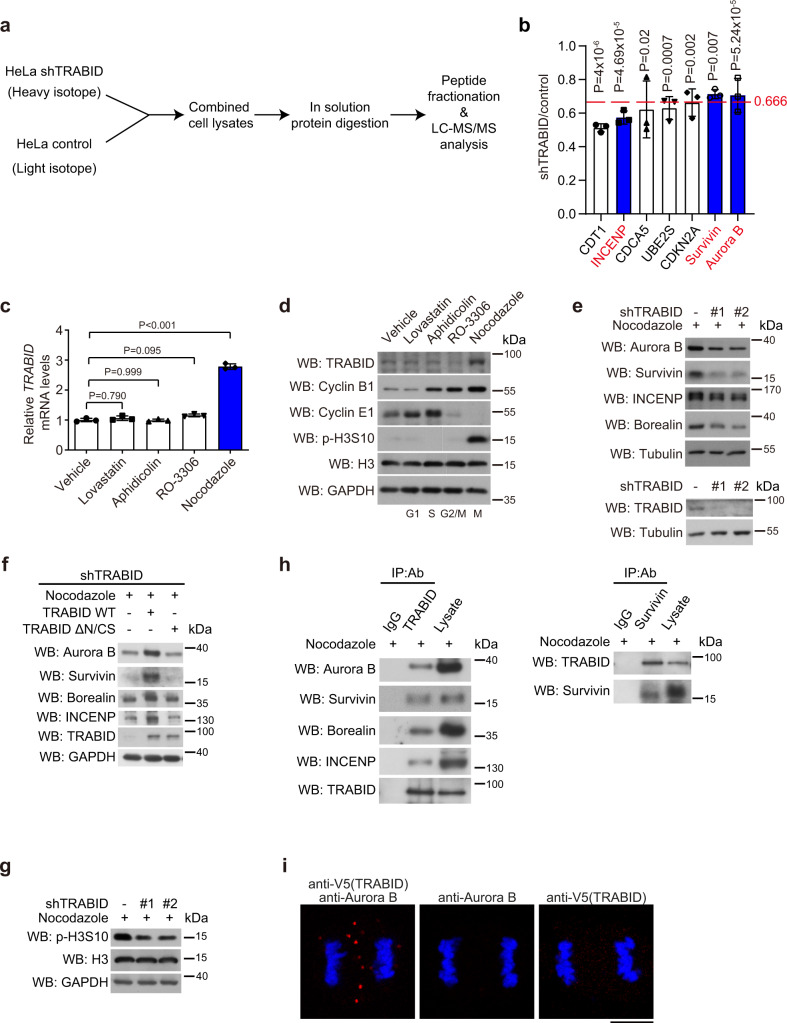
Activation of tumor-intrinsic innate immunity has been a major strategy for improving immunotherapy. Previously, we reported an autophagy-promoting function of the deubiquitinating enzyme TRABID. Here, we identify a critical role of TRABID in suppressing anti-tumor immunity. Mechanistically, TRABID is upregulated in mitosis and governs mitotic cell division by removing K29-linked polyubiquitin chain from Aurora B and Survivin, thereby stabilizing the entire chromosomal passenger complex. TRABID inhibition causes micronuclei through a combinatory defect in mitosis and autophagy and protects cGAS from autophagic degradation, thereby activating the cGAS/STING innate immunity pathway. Genetic or pharmacological inhibition of TRABID promotes anti-tumor immune surveillance and sensitizes tumors to anti-PD-1 therapy in preclinical cancer models in male mice. Clinically, TRABID expression in most solid cancer types correlates inversely with an interferon signature and infiltration of anti-tumor immune cells. Our study identifies a suppressive role of tumor-intrinsic TRABID in anti-tumor immunity and highlights TRABID as a promising target for sensitizing solid tumors to immunotherapy.


Conflict of interest statement

The authors declare no competing interests.

Figures

Fig. 1
Fig. 1. TRABID is required for proper mitotic cell division.
a Control (CTL) and Trabid KO (KO) MEFs stably expressing H2B-mCherry (to mark the chromosomes) were examined for mitotic cell division by time-lapse microscopy. Images were taken at 2 min intervals between acquisitions. Time (min) is given relative to the first time frame in late G2 phase. Mitotic errors such as chromosome bridge (arrowhead) and chromosome mis-segregation (arrow) were observed. Micronuclei in the interphase cells are marked by asterisks. Bars, 20 μm. b The duration from metaphase to mitotic exit (defined by cell re-attachment) of indicated cell types was counted. Data are mean ± SD (n = 3 independent experiments and >50 cells per group per experiment were counted). Each color represents an individual experiment. P values are determined by two-sided Student’s t-test. cg The percentages of mitotic cells showing lagging chromosomes (c), mis-segregated chromosomes (d), chromosome bridges (e), mitotic errors (f), and cytokinesis failure (g) were counted. Data are mean ± SD (n = 3 independent experiments and >50 cells per group per experiment were counted). P values are determined by two-sided Student’s t-test. h Mitotic errors observed from HeLa cells stably expressing control or TRABID shRNA together with H2B-mCherry. TRABID expression levels and representative time-lapse images are shown in Supplementary Fig. 1i, j, respectively. Data are mean ± SD (n = 3 independent experiments and >50 cells per group per experiment were counted). P values are determined by one-way ANOVA with Tukey’s post hoc test. i, j Mitotic errors observed from HeLa cells stably expressing H2B-mCherry and transfected with TRABID siRNA (i) or TRABID siRNA together with TRABID wild type or ΔN/CS construct (j). Data are mean ± SD (n = 3 independent experiments and >50 cells per group per experiment were counted). P values are determined by two-sided Student’s t-test. The expression levels of TRABID and mutant are shown. Blots in (i), (j) are representatives of three independent experiments. Source data are provided as a Source Data file.
Fig. 2
Fig. 2. TRABID is upregulated in M phase to control CPC abundance.
a Experimental workflow of SILAC-based analysis of proteome changes by TRABID knockdown. b Mitotic cell division regulators that are significantly downregulated by TRABID depletion as revealed by LC-MS/MS. Data are mean ± SD, n = 3 independent experiments. P values are determined by two-sided Student’s t-test. c, d RT-qPCR (c) and Western blot (d) analyzes of TRABID mRNA and protein levels in HeLa cells treated with 10 μM lovastatin, 2 μg/ml aphidicolin, 10 μM RO-3306, or 3 μM nocodazole for 18 h. Data are mean ± SD, n = 3 independent experiments. P values are determined by one-way ANOVA with Tukey’s post hoc test. eg Western blot analysis of indicated proteins in HeLa cells stably expressing control or TRABID shRNAs together with or without TRABID wild type or TRABIDΔN/CS and synchronized in M phase by treatment with 3 μM nocodazole for 18 h. The knockdown efficiencies of shRNAs are shown in (e). h Reciprocal immunoprecipitation analyzes of the interactions between TRABID and CPC components in HeLa cells treated with 3 μM nocodazole for 18 h. i HeLa cells transiently expressing V5-TRABID were synchronized at G2 by treatment with 10 μM RO-3306 for 16 h and then released to proceed the cell cycle for 40 min before monitoring the PLA signal with indicated antibodies. Bar, 10 μm. Blots or images are representatives of three (for d, e, g, h) or two (for f, i) independent experiments. Source data are provided as a Source Data file.
Fig. 3
Fig. 3. TRABID deubiquitinates and stabilizes Aurora B and Survivin.
ad Western blot analysis of GFP-Aurora B and Flag-Survivin ubiquitination in 293 T cells transfected with indicated constructs (a, b) or HeLa derivatives as in Fig. 2e transfected with indicated constructs and treated with 3 μM nocodazole for 18 h (c, d). Cells were treated with MG132 to preserve the ubiquitination signals. e, f Analysis of the K29-linked ubiquitination on endogenous Aurora B and Survivin in HeLa derivatives as in Fig. 2e transfected with His-ubiquitin and treated with 3 μM nocodazole for 18 h. Cells were treated with MG132 to preserve the ubiquitination signals. g In vitro binding assay by incubating baculovirally purified His-TRABID with Flag-Survivin or GFP-Aurora B bound on beads. h, i In vitro deubiquitination assay. Aurora B or Survivin was immunoprecipitated from 293 T cells transfected with His-ubiquitin and GFP-Aurora B or Flag-Survivin and incubated with purified His-TRABID. Aurora B and Survivin K29-ubiquitination was determined by Western blot with sAB-K29. The purity of His-TRABID was shown in (h). j Western blot analysis of Aurora B and Survivin in HeLa derivatives as shown in Fig. 2e, treated with 3 μM nocodazole for 18 h, and with 100 μg/ml cycloheximide for indicated time points. The levels of Aurora B and Survivin were normalized with that of internal control and plotted. Data are mean ± SD, n = 3 independent experiments. P values are determined by two-way ANOVA with Tukey’s post hoc test. k Western blot analysis of Aurora B and Survivin in indicated HeLa derivatives treated with 3 μM nocodazole for 18 h and then with or without 5 μM MG132 for 6 h. For (ak), blots are representatives of three independent experiments. Source data are provided as a Source Data file.
Fig. 4
Fig. 4. TRABID deficiency induces micronuclei through mitosis and autophagy defects.
a, b HeLa or B16F10 cells stably expressing control or TRABID shRNAs were stained with DAPI. Representative images and the percentages of cells with micronuclei are shown. Bar, 10 μm. c FISH analysis of centromeres on HeLa cells stably expressing TRABID shRNA. Boxed areas are enlarged to show micronuclei with centromere signals. Bar, 10 μm. d, e HeLa cells stably expressing control or TRABID shRNAs were transiently transfected with indicated constructs and treated with or without 100 nM bafilomycin A1 for 16 h. Cells were stained with DAPI and then examined for micronuclei by confocal microscopy. Representative images, the percentages of cells with micronuclei, and the expression levels of various proteins are shown. Bar, 10 μm. Blots are representatives of two independent experiments. Notably, GFP-Aurora B was used for transfection in d and its position is marked. f HeLa cells stably expressing control or TRABID shRNAs were transiently transfected with VPS34 and then stained with LC3 antibody and DAPI. Representative images are shown. Boxed areas are enlarged and shown in the inset or below. Bars, 5 μm. Micronuclei that are colocalized or surrounded by LC3 signals are indicated by arrows. Yellow lines indicate the paths along which the relative intensities of LC3 and DAPI were quantified and plotted (labeled with “1” or “2” to indicate the corresponding images). The percentages of cells with LC3+ micronuclei are shown. Data in (a), (b), (d), (e), (f) are mean ± SD (n = 3 independent experiments and >20 cells per group per experiment were counted). P values are determined by one-way (a, b, d, e) or two-way (f) ANOVA with Tukey’s post hoc test. Source data are provided as a Source Data file.
Fig. 5
Fig. 5. TRABID deficiency attenuates cGAS autophagic degradation and activates cGAS/STING axis.
a, b Western blot analysis of cGAS levels in HeLa derivatives as in Supplementary Fig. 3g and treated with or without 100 nM Bafilomycin A1 for 16 h or TRABID shRNA-expressing HeLa cells as in Fig. 2e transiently transfected with VPS34. c Western blot analysis of cGAS levels in HeLa cells transfected with or without VPS34 and treated with 3 μM TRABID inhibitor for 24 h. d Lyso-IP analysis of cGAS levels in lysosomes isolated from HeLa cells stably expressing Aurora B shRNAs or TRABID shRNAs and transiently transfected with Flag-TMEM192. e, g, m Western blot analysis of indicated proteins in HeLa cells stably expressing control or TRABID shRNAs. f Flag-STING was immunoprecipitated from HeLa cells stably expressing control or TRABID shRNAs and transfected with Flag-STING, followed by Western blot analysis with indicated antibodies. h Immunofluorescence staining of p65 in HeLa cells stably expressing control or TRABID shRNAs. Representative confocal images and quantitative data are shown. Bar, 10 μm. Data are mean ± SD (n = 3 independent experiments and >30 cells per group per experiment were counted). P values are determined by one-way ANOVA with Tuckey’s post hoc test. I, j ELISA for IFNβ secretion (i) or luciferase assay for IFNβ promoter activity (j) of HeLa cells stably expressing indicated shRNAs. k, l, n RT-qPCR analysis of indicated genes in HeLa cells stably expressing control or TRABID shRNAs (k), HeLa cells treated with vehicle or 3 μM TRABID inhibitor for 24 h (l), or HeLa cells transfected with indicated constructs and treated with vehicle or 3 μM TRABID inhibitor for 24 h (n). Data are normalized to the control cells or untreated control and expressed as fold changes. The expression levels of various proteins are shown in (n). The position of GFP-Aurora B, which was used for transfection, is marked. Data in (i), (j), (k), (l), (n) are mean ± SD, n = 3 independent experiments. P values are determined by two-sided Student’s t test (l), or one-way ANOVA with Tuckey’s post hoc test (i, j, k, n). Blots are representatives of three (for ac and eg) or two (for d, m, n) independent experiments. Source data are provided as a Source Data file.
Fig. 6
Fig. 6. TRABID knockdown in tumor cells induces an anti-tumor immune microenvironment.
a, b Tumor volume at indicated days and tumor weight at day 15 after C57BL/6 mice inoculated with B16F10 cells expressing control or Trabid shRNAs. Data are mean ± SD (n = 6 per group). P values are determined by two-way (a) or one-way (b) ANOVA with Tukey’s post hoc test. c Kaplan–Meier survival curves for C57BL/6 mice inoculated with B16F10 cells expressing control or Trabid shRNAs. P values are determined by log rank Mantel Cox test, n = 6. d, e Tumor volume at indicated days and tumor weight at day 18 after C57BL/6 mice inoculated with B16F10 cells expressing Trabid shRNAs and reconstituted with Trabid wild type or ΔN/CS mutant. Data are mean ± SD (n = 5 per group). P values are determined by two-side Student’s t-test. f, g Tumor volume at indicated days and tumor weight at day 15 after Nude mice inoculated with B16F10 cells expressing control or Trabid shRNAs. Data are mean ± SD (n = 5 per group). P values are determined by two-way (f) or one-way (g) ANOVA with Tukey’s post hoc test. ho Flow cytometry analysis for the percentages of indicated types of tumor-infiltrating immune cells in the tumor tissues taken from day 15 of C57BL/6 mice after inoculation with B16F10 cells expressing control or Trabid shRNAs. Data are mean ± SD (n = 4 per group). P values are determined by one-way ANOVA with Tukey’s post hoc test. (p, q) Tumor volume at indicated days and tumor weight at day 15 after C57BL/6 mice inoculated with B16F10 cells expressing Trabid shRNA and treated with vehicle or C176. Data are mean ± SD (n = 5 per group). P values are determined by two-sided Student’s t test. Source data are provided as a Source Data file.
Fig. 7
Fig. 7. TRABID targeting enhances the anti-tumor functions of PD-1 antibody.
a Schematic presentation of the experimental workflow. C57BL/6 mice subcutaneously inoculated with B16F10 cells were injected with anti-PD-1 antibody and/or TRABID inhibitor as indicated. b, c Tumor volume at indicated days and tumor weight at day 15 are plotted. Data are mean ± SD (n = 6 animals). P values are determined by two-way ANOVA (b) or one-way ANOVA (c) with Tukey’s post hoc test. d Kaplan-Meier survival curves for C57BL/6 mice bearing B16F10 tumors and treated as in (a). P values are determined by log rank Mantel Cox test, n = 5. el Flow cytometry analysis for the percentages of indicated types of tumor-infiltrating immune cells in the tumor tissues taken from day 15 of C57BL/6 mice after inoculation with B16F10 cells and treated as in (a). Data are mean ± SD (n = 4 per group). P values are determined by one-way ANOVA with Tukey’s post hoc test. Source data are provided as a Source Data file.
Fig. 8
Fig. 8. TRABID expression correlates negatively with an anti-tumor immune microenvironment across diverse cancer types.
a Heatmap showing the correlation of TRABIID gene expression level with the expression levels of indicated genes. Data were retrieved from TCGA datasets. Cancer types are labeled on the x axis. P value are determined by Pearson’s correlation. b, c Heatmap showing the correlation of TRABID gene expression levels with the infiltration of indicated anti-tumor (b) or pro-tumor (c) immune cells. Correlations were obtained through the TIMER2.0 website. Cancer types and immune cells types are labeled on the x and y axes, respectively. P value are determined by Spearman’s correlation. d Schematic representation for the role of TRABID targeting in the activation of cGAS/STING pathway to trigger anti-tumor immunity and ICB sensitization. Source data are provided as a Source Data file.

References

    1. Larkin J, et al. Five-Year Survival with Combined Nivolumab and Ipilimumab in Advanced Melanoma. N. Engl. J. Med. 2019;381:1535–1546. doi: 10.1056/NEJMoa1910836. - DOI - PubMed
    1. Morad G, Helmink BA, Sharma P, Wargo JA. Hallmarks of response, resistance, and toxicity to immune checkpoint blockade. Cell. 2021;184:5309–5337. doi: 10.1016/j.cell.2021.09.020. - DOI - PMC - PubMed
    1. Socinski MA, et al. Atezolizumab for First-Line Treatment of Metastatic Nonsquamous NSCLC. N. Engl. J. Med. 2018;378:2288–2301. doi: 10.1056/NEJMoa1716948. - DOI - PubMed
    1. Pitt JM, et al. Resistance Mechanisms to Immune-Checkpoint Blockade in Cancer: Tumor-Intrinsic and -Extrinsic Factors. Immunity. 2016;44:1255–1269. doi: 10.1016/j.immuni.2016.06.001. - DOI - PubMed
    1. Demaria O, et al. Harnessing innate immunity in cancer therapy. Nature. 2019;574:45–56. doi: 10.1038/s41586-019-1593-5. - DOI - PubMed

Publication types

Substances