. 2023 May 26;13(1):8588.
doi: 10.1038/s41598-023-34808-2.

Plasma metabolomics of oral squamous cell carcinomas based on NMR and MS approaches provides biomarker identification and survival prediction

Affiliations

Plasma metabolomics of oral squamous cell carcinomas based on NMR and MS approaches provides biomarker identification and survival prediction

Giovana Mussi Polachini et al. Sci Rep. .

Abstract

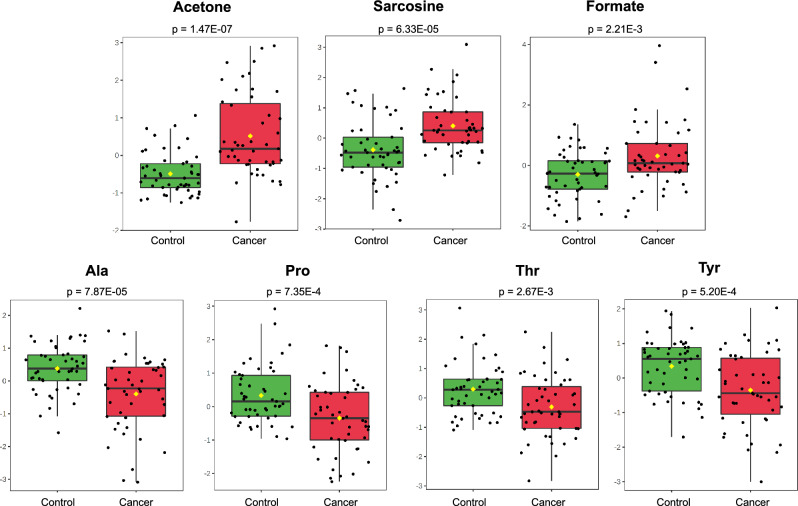
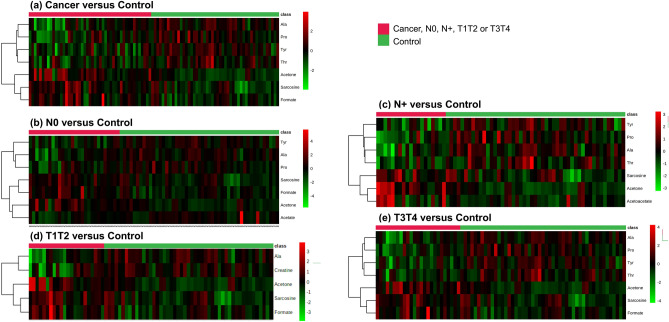
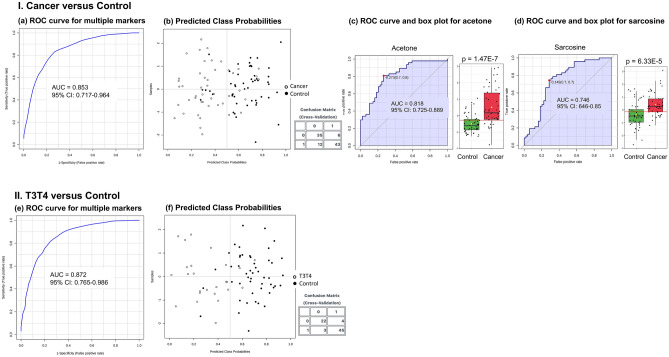
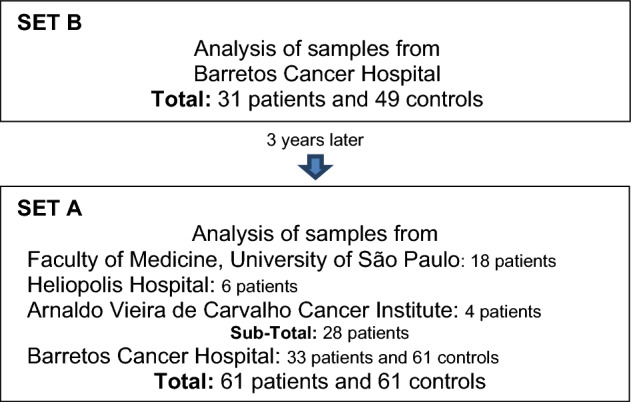
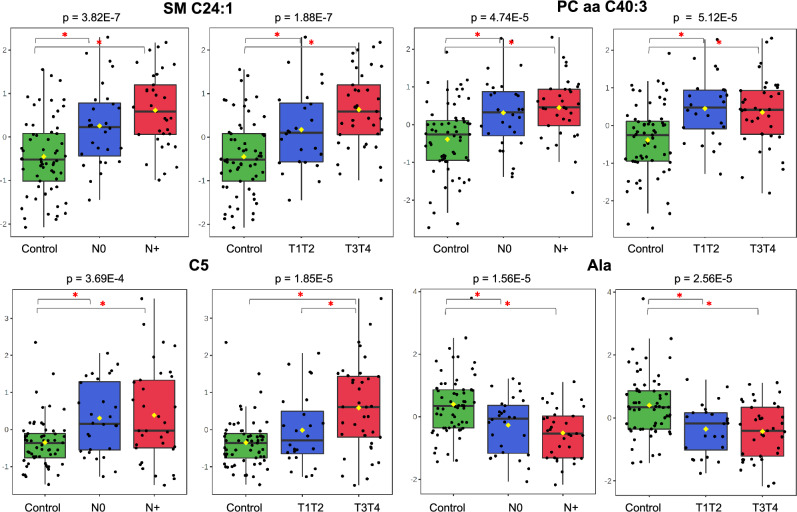
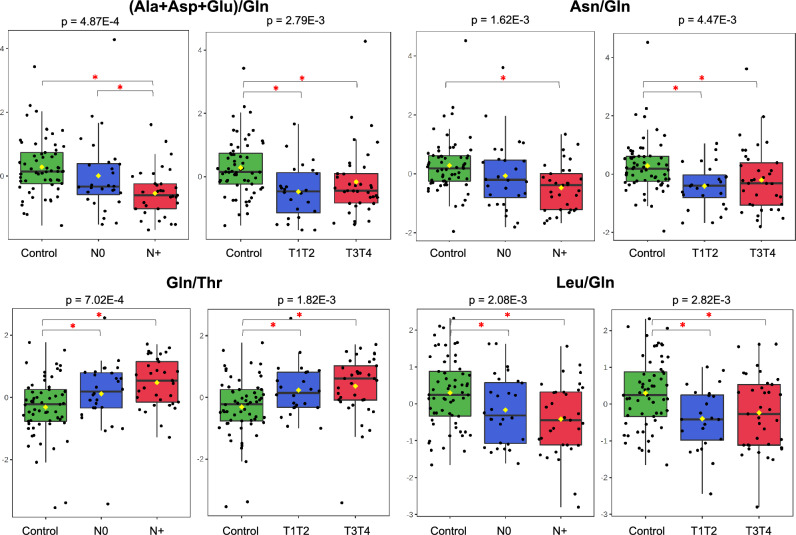
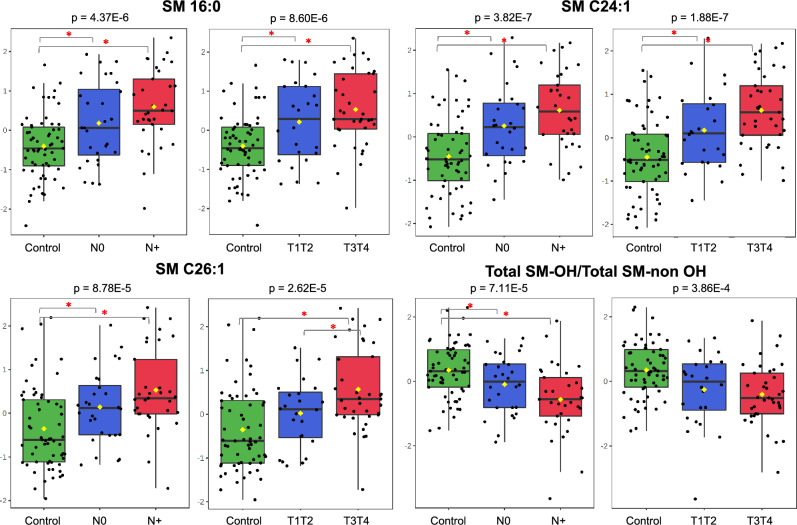
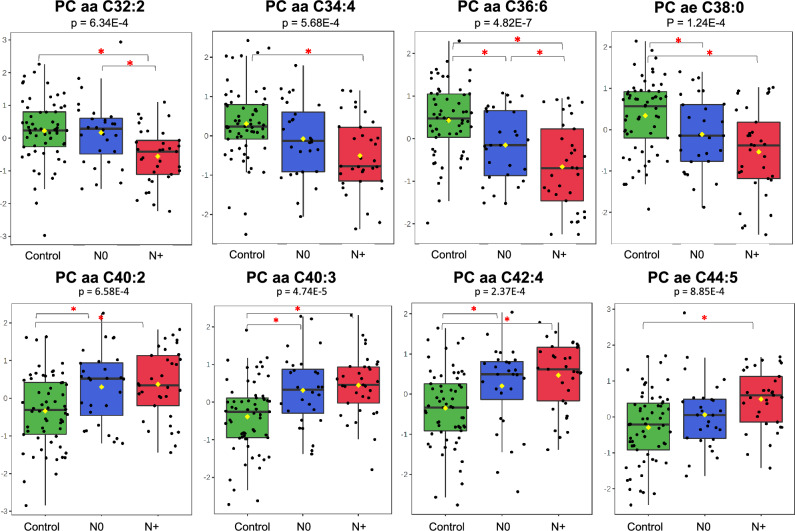
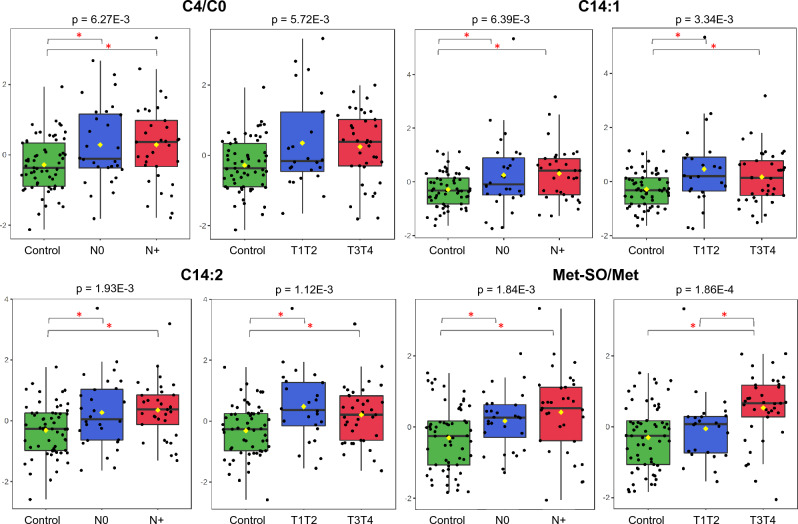
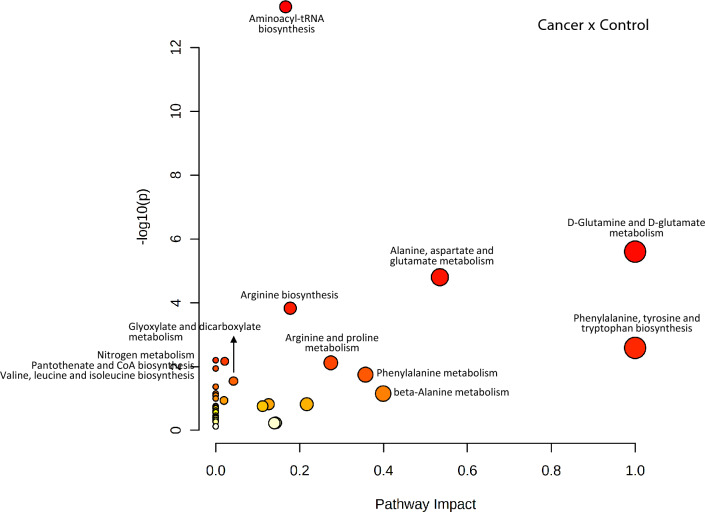
Metabolomics has proven to be an important omics approach to understand the molecular pathways underlying the tumour phenotype and to identify new clinically useful markers. The literature on cancer has illustrated the potential of this approach as a diagnostic and prognostic tool. The present study aimed to analyse the plasma metabolic profile of patients with oral squamous cell carcinoma (OSCC) and controls and to compare patients with metastatic and primary tumours at different stages and subsites using nuclear magnetic resonance and mass spectrometry. To our knowledge, this is the only report that compared patients at different stages and subsites and replicates collected in diverse institutions at different times using these methodologies. Our results showed a plasma metabolic OSCC profile suggestive of abnormal ketogenesis, lipogenesis and energy metabolism, which is already present in early phases but is more evident in advanced stages of the disease. Reduced levels of several metabolites were also associated with an unfavorable prognosis. The observed metabolomic alterations may contribute to inflammation, immune response inhibition and tumour growth, and may be explained by four nonexclusive views-differential synthesis, uptake, release, and degradation of metabolites. The interpretation that assimilates these views is the cross talk between neoplastic and normal cells in the tumour microenvironment or in more distant anatomical sites, connected by biofluids, signalling molecules and vesicles. Additional population samples to evaluate the details of these molecular processes may lead to the discovery of new biomarkers and novel strategies for OSCC prevention and treatment.


Conflict of interest statement

The authors declare no competing interests.

Figures

Figure 1
Figure 1
Plasma NMR metabolic profiles discriminate OSCC patients from controls and suggests elevated ketogenesis, active oxidative metabolism and epigenetic alterations in patients. T-test p values (p ≤ 0.05) and box plots of acetone, sarcosine, formate, alanine (Ala), proline (Pro), threonine (Thr) and tyrosine (Tyr) in cancer and control samples.
Figure 2
Figure 2
Plasma NMR metabolic profiles discriminate OSCC stage subgroups from controls. Heatmap using the top metabolites differentially expressed in (a) Cancer versus Control; (b) N0, (c) N+, (d) T1T2, (e) T3T4 versus Control. Top bar: cancer samples in red, control samples in green. Vertical bar: the colors represent the mean concentration of metabolites—red and green values indicate over- and underexpression, respectively (t-test, p < 0.05).
Figure 3
Figure 3
Multivariate ROC curve based on the NMR data was able to discriminate cases and subgroups from controls and showed a higher prediction power for larger tumours. I. Cancer versus Control. (a) ROC curve for multiple markers; (b) Plot of predicted class probabilities for all samples; (c) Univariate ROC curve and box plot of acetone; (d) Univariate ROC curve and box plot of sarcosine II. T3T4 versus Control. (e) ROC curve for multiple markers; (f) Plot of predicted class probabilities for all samples.
Scheme 1
Scheme 1
Analysis of set A and B samples.
Figure 4
Figure 4
Plasma MS metabolic profile shows a shift from normal to early tumour phases followed by pronounced changes in more advanced tumours. Sphingomyelin SM C24:1, phosphatidylcholine PC aa C40:3, acylcarnitine C5 and amino acid Ala levels (Y-axis) in controls and in N0, N+, T1T2, T3T4 stages (X-axis) (one-way ANOVA, Fisher’s LSD).
Figure 5
Figure 5
As deduced by the metabolite ratios, several amino acid levels based on the MS data show an expression pattern opposite to that of glutamine. (Ala + Asp + Glu)/Gln; Asn/Gln; Gln/Thr and Leu/Gln levels (Y-axis) in controls, and in N0, N+, T1T2, T3T4 stages (X-axis) (one-way ANOVA, Fisher’s LSD).
Figure 6
Figure 6
High plasma sphingolipid levels suggest a crosstalk between cancer and normal cells for lipid or exosome release. Sphingomyelins SM C16:0, SM C24:1, SM C26:1 and total SMs (nonOH) showed significantly higher levels (Y-axis) in N0, N+, T1T2, T3T4 stages (X-axis) compared with controls (one-way ANOVA, Fisher’s LSD).
Figure 7
Figure 7
Alterations in choline transporters or in activities of biosynthetic enzymes are suggested by the MS data. Phosphatidylcholines with fatty acid chains totalling 32 to 38 carbons, or totalling more than 38 carbons were present at low or high levels (Y-axis), respectively, in N0 and N+ stages compared with controls (X-axis) (one-way ANOVA, Fisher’s LSD).
Figure 8
Figure 8
Mitochondrial dysfunction and oxidative stress were observed in the plasma MS data from patients. Acylcarnitine C14:1, C14:2 levels, and C4/C0, Met-SO/Met ratios (Y-axis) were increased in N0, N+, T1T2 or T3T4 stages compared with controls (X-axis), suggesting significant oxidative stress and potentially mitochondrial disfunction in OSCC patients (one-way ANOVA, Fisher’s LSD).
Figure 9
Figure 9
Metabolic pathway enrichment and topology analyses using the MetaboAnalyst platform and 72 important features identified by t-tests (p < 0.05) comparing MS data from Cancer versus Control (set A). Each data point of the graph represents a biologic pathway with quantified plasma metabolites.
Figure 10
Figure 10
Prognostic significance of plasma metabolites and metabolite ratios. Kaplan–Meier survival curves for HNSCC patients stratified by seven plasma metabolites and metabolite ratios with a cut-off according to the Youden index: (a) PC aa C32:2; (b) PC aa C34:4; (c) PC aa C36:5; (d) PC aa C36:6; (e) PC ae 34:2; (f) (Ala/Gln)/(Tyr/Phe). HR = Hazard Ratio; CI = 95% Confidence Interval.

References

    1. Emwas AH, et al. NMR spectroscopy for metabolomics research. Metabolites. 2019 doi: 10.3390/metabo9070123. - DOI - PMC - PubMed
    1. Barrilero R, et al. Unravelling and quantifying the “NMR-invisible” metabolites interacting with human serum albumin by binding competition and T2 relaxation-based decomposition analysis. J. Proteome Res. 2017;16:1847–1856. doi: 10.1021/acs.jproteome.6b00814. - DOI - PubMed
    1. Psychogios N, et al. The human serum metabolome. PLoS ONE. 2011;6:e16957. doi: 10.1371/journal.pone.0016957. - DOI - PMC - PubMed
    1. Wang ZF, You YL, Li FF, Kong WR, Wang SQ. Research progress of NMR in natural product quantification. Molecules. 2021 doi: 10.3390/molecules26206308. - DOI - PMC - PubMed
    1. Haukaas TH, Euceda LR, Giskeodegard GF, Bathen TF. 2017. Metabolic portraits of breast cancer by HR MAS MR spectroscopy of intact tissue samples. Metabolites. - DOI - PMC - PubMed

Publication types

MeSH terms

Substances