

Different MRI structural processing methods do not impact functional connectivity computation
- PMID: 37237072
- PMCID: PMC10219948
- DOI: 10.1038/s41598-023-34645-3
Different MRI structural processing methods do not impact functional connectivity computation
Abstract
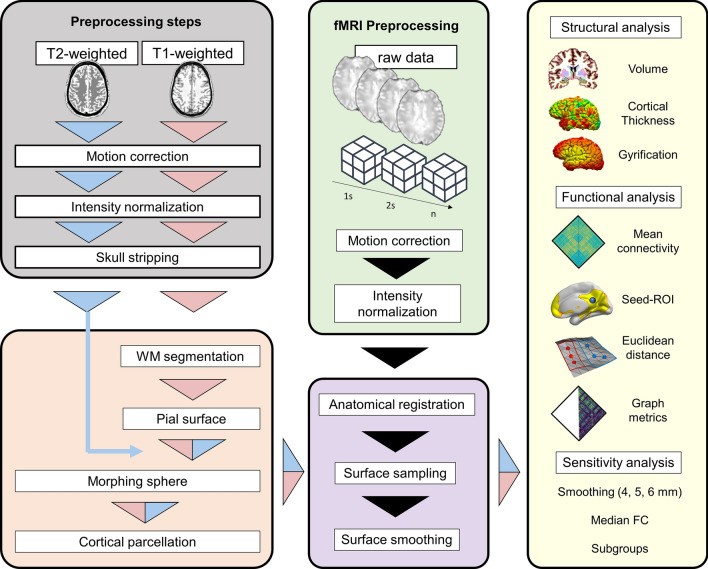
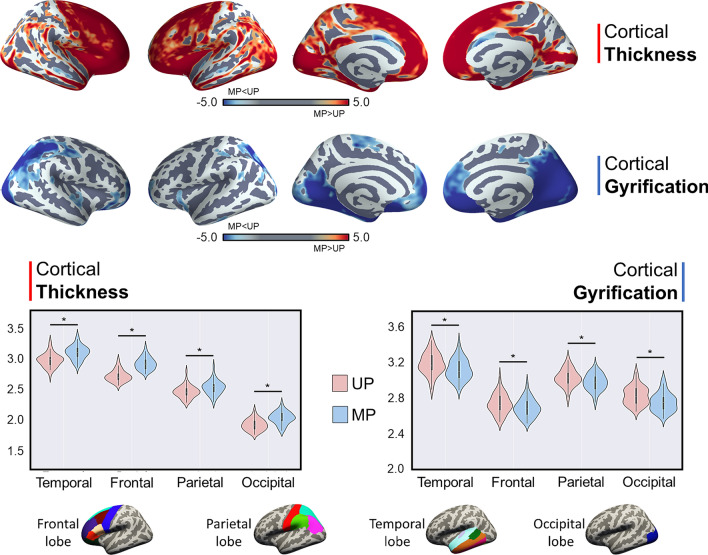
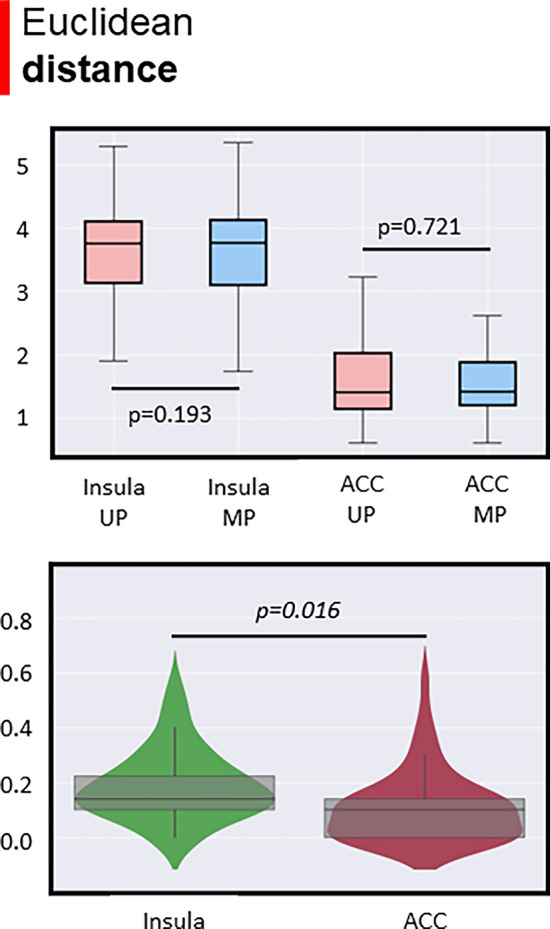
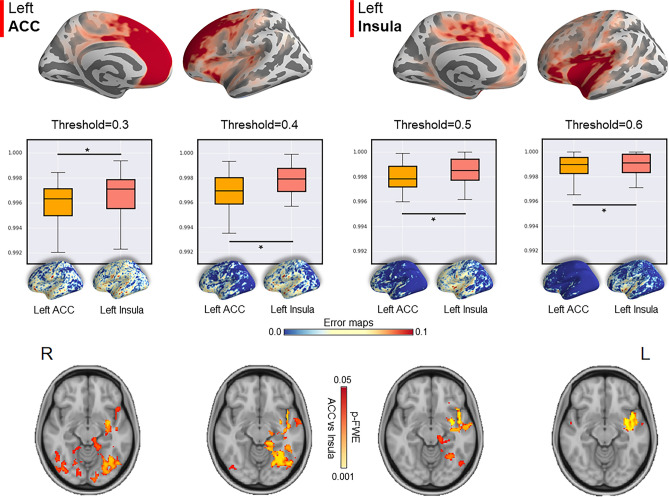
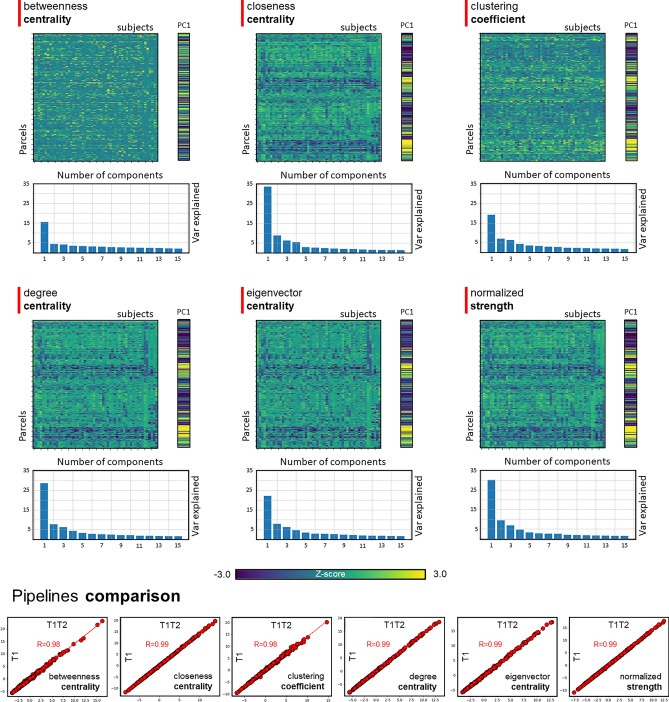
Resting-state functional magnetic resonance imaging (rs-fMRI) has become an increasingly popular technique. This technique can assess several features of brain connectivity, such as inter-regional temporal correlation (functional connectivity), from which graph measures of network organization can be derived. However, these measures are prone to a certain degree of variability depending on the analytical steps during preprocessing. Many studies have investigated the effect of different preprocessing steps on functional connectivity measures; however, no study investigated whether different structural reconstructions lead to different functional connectivity metrics. Here, we evaluated the impact of different structural segmentation strategies on functional connectivity outcomes. To this aim, we compared different metrics computed after two different registration strategies. The first strategy used structural information from the 3D T1-weighted image (unimodal), while the second strategy implemented a multimodal approach, where an additional registration step used the information from the T2-weighted image. The impact of these different approaches was evaluated on a sample of 58 healthy adults. As expected, different approaches led to significant differences in structural measures (i.e., cortical thickness, volume, and gyrification index), with the maximum impact on the insula cortex. However, these differences were only slightly translated to functional metrics. We reported no differences in graph measures and seed-based functional connectivity maps, but slight differences in the insula when we compared the mean functional strength for each parcel. Overall, these results suggested that functional metrics are only slightly different when using a unimodal compared to a multimodal approach, while the structural output can be significantly affected.
© 2023. The Author(s).
Conflict of interest statement
The authors declare no competing interests.
Figures

Similar articles
-
An evaluation of the efficacy, reliability, and sensitivity of motion correction strategies for resting-state functional MRI.Neuroimage. 2018 May 1;171:415-436. doi: 10.1016/j.neuroimage.2017.12.073. Epub 2017 Dec 24. Neuroimage. 2018. PMID: 29278773
-
Altered functional organization within the insular cortex in adult males with high-functioning autism spectrum disorder: evidence from connectivity-based parcellation.Mol Autism. 2016 Oct 5;7:41. doi: 10.1186/s13229-016-0106-8. eCollection 2016. Mol Autism. 2016. PMID: 27713815 Free PMC article.
-
Structurofunctional resting-state networks correlate with motor function in chronic stroke.Neuroimage Clin. 2017 Jul 29;16:610-623. doi: 10.1016/j.nicl.2017.07.002. eCollection 2017. Neuroimage Clin. 2017. PMID: 28971011 Free PMC article.
-
A survey on applications and analysis methods of functional magnetic resonance imaging for Alzheimer's disease.J Neurosci Methods. 2019 Apr 1;317:121-140. doi: 10.1016/j.jneumeth.2018.12.012. Epub 2018 Dec 26. J Neurosci Methods. 2019. PMID: 30593787 Review.
-
Biophysical and neural basis of resting state functional connectivity: Evidence from non-human primates.Magn Reson Imaging. 2017 Jun;39:71-81. doi: 10.1016/j.mri.2017.01.020. Epub 2017 Feb 2. Magn Reson Imaging. 2017. PMID: 28161319 Free PMC article. Review.
Cited by
-
Brain MRI Biomarkers in Isolated Rapid Eye Movement Sleep Behavior Disorder: Where Are We? A Systematic Review.Brain Sci. 2023 Sep 30;13(10):1398. doi: 10.3390/brainsci13101398. Brain Sci. 2023. PMID: 37891767 Free PMC article. Review.
-
Brain-wide dynamic coactivation states code for hand movements in the resting state.Proc Natl Acad Sci U S A. 2025 Mar 18;122(11):e2415508122. doi: 10.1073/pnas.2415508122. Epub 2025 Mar 12. Proc Natl Acad Sci U S A. 2025. PMID: 40073058 Free PMC article.
-
Non-invasive prehabilitation to foster widespread fMRI cortical reorganization before brain tumor surgery: lessons from a case series.J Neurooncol. 2024 Oct;170(1):185-198. doi: 10.1007/s11060-024-04774-4. Epub 2024 Jul 23. J Neurooncol. 2024. PMID: 39044115 Free PMC article. Clinical Trial.
References
Publication types
MeSH terms
LinkOut - more resources
Full Text Sources
Medical
Research Materials
