. 2023 May;4(5):754-773.
doi: 10.1038/s43018-023-00550-x. Epub 2023 May 26.

Genome-scale functional genomics identify genes preferentially essential for multiple myeloma cells compared to other neoplasias

Affiliations

Genome-scale functional genomics identify genes preferentially essential for multiple myeloma cells compared to other neoplasias

Ricardo de Matos Simoes et al. Nat Cancer. 2023 May.

Abstract

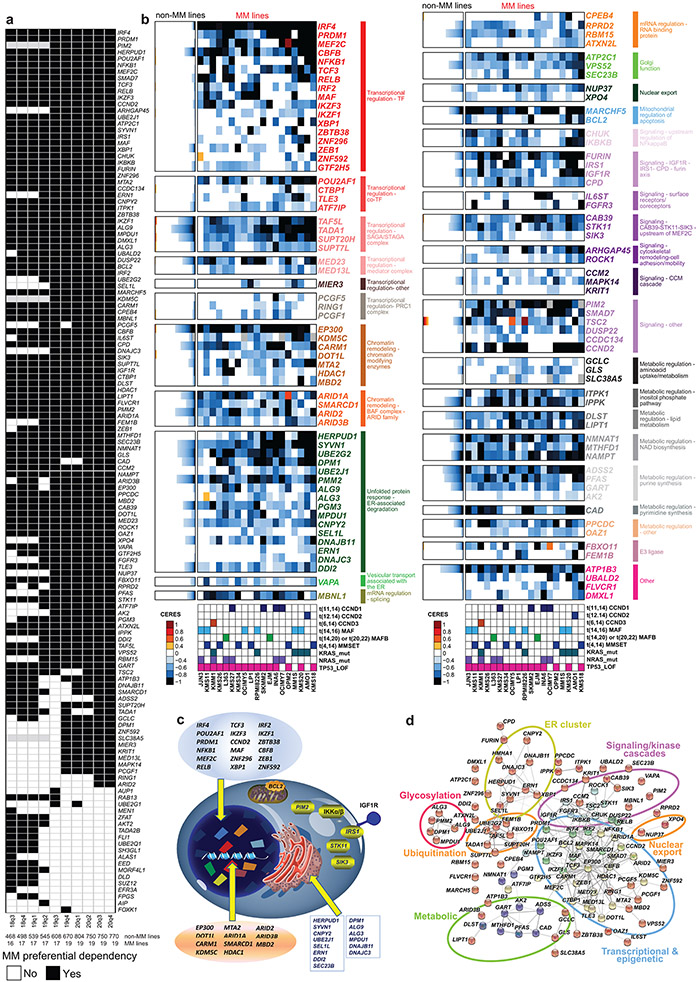
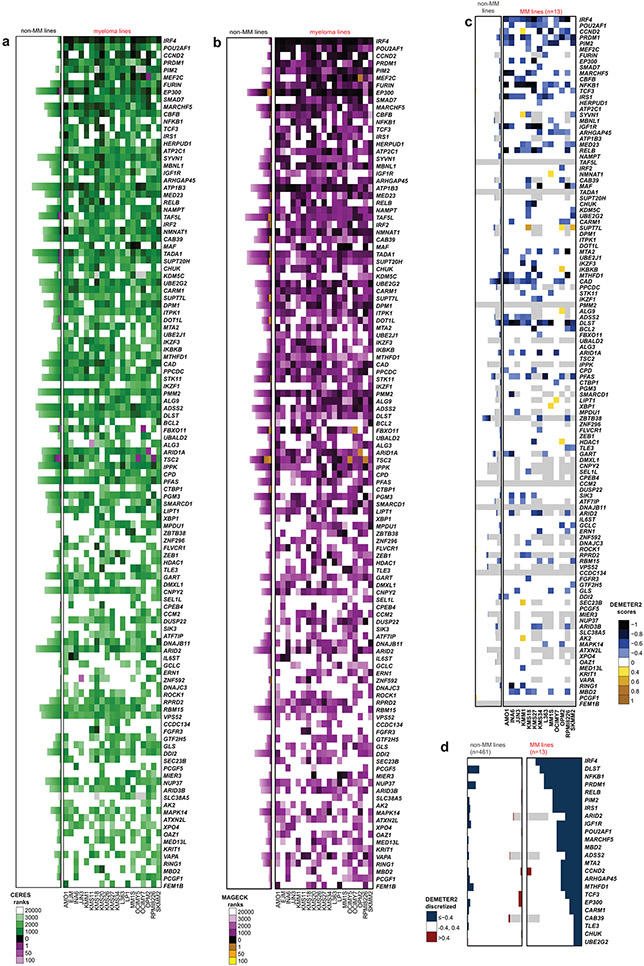
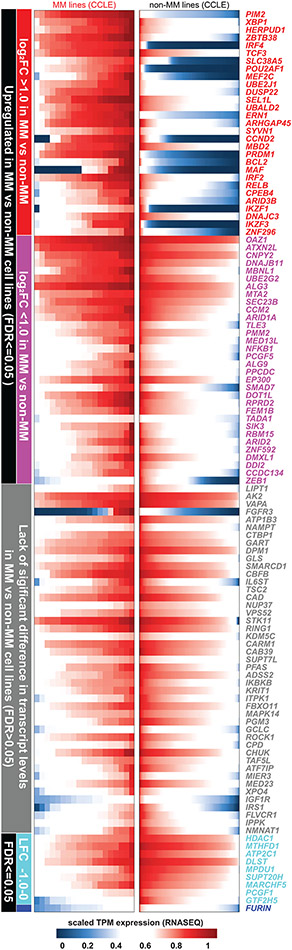
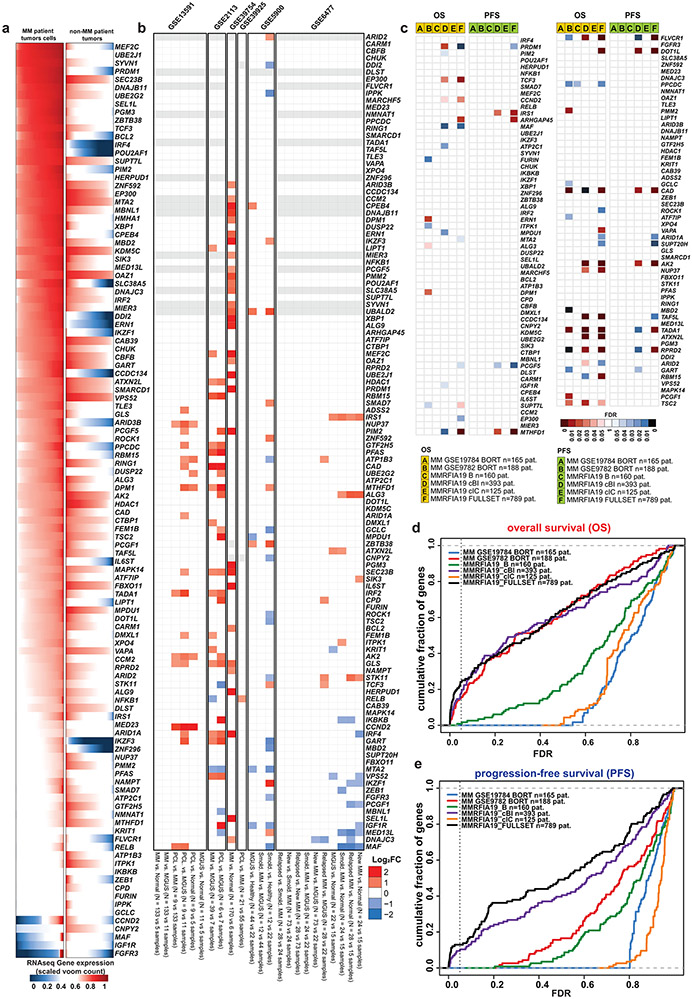
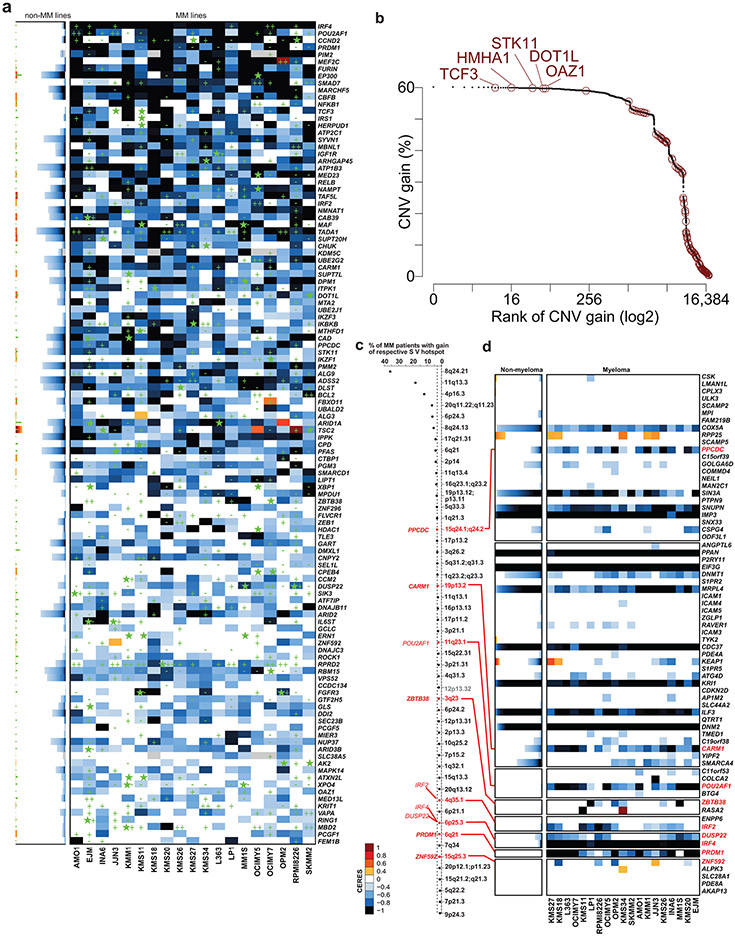
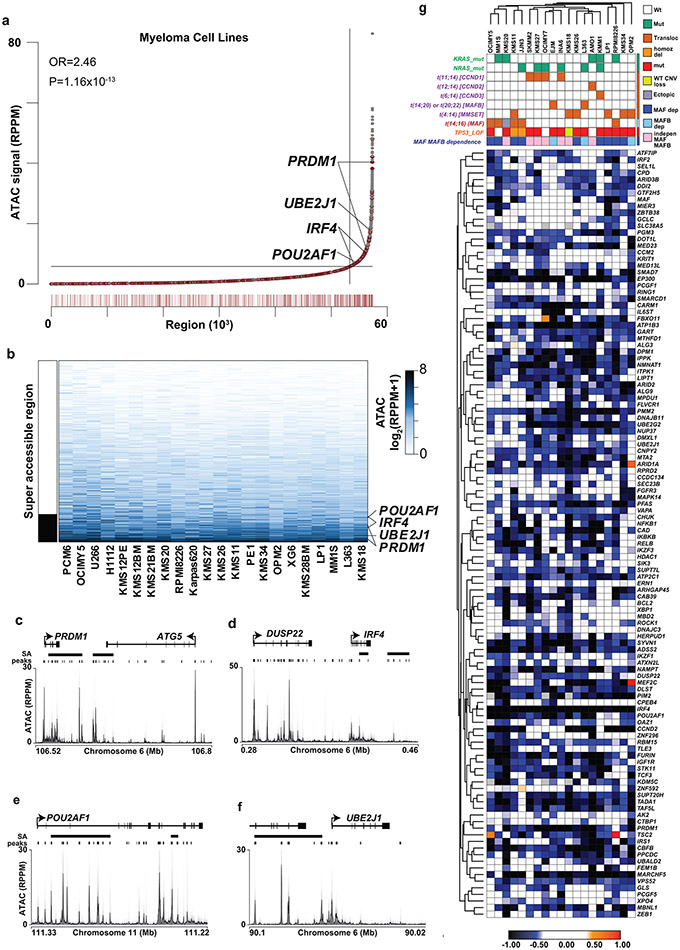
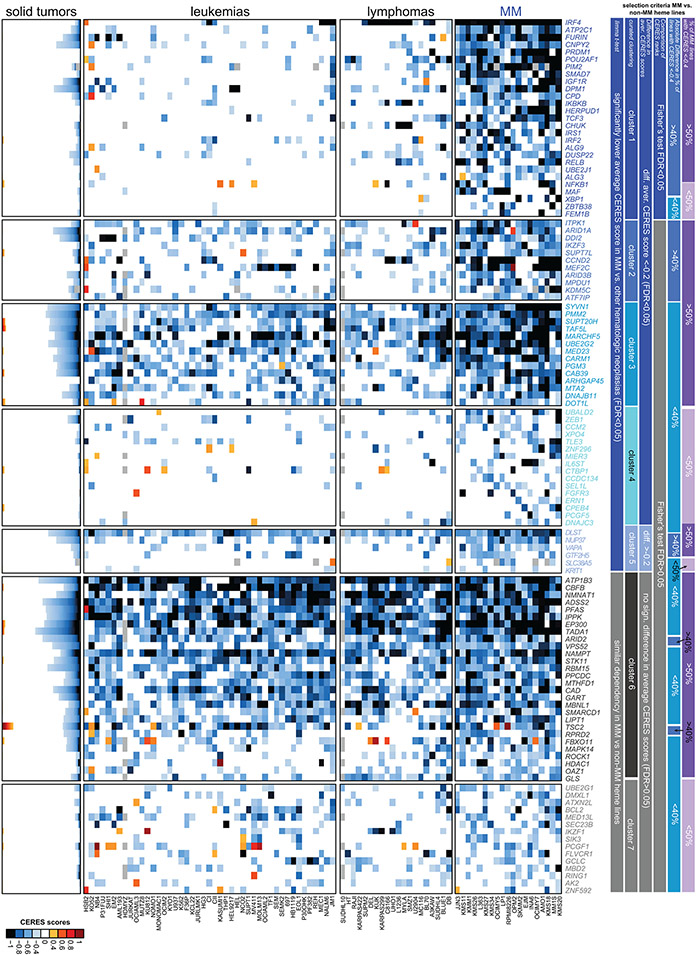
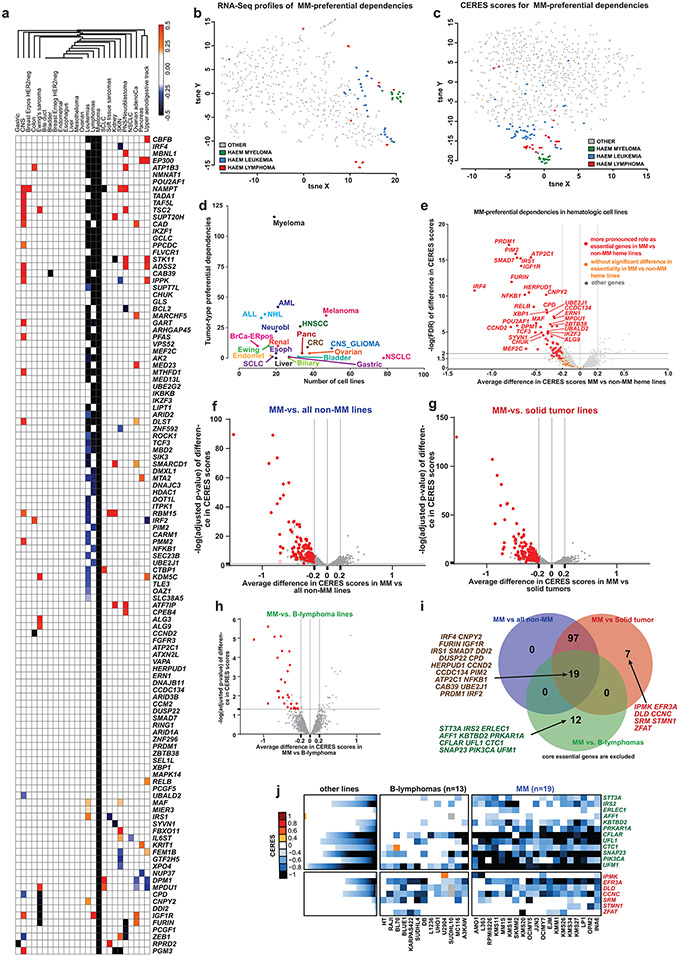
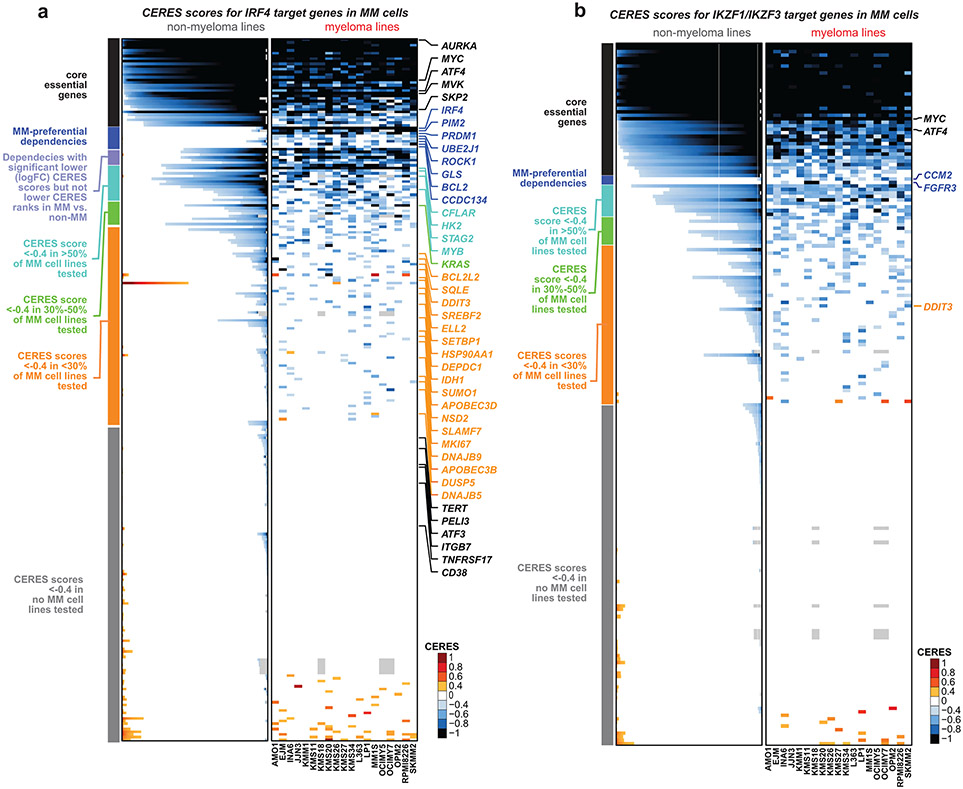
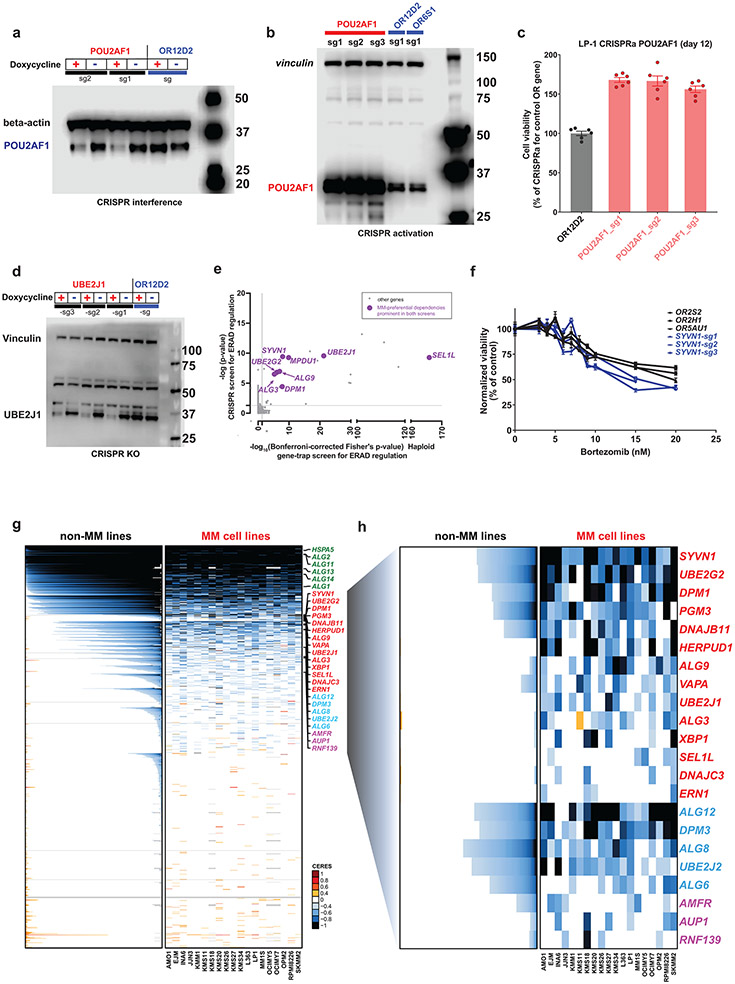
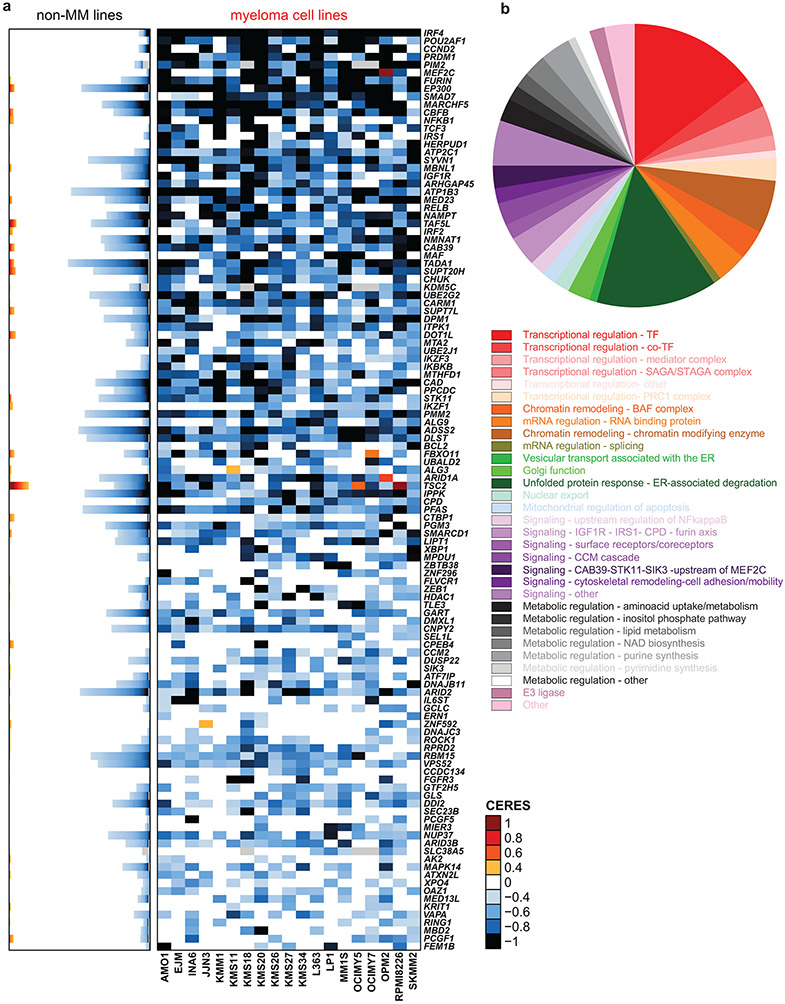
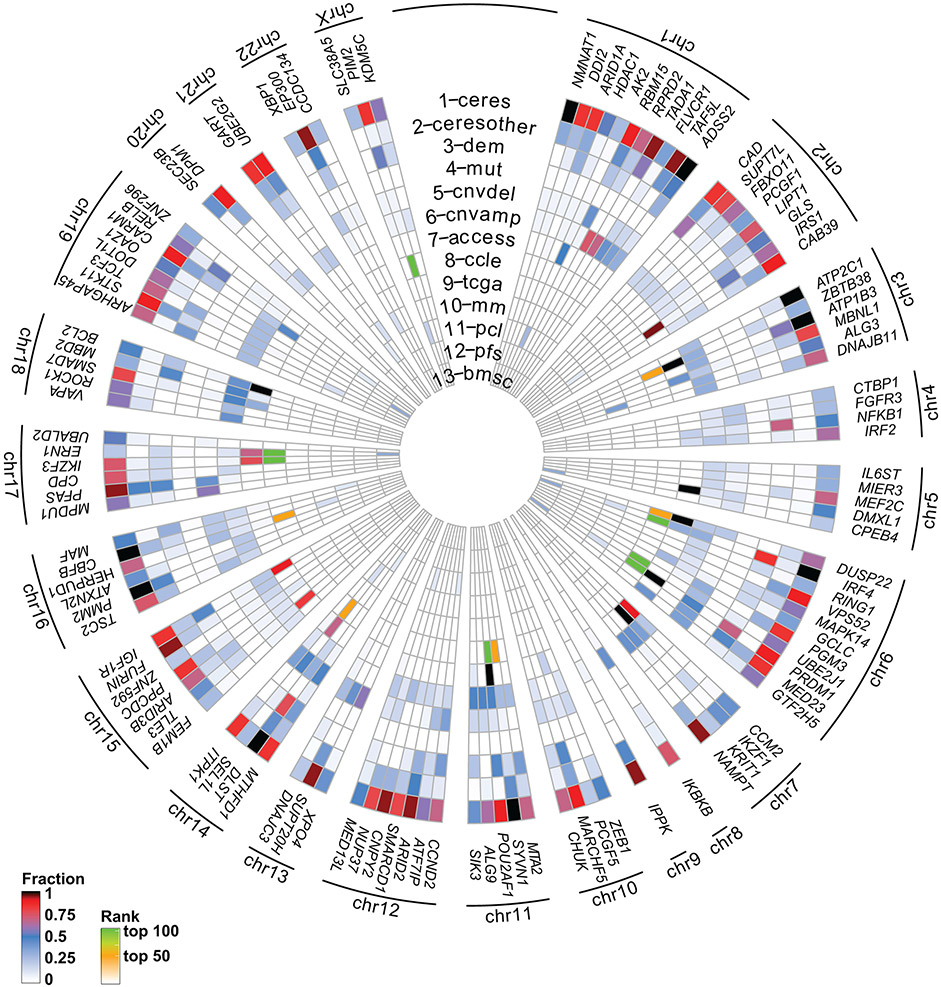
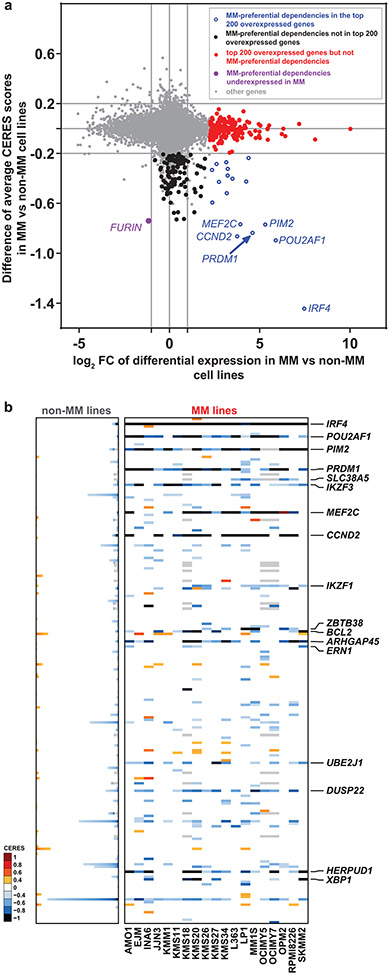
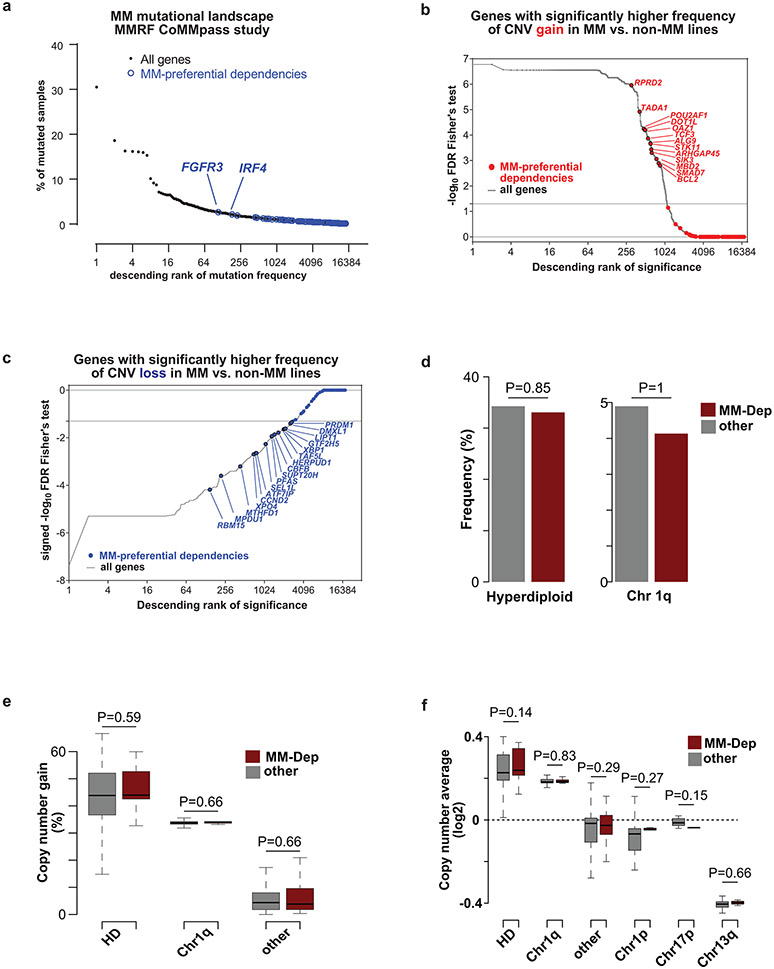
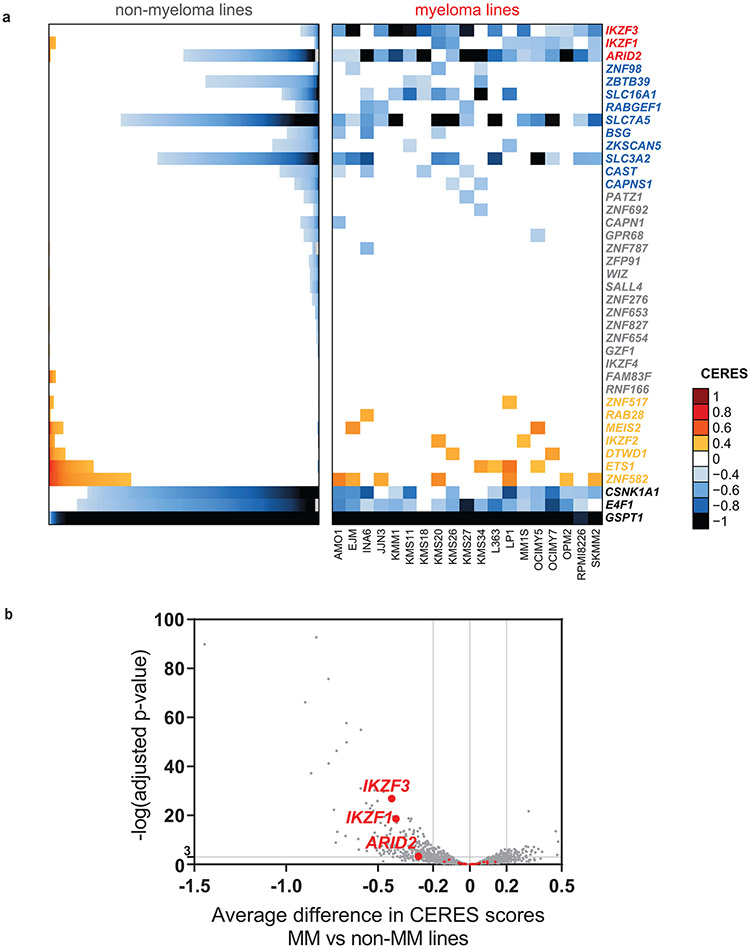
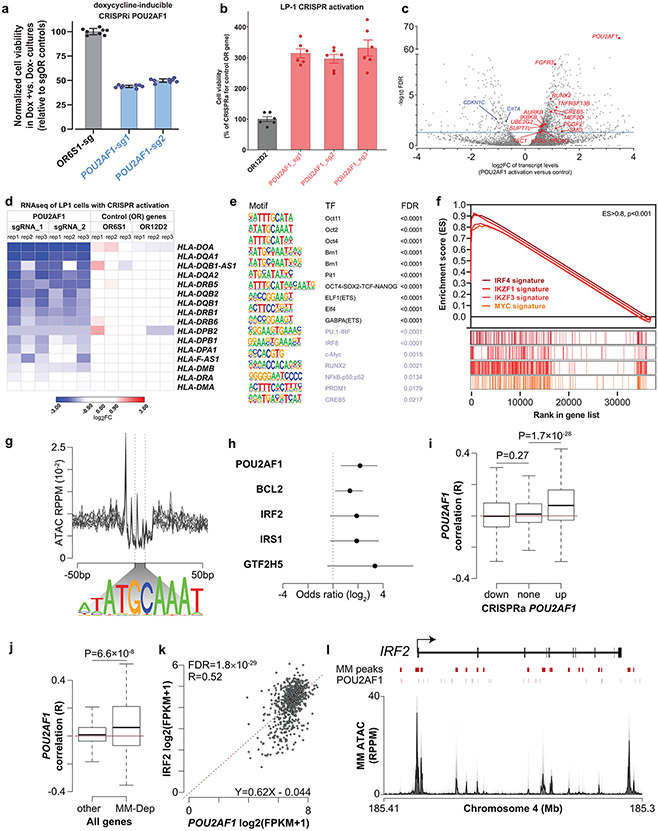
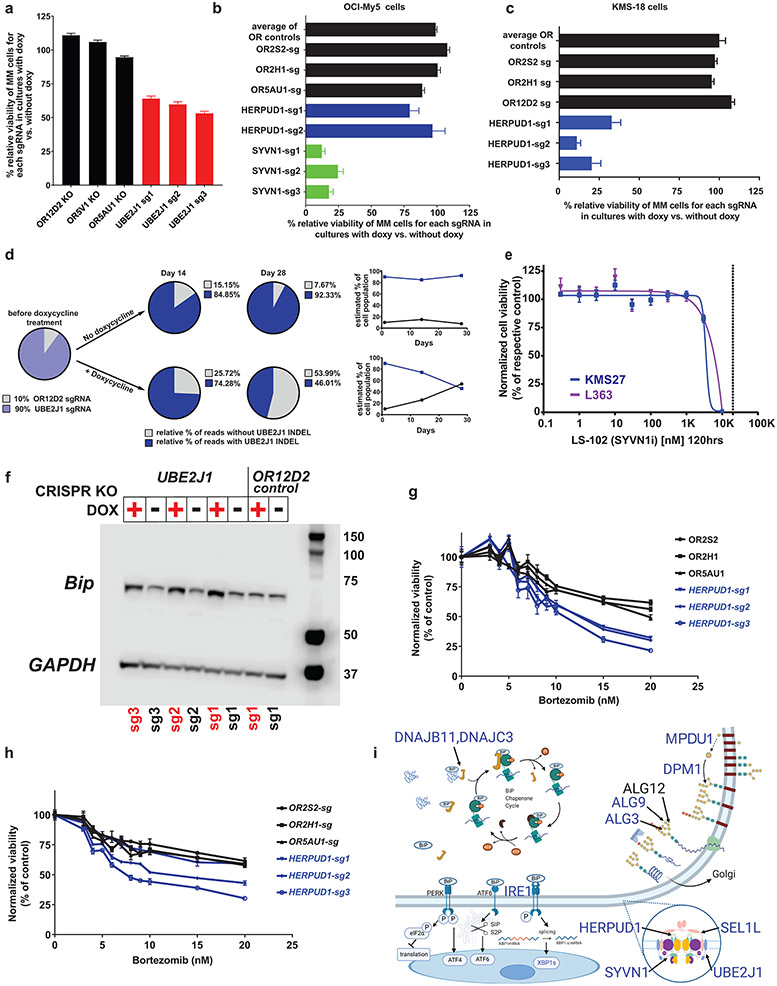
Clinical progress in multiple myeloma (MM), an incurable plasma cell (PC) neoplasia, has been driven by therapies that have limited applications beyond MM/PC neoplasias and do not target specific oncogenic mutations in MM. Instead, these agents target pathways critical for PC biology yet largely dispensable for malignant or normal cells of most other lineages. Here we systematically characterized the lineage-preferential molecular dependencies of MM through genome-scale clustered regularly interspaced short palindromic repeats (CRISPR) studies in 19 MM versus hundreds of non-MM lines and identified 116 genes whose disruption more significantly affects MM cell fitness compared with other malignancies. These genes, some known, others not previously linked to MM, encode transcription factors, chromatin modifiers, endoplasmic reticulum components, metabolic regulators or signaling molecules. Most of these genes are not among the top amplified, overexpressed or mutated in MM. Functional genomics approaches thus define new therapeutic targets in MM not readily identifiable by standard genomic, transcriptional or epigenetic profiling analyses.


Figures

Extended Data Figure 1 ∣
Extended Data Figure 1 ∣. MM-preferential dependencies in genome-scale CRISPR-based gene editing screens
a, Summary matrix of results for identification of MM-preferential dependencies in genome-scale CRISPR-based gene-editing screens from different releases of the Dependency Map program. The criteria used to identify MM preferential dependencies in the 20Q4v2 Dependency Map data were also applied in earlier releases (18Q3 to 20Q3). The matrix summarizes results for all genes that met these criteria in at least one of the releases. Black or white indicate, respectively, that a gene did vs. did not meet criteria for MM preferential dependency in the respective data release (gray signifies that CERES scores were not calculated for a given gene in the data release). b, MM-preferential dependencies clustered according to molecular pathways represented in this group of genes. Color-coded heatmaps for CERES scores following the format of Fig. 1a. Genes are clustered based on their related functional groups, pathways, or biological functions, based on aggregate information from the literature. c-d, Molecular pathways enriched for MM-preferential dependencies. c, Schematic representation of functional groups represented in the MM-preferential dependencies, such as transcription factors/co-factors, other regulators of transcriptional responses and chromatic signaling; kinases serving as upstream regulators of these pathways (e.g., kinases activating NF-κB); or endoplasmic reticulum/Golgi regulators. d, Visualization of the direct (physical) and indirect (functional) associations of the MM-preferential dependencies, based on computational prediction, knowledge transfer between organisms, interactions aggregated from other (primary) databases or other resources integrated and visualized by the online STRING database (https://string-db.org/, v11.0).
Extended Data Figure 2 ∣
Extended Data Figure 2 ∣. Additional metrics of essentiality for MM preferential dependencies.
a-b, Ranks of CERES scores or DNA copy number-uncorrected ranks of sgRNA depletion for MM-preferential dependencies. Essentiality metrics are depicted in color-coded heatmaps similar in format to Fig. 1a, with results presented for MM lines as a matrix (each line in a separate column) while results for non-MM lines are stacked separately for each gene from lowest to highest essentiality (from left to right in each row). For each cell line, the top 3000 genes with the lowest CERES scores (in a) or with most pronounced sgRNA depletion based on MAGeCK rank aggregation (in b) are depicted in green or purple, respectively. For each cell line, the top 100 genes with highest CERES scores (in a) or highest MAGeCK ranks for sgRNA enrichment (in b) are depicted in purple and yellow/orange, respectively, according to the respective color-coded scales. c-d, Patterns of depletion for shRNAs targeting genes defined by CRISPR as MM-preferential dependencies. c, DEMETER2 scores are depicted as a matrix for MM (n=13 cell lines; right) and as separate stacked plots for non-MM (n=461 cell lines; left), according to the color-coded scale (black/ blue for shRNA depletion; yellow/orange/brown for shRNA enrichment; white for DEMETER2 scores between −0.4 and +0.4; and gray for genes not examined in the shRNA screen of the respective cell line). d, DEMETER2 scores for key examples of MM-preferential dependencies are depicted (in rows) for both non-MM (left) and MM lines (right) as stacked bar graphs, according to the color-coded scale.
Extended Data Figure 3 ∣
Extended Data Figure 3 ∣. Patterns of expression of MM-preferential dependencies in MM vs non-MM cell lines.
RNA-Seq data (CCLE dataset) for MM-preferential dependencies in MM vs. non-MM cell lines. Transcript levels (log2(TPM+1)) for each gene (row) across MM and non-MM cell lines are scaled by maximum value resulting in a value range between 0 and 1 and presented as stacked bar plots. Color bars on the side of the graph denote different clusters of genes, defined based on analyses of Fig. 3 (based on 2-sided limma t-test FDR and log2FC of differential expression of each gene in MM vs non-MM lines).
Extended Data Figure 4 ∣
Extended Data Figure 4 ∣. Patterns of transcript levels for MM-preferential dependencies in different biological or clinical contexts.
a, RNA-Seq data for MM-preferential dependencies in patient-derived tumor samples for MM vs. non-MM. Transcript levels (presented as stacked plots) for each gene (row) across MM (n=591 samples; MMRF CoMMpass study, IA8 release) and non-MM (n=11060 samples, TCGA; accessed from GDAC). Raw counts were voom normalized, negative voom values were set to zero, scaled by maximum value for each gene, resulting in a value range between 0 and 1. Concordant observations also obtained with other versions of MMRF and TCGA datasets. b, Comparative analyses of transcript levels for MM-preferential dependencies in different stages of myelomagenesis or settings with distinct differences in clinical or biological aggressiveness of MM. Heatmap summarizes results from comparisons performed between groups of samples within each of the gene expression profiling datasets indicated in the figure. Red and blue denote statistically significant (FDR<0.05, Limma t-test, log2FC > 1.0 or < −1.0) up- or down-regulation, respectively, for a gene in a given group of samples vs. its indicated comparator group. Genes in gray do not have perfect match probes in the respective array. White indicates no statistically significant difference for a given comparison. Number of samples per group is indicated next to each comparison. c-e, Transcript levels of most MM-preferential dependencies do not consistently correlate with adverse clinical outcome. c, Overall survival (OS) or progression free survival (PFS) were examined for MM patients at high vs. intermediate vs. low tertiles of expression of each MM-preferential dependency in each dataset indicated in the graph (see Methods). Red and blue denote statistically significant (at FDR<0.05, two-sided log-rank test) correlation of transcript levels for a given gene with adverse or favorable, respectively, clinical outcome (white indicates FDR>0.05). d-e, Cumulative plots summarizing results of c, in terms of OS (d), or PFS (e), between MM patients with high vs. intermediate vs. low tertile of expression of each gene in each dataset indicated in the graph. For each potential FDR value (x-axis), the y-axis depicts, separately for OS or PFS in each dataset, the cumulative fraction of MM-preferential dependencies exhibiting FDR levels equal or lower to those depicted in each respective position of the x-axis. For all evaluated datasets, <25% of MM-preferential dependencies exhibit FDR<0.05 for the correlation of transcript levels with PFS or OS. Number of patient samples in c-e is indicated for each dataset.
Extended Data Figure 5 ∣
Extended Data Figure 5 ∣. Genomic landscape of MM-preferentially essential genes.
a, Mutational and DNA copy number data for MM-preferential dependencies in MM vs. non-MM cell lines is included in heatmaps of CERES scores (similar to the format of Fig. 1a). Green stars represent non-synonymous mutations; while CNV gains and losses are depicted by “+” or “−”, respectively. In stacked plots for non-MM cell lines, green stars are also stacked and are not linked with the CERES scores in respective lines. b, Rank of genes with most frequent CNV gains in MM patient tumor samples (N = 932 samples; N = 18,057 genes with CERES data (20Q4v2) and CNV data in CoMMpass study, IA15 release): MM-preferential dependencies are highlighted in red and their gene symbols are labeled for those MM-preferential dependencies ranked in the top 200 genes (genes are ranked on the x-axis on a log2 scale). c, Top hotspots for gain of structural variants (SVs) ranked based on their frequency in MM patient tumor samples (CoMMpass study), derived from analyses of Rustad et al. MM-preferential dependencies residing in 8 of these hotspots are highlighted, and those in bold have not been previously proposed as candidate drivers of the respective hotspots. Gray denotes hotspots which contain no genes evaluated in the genome-scale CRISPR screens. d, Heat maps for CERES scores in MM vs. non-MM lines of genes in each of the 8 SV gain hotspots of panel c that contain MM-preferential dependencies.
Extended Data Figure 6 ∣
Extended Data Figure 6 ∣. Overlap or proximity of chromatin accessible regions with MM-preferential dependencies.
a, Plot of stitched regions of chromatin accessibility with average ATAC-seq signal (RPPM) across 22 MM cell lines shown in gray. Black lines denote the inflection point that denotes super-accessible (SA) regions. Regions within 100 kb of MM-preferential dependencies are denoted by red tick marks on the bottom and the odds ratio (OR) and P-value (two-sided Fisher’s exact test) of enrichment of MM-preferential dependencies found near super-accessible regions are shown. b, Heatmap of chromatin accessible regions within 100 kb of MM-preferential dependencies across 22 MM cell lines. c-f, Genomic plots of ATAC-seq for select examples of MM-dependencies (PRDM1, IRF4, POU2AF1, UBE2J1) that overlap with super-accessible (SA) regions. Each cell line is shown in a transparent gray and the average is shown in black. Note the proximity of IRF4 and DUSP22 and the multiple prominent areas of accessible chromatin within intronic regions of DUSP22. g, Hierarchical clustering of MM cell lines based on their CERES scores for MM preferential dependencies. MM cell lines are annotated for their status for genomic events, such as translocations targeting CCND1, CCND2, CCND3, MAF, MAFB, MMSET/NSD2, mutations for KRAS or NRAS, loss-of-function for TP53; or the functional status of their dependence (based in CRISPR data) on either MAF or MAFB.
Extended Data Figure 7 ∣
Extended Data Figure 7 ∣. Comparative analysis of CERES scores for MM preferential dependencies in MM vs other hematologic malignancies vs. solid tumors.
Results are presented in a manner similar to Fig. 1, with stacked bar plots for solid tumors (left); separate matrices for cell lines from non-MM hematologic malignancies (middle) vs. MM (right). Genes are included in 7 different clusters determined based on the criteria included in the color-coded bars on the right-hand side of the graph (FDR of comparison of CERES scores and difference in average CERES scores in MM vs. non-MM hematologic cell lines; Fisher’s test FDR for comparison of CERES ranks; absolute difference in % of MM vs. non-MM hematologic cell lines with CERES scores ≤ −0.4; and % of MM lines with CERES score ≤ −0.4). Results highlight that several MM-preferential dependencies are shared between MM and other hematologic malignancies, but many others are preferentially essential only for MM cell lines, a statement also supported by results of Extended Data Fig. 8.
Extended Data Figure 8 ∣
Extended Data Figure 8 ∣. MM-preferential dependencies with distinct vs. overlapping roles in MM vs. other hematologic neoplasias or solid tumors.
a, Heat map for MM-preferential dependencies, summarizing their potential roles as preferential dependencies for other malignancies. Color coding indicates the difference in average CERES score for each gene in a given tumor type vs. all others: black/blue or red/orange denote FDR<0.05 and lower or higher, respectively, average CERES scores for a given gene in the respective neoplasia vs. all other cancer types. White denotes FDR>0.05. b-c, t-SNE plots of cell lines (depicted as dots), from MM, leukemias, lymphomas or other neoplasias, clustered according to RNA-Seq profiles b, or CERES scores c, for MM-preferential dependencies. RPKM data in b from CCLE [2018] for lines with matching 20Q4v2 CERES scores (N=15, 33, 16, 505 lines, respectively). In c, N=19, 44, 20, 706 lines, respectively (20Q4v2). d, Numbers of CRISPR-defined preferential dependencies (y-axis; identified based on the same criteria applied for MM) vs. number of lines for each indicated tumor type (x-axis). e, Volcano plot of -log10FDR (Limma t-test) for comparison of CERES scores in MM vs non-MM hematopoietic cell lines (y-axis) vs. difference in average CERES scores in MM vs. non-MM cell hematopoietic lines (x-axis). MM-preferential dependencies (identified in this study by comparison of MM vs. all non-MM cell lines) are depicted in red and orange, respectively, if they did vs. did not exhibit significantly lower CERES scores in MM compared with non-MM hematopoietic lines. f-h, Dependencies with differential role in MM vs. solid tumors or vs. B-cell lymphomas. Volcano plots for comparisons of CERES scores in MM lines (N=19) vs. f, all non-MM cell lines, from both hematologic malignancies and solid tumors (N=768; also see Supplementary Table 1); g, only solid tumor cell lines (N=701); h, B cell lymphoma lines (N=13) (x-axis: difference in average CERES scores between respective groups; y-axis: -log10FDR, Limma t-test). Red dots in each plot indicate genes satisfying criteria for more pronounced essentiality in MM compared with the respective groups of cell lines; i, Venn diagram highlighting genes with differential role in MM vs. solid tumors or B-cell lymphomas, based on panels f-h. j, CERES scores for genes that do not meet criteria for MM-preferential dependencies (comparison of MM vs. all other non-MM lines), but are more essential in MM vs. solid tumors or B-cell lymphomas, based on panels f-h.
Extended Data Figure 9 ∣
Extended Data Figure 9 ∣. Pattern of essentiality for genes downstream of IRF4 or IKZF1/IKZF3.
CERES scores for genes previously defined as a, IRF4 target genes in MM cells or b, genes that are downregulated by loss-of-function of IKZF1 or IKZF3 (GSE113031) are depicted in a heatmap format (similar to Fig. 1) and in clusters of genes which (i) can be considered “core essential” genes (e.g., CERES <−0.4 in ≥90% of cell lines across cancers); (ii) meet all criteria for MM-preferential dependencies vs. other genes that have CERES scores <−0.4 in (iii) >50% of MM cell lines tested, (iv) 30-50% of MM cell lines tested; (v) <30% of MM cell lines tested; or (vi) none of the MM cell lines tested.
Extended Data Figure 10 ∣
Extended Data Figure 10 ∣. Molecular and functional studies of POU2AF1 and ER-associated dependencies.
a-b, Immunoblotting analyses to confirm that protein levels of POU2AF1 are decreased with Doxy-inducible CRISPR interference (a, KMS11 cells) and increased with CRISPR activation (b, LP-1 cells) compared to cells with sgRNAs for control OR genes. Beta-actin a, or vinculin b, were probed as loading controls in the same respective membrane concurrently with POU2AF1. c, Relative numbers of viable LP-1 cells with CRISPR-based activation of POU2AF1 vs. a control OR gene (day 12 after end of transduction with sgRNAs for POU2AF1; results qualitatively concordant with those at later time-point in Fig. 6b). CTG assay, mean +/− SEM results; n=6 independent replicate cell cultures per condition; one-way ANOVA and Tukey’s post-hoc test (detailed results included in Source Data), p<0.001 for each POU2AF1 sgRNA vs. OR12D2 sgRNA). d, Immunoblotting for UBE2J1 after doxy-inducible CRISPR-based KO of UBE2J1 (or a control OR gene). Vinculin was probed as loading control concurrently with the staining for UBE2J1. Each experiment in a-d was performed once. e, UBE2J1, its dislocon complex partners SEL1L, SYVN1, and other ER-related MM preferential dependencies are among the top “hits” in two genome-scale screens (using retroviral gene-trap mutagenesis and CRISPR gene-editing) for genes involved in ERAD regulation (in KBM7 haploid cells). f, In vitro bortezomib treatment (24 h) of KMS18 cells with Doxy-inducible CRISPR KO of SYVN1 or control OR genes. (CTG; mean +/− SEM; n=8 independent replicate cell cultures for drug-free control and n=4 independent replicate cell cultures per drug dose for each KO; 2-way analyses of variance (p<0.001); detailed results of Tukey post-hoc tests included in Source Data). g-h, Patterns of CERES scores in MM (n=19) and non-MM (n=770) lines for g, ER/ERAD/Golgi-related genes and h, select ER genes. Results are presented similar to format of Fig. 1. Highlighted gene symbols include MM-preferential dependencies (red); examples of core essential genes (green); and genes which do not meet all criteria for MM-preferential dependencies but are recurrently essential for MM cell lines and are linked with the function of the ER glycoprotein quality control system (blue) and the ER translocon system (purple).
Figure 1 ∣
Figure 1 ∣. Myeloma–preferential dependencies identified by genome-scale CRISPR-based gene-editing screens.
a, Color-coded heatmaps depict CERES scores, as a quantitative metric of dependence of human tumor cell lines to each gene in CRISPR/Cas9 gene-editing screens (AVANA sgRNA library). CERES scores for MM lines (n=19) are depicted as a matrix (right side of graph) of cell lines (in columns) and genes (in rows). For non-MM lines (n=770), data are depicted for each gene (row) in stacked bar graphs, which visualize the CERES score of each gene in descending order (from left to right). Black or dark blue signifies negative CERES scores compatible with pronounced sgRNA depletion of a given gene for a specific cell line. MM-preferential dependencies were identified based on average CERES scores in MM cell lines ≤−0.2; difference in average CERES scores in MM vs. non-MM lines ≤−0.2; two-sided limma t-test with adjusted p-value (FDR) <0.05 for comparison of CERES scores; and additional criteria outlined in Methods. b, Pie chart of the distribution of MM-preferential dependencies to different functional groups, pathways, or biological functions.
Figure 2 ∣
Figure 2 ∣. Integrated molecular profiling analyses for MM-preferential dependencies.
CIRCOS plot summarizing results of integrated molecular analyses for MM-preferential dependencies (more details in Figs. 3, 4 and Extended Data Fig. 3-6) to examine whether most of them are among the top genes with most frequent molecular alterations (for example, mutations, DNA copy number gains or differential expression) in MM cells. Concentric circles depict for each gene: (1-2) fraction of MM (1; “ceres”) or non-MM (2; “ceresother”) lines with CERES scores ≤−0.4; (3) fraction of MM lines with DEMETER scores ≤−0.4 (“dem”); (4-6) fraction of MM cell lines with non-synonymous mutations (4; “mut”; see Extended Data Fig. 5), CNV loss (5; “cnvdel”) or CNV gain (6; “cnvamp”) (see Extended Data Fig. 5); (7) fraction of MM cell lines with a super-accessible chromatin region annotated by closest proximity to the gene of interest (“access”). Circles 8-12 summarize whether expression of a gene is higher in (8) MM vs. non-MM cell lines of CCLE (“ccle”; see Fig. 3 and Extended Data Fig. 3); (9) tumor samples from patients with MM (CoMMpass study) vs. non-MM patients (TCGA) (“tcga”; see Extended Data Fig. 4a); (10) MM patient samples vs. normal PCs (“mm”; see Extended Data Fig. 4b); (11) PCL (or advanced MM) vs. early/newly diagnosed MM (“pcl”; see Extended Fig. 4b); (12) patients with shorter PFS (“pfs”; see Extended Data Fig. 4c); and (13) when MM cells are co-cultured with bone marrow stromal cells (BMSCs) (“bmsc”) in dataset GSE20540. For circles 8 and 9, transcripts with log2FC>1.0 and FDR <0.05 are in green or orange, if they rank (based on FDR), respectively, in the top 1-50 or 51-100 most upregulated genes (white depicts genes that did not satisfy all these criteria). Each of the circles 10-13 integrates several individual comparisons (see Methods) and depicts (based on the color-coded scale) the fraction of these comparisons with upregulation by log2FC ≥1.0 and FDR ≤0.05 and ranking (based on FDR) in the top 100 most upregulated genes.
Figure 3 ∣
Figure 3 ∣. Most MM-preferential dependencies do not rank among the top overexpressed genes in MM vs non-MM cell lines.
a, Scatter plot depicting for each gene the log2FC of differential expression in MM (n=25) vs. non-MM (n=991) cell lines in CCLE (x-axis) vs. average differences in CERES score (y-axis, see Supplementary Table 1) in MM vs non-MM lines in CRISPR gene editing screens (N = 17,436 genes with matching gene symbols between CCLE and CERES data). The plot highlights genes that are (i) preferentially essential and in the top N = 200 overexpressed genes (log2FC>1.0, two-sided limma t-test, FDR<0.05, ranking based on log2FC) in MM (blue circles); (ii) the top N = 200 overexpressed genes that are not preferentially essential in MM (red dots); (iii) a MM-preferential dependency that is under-expressed (log2FC<−1.0, FDR<0.05) in MM vs. non-MM cell lines in CCLE (purple dot); (iv) other MM preferential-dependencies that are not in the top N = 200 overexpressed genes (black dots) and (v) other genes (gray dots). b, Heat-maps for MM (N = 19 cell lines) (right; matrix) and non-MM (N = 770 cell lines) (left; stacked bars) depict CERES scores of the top N = 200 most upregulated genes in MM vs. non-MM cell lines (CCLE) for which both transcript and CERES data are available (significantly upregulated genes were ranked according to log2FC of differential expression, distinctly from the FDR-based ranking of differentially expressed genes for Fig. 2). Gene symbols are depicted for the minority of top upregulated genes that represent MM-preferential dependencies. Gene expression data for a, was accessed from the initial CCLE portal, with concordant observations based on subsequent releases of these data through DepMap portal.
Figure 4 ∣
Figure 4 ∣. Landscape of single nucleotide variants and DNA copy number variants for MM-preferentially essential genes.
a, Frequency of non-synonymous single nucleotide variants (SNVs) in N=940 samples from MM patients (CoMMpass study, IA17 release). MM-preferential dependencies (as defined in Fig. 1a, Supplementary Table 1) are highlighted in blue. b,c, Ranking of MM-preferential dependencies and other genes in terms of statistical significance (FDR, two-sided Fisher’s test) of the frequency of CNV gains (b) or losses (c) in MM (n=33) vs. non-MM (n=1721) lines of CCLE panel (based on data and annotation from DepMap 22Q1 release, concordant observations with other releases). d, Frequency of MM-preferential dependencies (MM-dep; red) and other (gray) genes that fall in sites of common CNV gains, including hyperdiploid (HD) chromosomes (e.g., 3, 5, 7, 9, 11, 15, 19, 21) in MM. e, Frequency of CNV gains in CoMMpass samples for MM-preferential dependencies and all other genes stratified by hyperdiploid (HD) chromosomes, chromosome 1q, and other. f, Average DNA copy number in CoMMpass samples for MM preferential dependencies vs. other genes stratified by HD, chromosome 1q, other, chromosome 1p, chromosome 17p and chromosome 13q. P-values are from two-sided Fisher’s exact test (d) or two-sided Mann-Whitney U-test (e-f). Panels e-f evaluated N=932 patient samples for 19054 genes with DNA copy number data available in the CoMMpass study (IA15 release).
Fig. 5 ∣
Fig. 5 ∣. CERES scores for reported substrates or targets for thalidomide derivatives.
a, Heatmaps depict CERES scores for known/proposed substrates or targets of thalidomide derivatives. Results as depicted as a matrix for N=19 MM cell lines (right side of graph) and stacked bar plots for N=770 non-MM cell lines (with format and color-coding similar to other figures, e.g., Fig. 1a). Gene symbols (for N=39 genes) are highlighted in red for MM-preferential dependencies whose protein products are known (IKZF1, IKZF3) or recently proposed (ARID2) neo-substrates for thalidomide derivatives; black for “core essential” genes; blue for genes that are not “core essential” or MM-preferentially essential and have CERES scores <−0.4 in ≥2 MM lines tested; and gray or orange for other known or reported CRBN neo-substrates / targets of thalidomide derivatives. b, Dot plot depicting for each gene the −log10FDR (Limma t-test) for comparison of CERES scores in MM (N =19 cell lines) vs non-MM (N = 768 cell lines) (y-axis) vs. the difference in average CERES scores in MM vs. non-MM cell lines (x-axis) (N=18,119 genes, also see Supplementary Table 1). Genes whose protein products are known or proposed targets/neosubstrates of thalidomide or its derivatives are highlighted in red dots and those genes (IKZF3, IKZF1 and ARID2) that also meet the criteria for MM-preferential dependencies are highlighted by their symbols.
Fig. 6: ∣
Fig. 6: ∣. Biological role of POU2AF1 in MM cells.
a,b, Relative number of viable cells after Doxy-inducible CRISPR interference (CRISPRi) (KMS-11 cells, 11 days after sgRNA transduction) (a) or CRISPR activation (CRISPRa) (LP-1 cells, 19 days after sgRNA transduction) (b) of POU2AF1 vs. control OR genes. CTG assays, N = 8 (a) or N = 6 (b) independent replicate cell cultures per condition; mean±SEM, one-way analysis of variance (ANOVA) and Tukey’s post-hoc test (detailed results in source data), P < 0.001 for each POU2AF1 sgRNA vs. OR gene sgRNA). c–f, Transcriptional signature of POU2AF1 overexpression in LP1 MM cells: volcano plot of transcripts differentially expressed in LP1 cells with CRISPR activation of POU2AF1 vs. OR controls (blue line denotes FDR = 0.05) (c); HLA class II transcript levels with POU2AF1 activation vs. control (d); TF DNA-binding motifs enriched in sites of chromatin binding of POU2AF1, where top ten most statistically significant motifs (in black) include POU2AF1 partner Oct2 (POU2F2), whereas others include motifs for TFs relevant to MM, such as Myc, PU.1-IRF, NF-κB, PRDM1 and CREB5, which is overexpressed with POU2AF1 activation (e); GSEA plots examining the transcriptional signature of POU2AF1 activation identify enrichment for genes previously determined as targets of IRF4, IKZF3, IKZF1 or Myc (P < 0.001, for each plot) (f). g–l, POU2AF1 binding motifs are enriched in chromatin accessible regions near select MM-preferential dependencies: ATAC-seq signal at POU2AF1 binding motifs in 12 MM DepMap cell lines (top), with the POU2AF1 consensus binding motif shown (bottom) (g); MM-preferential dependencies with significant enrichment of POU2AF1 binding motifs in chromatin accessible regions (odds ratio of enrichment lines denoting 95% confidence intervals shown, Fisher’s exact test) (h); correlation of transcript levels in N = 768 newly diagnosed primary MM specimens (CoMMpass study, IA15 release) for POU2AF1 expression with genes downregulated (down), not significantly changed (none) or upregulated (up) by CRISPR activation of POU2AF1 (i); correlation of POU2AF1 expression with transcript levels of MM-preferential dependencies (MM-Dep; N = 116 genes) or all other N = 55,092 genes (two-sided t-test for i and j; box plots denote median, lower/upper quartiles, with whiskers extending up to 1.5 times the interquartile range of the box) (j); gene expression correlation between POU2AF1 (x axis) and IRF2 (y axis) in N = 768 patient samples (CoMMpass study IA15 release), with significance determined by edgeR and FDR corrected), and gene expression measured in fragments per kilobase per million reads (FPKM) (k); genome plot of IRF2 showing MM chromatin accessible regions (MM peaks), POU2AF1 consensus binding motifs (POU2AF1) with motifs overlapping accessible chromatin (red), and a composite ATAC profile of 12 MM lines (l).
Figure 7: ∣
Figure 7: ∣. Biological role of UBE2J1 and other ER-associated MM-preferential dependencies.
a–d, Doxy-inducible CRISPR KO of ER-associated MM preferential dependencies or control OR genes in KMS-18 (a, c and d) or OCI-My5 (b) MM cells. Cells were cultured with or without Doxy (14 days in a–c; 14 or 28 days in d). In a–c, cell viability was evaluated by CTG (mean ± SEM), one-way ANOVA and Tukey’s post-hoc tests (see source data) at P < 0.001 for each ER gene sgRNA (except HERPUD1 in b) vs. each of the OR sgRNAs; 80, 32 and 40 independent replicate cell cultures/sgRNA in a–c, respectively. In d, KMS18 cells with Doxy-inducible SpCas9 and transduced with sgRNA against UBE2J1 or OR2D12 were mixed at a 9:1 ratio, respectively, in a competition assay. INDEL analyses (at days 14 and 28) calculated the relative percentage of cells with CRISPR-induced frameshift mutations of UBE2J1. e, In vitro treatment with SYVN1 inhibitor LS-102 (5 days; vertical dotted line represents reported in vitro half maximal inhibitory concentration (IC50) for inhibition of this target). CTG; mean; biological replicates N = 30 independent replicate cell cultures for drug-free controls in both lines, n = 3 or 4 independent replicate cell cultures, respectively, in L363 and KMS27 MM cells for each drug dose; nonlinear curve fitting with variable slope (four parameters). f, Immunobloting for BiP, a marker of ER stress, in KMS18 cells with Doxy-inducible CRISPR KO of UBE2J1 or control OR gene, cultured with versus without Doxy. g,h, In vitro bortezomib treatment (24 h) of KMS18 (g) or OPM-2 (h) cells with Doxy-inducible CRISPR KO of HERPUD1 or control OR genes. (CTG; mean ± SEM; n = 8 independent replicate cell cultures for drug-free controls and n = 4 independent replicate cell cultures per drug dose for each KO; two-way ANOVA (P < 0.001); detailed results of Tukey posthoc tests in source data). i, Schematic figure of ER-associated dependencies. MM-preferential ER dependencies (blue symbols) involve ER membrane protein complexes mediating dislocation of misfolded ER proteins to cytosol (e.g. HERPUD1, SEL1L) and associated ER-specific E2/E3 enzymes (SYVN1, UBE2J1, UBE2G2); enzymes (e.g. DPM1, ALG3, ALG9) required for N-glycan-dependent surveillance of quality control for luminal ER glycoproteins; chaperones (e.g. DNAJB11, DNAJBC3) for BiP complexes with misfolded proteins; and the known ER stress-sensor IRE1a (ERN1) and its downstream transcription factor XBP1.
Figure 8 ∣
Figure 8 ∣. In vivo studies to validate the role of key examples of MM-preferential dependencies identified in vitro.
a, Results from study of KMS11 cells in the “humanized” BM-like scaffold-based in vivo model using a single-gene CRISPR KO system. The graph depicts, for each gene N=88 MM-preferential dependencies with in vitro CERES scores of <0.4 in KMS11 cells), the log2FC of averaged read counts for each of their sgRNAs (blue dots for individual values; red bar for average). The region highlighted in gray delineates the upper and lower limit of the 95% CIs for log2FC of averaged read counts for sgRNAs of OR genes as controls. Genes for which their sgRNA log2fold change are outside the 95% CIs for the OR gene sgRNAs were considered to have depletion or enrichment. Gene symbols for MM-preferential dependencies with CERES scores <−0.4 in KMS11 in vitro are indicated in dark blue vs. light blue if these genes did vs. did not exhibit, respectively, depletion of 3-4 out of 4 sgRNAs per gene in vivo. MM-preferential dependencies with CERES scores >−0.4 in KMS11 in vitro are indicated in dark green vs. light green, if these genes did vs. did not exhibit, respectively, depletion of 3-4 sgRNAs per gene in vivo. b, Average log2FC of read counts for sgRNAs of N=184 genes (4 sgRNAs/gene) in KMS11 cells in the in vivo humanized BM-like scaffold-based model (N=5 mice) (y-axis) and their respective CERES score in KMS11 cell line in vitro (x-axis). c, Scatterplot of average log2FC of read counts for sgRNAs of genes examined through sub-genome scale focused CRISPR KO study of the KMS11 cells (N=5 mice) (y-axis) vs. XG-7 cells (N=8 mice) (x-axis) in the in vivo humanized BM-like scaffold-based model.

References

    1. Boise LH, Kaufman JL, Bahlis NJ, Lonial S & Lee KP The Tao of myeloma. Blood 124, 1873–9 (2014). - PMC - PubMed
    1. Barwick BG, Gupta VA, Vertino PM & Boise LH Cell of Origin and Genetic Alterations in the Pathogenesis of Multiple Myeloma. Front Immunol 10, 1121 (2019). - PMC - PubMed
    1. Andrulis M. et al. Targeting the BRAF V600E mutation in multiple myeloma. Cancer Discov 3, 862–9 (2013). - PubMed
    1. Tsherniak A. et al. Defining a Cancer Dependency Map. Cell 170, 564–576 e16 (2017). - PMC - PubMed
    1. Shaffer AL et al. IRF4 addiction in multiple myeloma. Nature 454, 226–31 (2008). - PMC - PubMed

Methods-Only References

    1. Meyers RM et al. Computational correction of copy number effect improves specificity of CRISPR-Cas9 essentiality screens in cancer cells. Nat Genet 49, 1779–1784 (2017). - PMC - PubMed
    1. McFarland JM et al. Improved estimation of cancer dependencies from large-scale RNAi screens using model-based normalization and data integration. Nat Commun 9, 4610 (2018). - PMC - PubMed
    1. Dempster JM et al. Extracting Biological Insights from the Project Achilles Genome-Scale CRISPR Screens in Cancer Cell Lines. bioRxiv, 720243 (2019).
    1. Cowley GS et al. Parallel genome-scale loss of function screens in 216 cancer cell lines for the identification of context-specific genetic dependencies. Sci Data 1, 140035 (2014). - PMC - PubMed
    1. Li W. et al. MAGeCK enables robust identification of essential genes from genome-scale CRISPR/Cas9 knockout screens. Genome Biol 15, 554 (2014). - PMC - PubMed

Publication types