. 2023 May 26;6(1):551.
doi: 10.1038/s42003-023-04925-9.

Fission yeast Srr1 and Skb1 promote isochromosome formation at the centromere

Affiliations

Fission yeast Srr1 and Skb1 promote isochromosome formation at the centromere

Piyusha Mongia et al. Commun Biol. .

Abstract

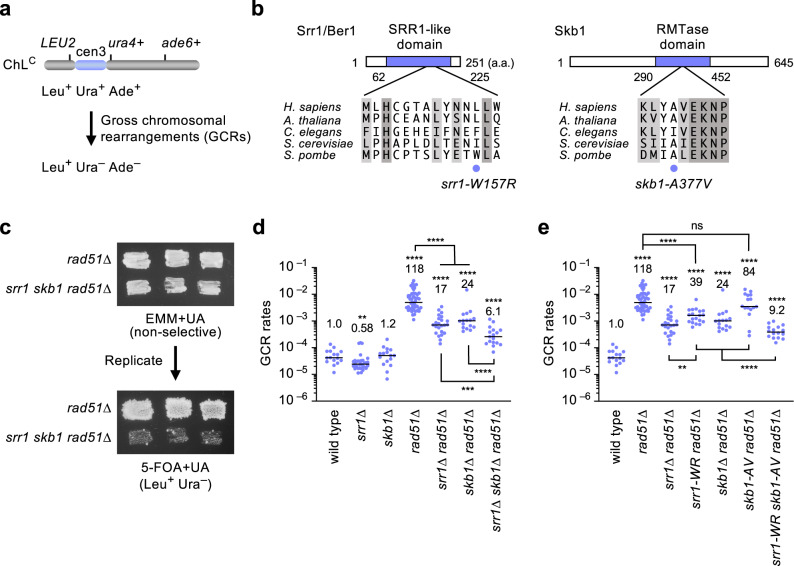
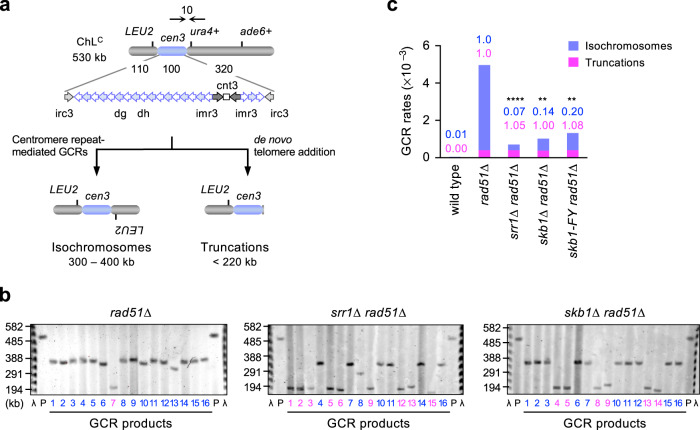
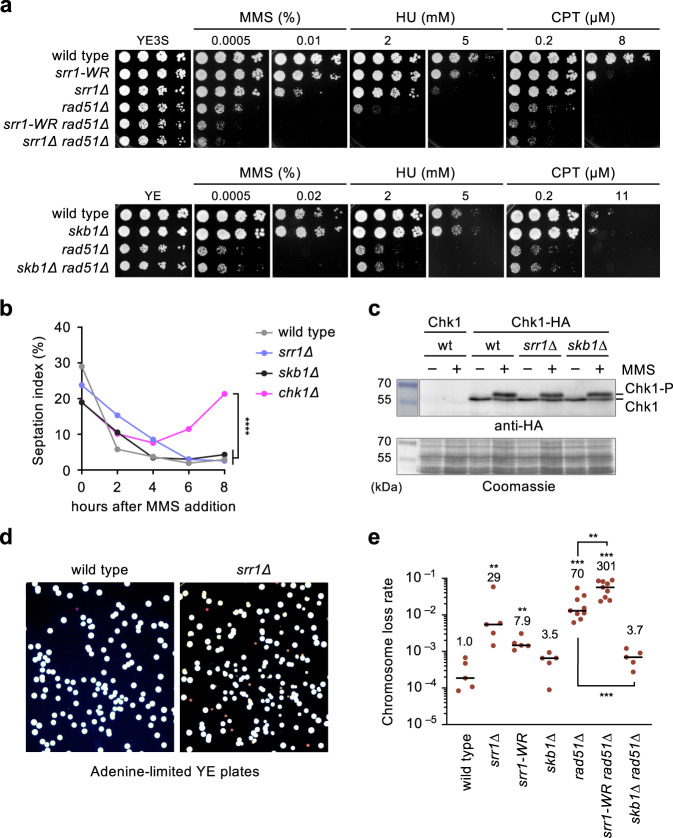
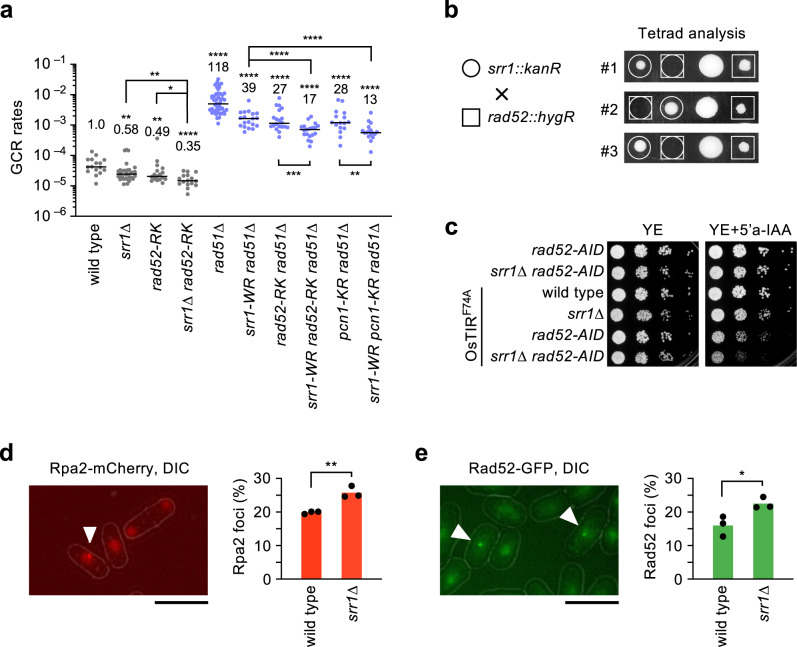
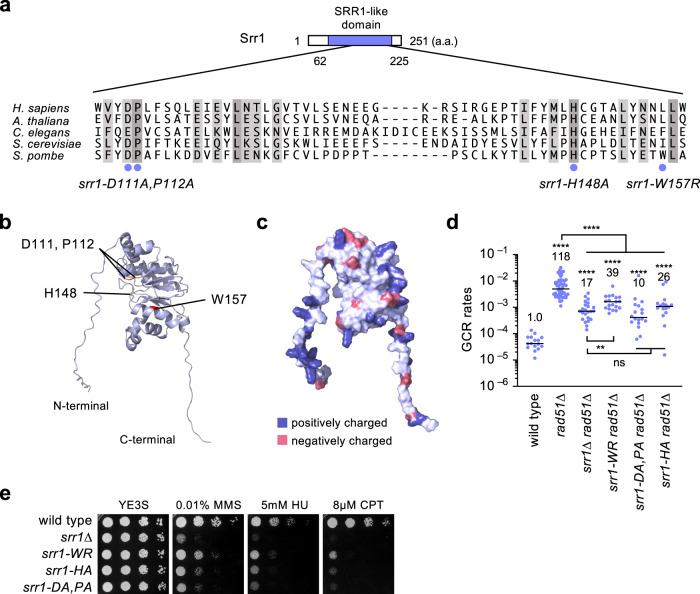
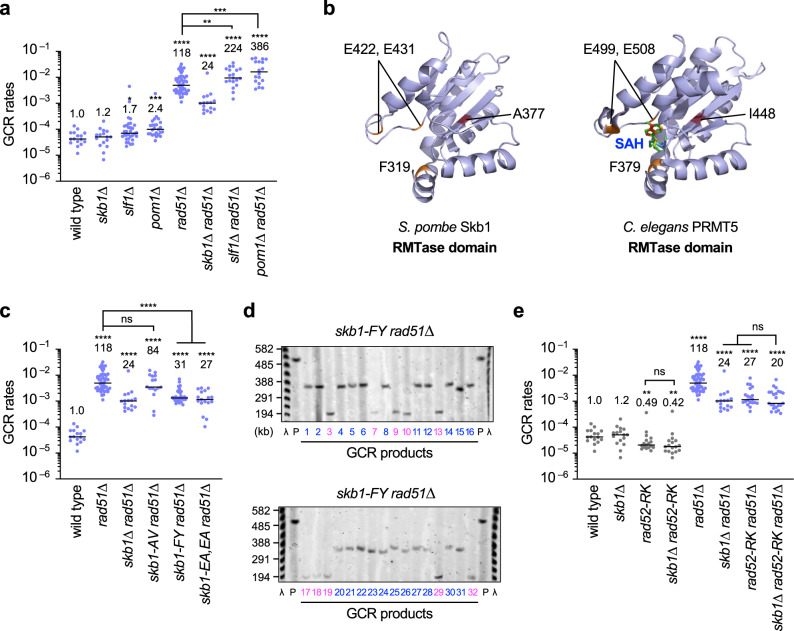
Rad51 maintains genome integrity, whereas Rad52 causes non-canonical homologous recombination leading to gross chromosomal rearrangements (GCRs). Here we find that fission yeast Srr1/Ber1 and Skb1/PRMT5 promote GCRs at centromeres. Genetic and physical analyses show that srr1 and skb1 mutations reduce isochromosome formation mediated by centromere inverted repeats. srr1 increases DNA damage sensitivity in rad51 cells but does not abolish checkpoint response, suggesting that Srr1 promotes Rad51-independent DNA repair. srr1 and rad52 additively, while skb1 and rad52 epistatically reduce GCRs. Unlike srr1 or rad52, skb1 does not increase damage sensitivity. Skb1 regulates cell morphology and cell cycle with Slf1 and Pom1, respectively, but neither Slf1 nor Pom1 causes GCRs. Mutating conserved residues in the arginine methyltransferase domain of Skb1 greatly reduces GCRs. These results suggest that, through arginine methylation, Skb1 forms aberrant DNA structures leading to Rad52-dependent GCRs. This study has uncovered roles for Srr1 and Skb1 in GCRs at centromeres.


Conflict of interest statement

The authors declare no competing interests.

Figures

Fig. 1
Fig. 1. Srr1 and Skb1 promote GCRs in fission yeast.
a Depicted is an extra-chromosome ChLC used to detect GCRs in this study. GCRs resulting in Leu+ Ura Ade from Leu+ Ura+ Ade+ were detected. b Srr1/Ber1 and Skb1 proteins contain the SRR1-like domain and the arginine methyltransferase (RMTase) domain, respectively. Aligned are the amino acid sequences around the srr1-W157R and skb1-A377V mutations (blue circles) in different species. Similar and identical residues among the different species are highlighted in pale and dark gray, respectively. c The parental rad51∆ strain and the clone additionally containing srr1-W157R and skb1-A377V mutations (TNF5411 and 5954) grown on EMM+UA were replicated onto 5-FOA+UA plates. Leu+ Ura cells selectively form colonies on 5-FOA+UA plates. d GCR rates of wild-type, srr1∆, skb1∆, rad51∆, srr1∆ rad51∆, skb1∆ rad51∆, and srr1∆ skb1∆ rad51∆ strains (TNF5369, 5774, 5772, 5411, 5904, 5788, and 8432). e GCR rates of wild-type, rad51∆, srr1∆ rad51∆, srr1-W157R rad51∆ (TNF8344), skb1∆ rad51∆, skb1-A377V rad51∆ (TNF8359), and srr1-W157R skb1-A377V rad51∆ (TNF8547). Each dot represents a value obtained from an independent experiment. Black lines show the median. Rates relative to the wild-type are shown on top of each dot cluster. The two-tailed Mann-Whitney test between the wild-type and mutant strains and between the indicated pairs. ns, non-significant; **p < 0.01; ***p < 0.001; ****, p < 0.0001. Numerical data underlying the graphs d and e are provided in Table A in Supplementary Data 1.
Fig. 2
Fig. 2. Srr1 and Skb1 cause isochromosome formation but not chromosomal truncation.
a Depicted are the non-repetitive (cnt3) and repetitive sequences (the innermost imr3, dg, dh, and the outermost irc3) in cen3. The ura4+ marker gene is placed at 10 kb from cen3. Loss of Rad51 increases isochromosomes and chromosomal truncations. b Chromosomal DNAs prepared from the parental (P) and independent GCR clones of rad51∆, srr1∆ rad51∆, and skb1∆ rad51∆ strains (TNF5411, 5904, and 5788) were separated by PFGE. Sizes of lambda (λ) DNA ladders are indicated on the left of the panels. Sample numbers of isochromosomes and truncations are shown in blue and magenta, respectively. c Rates of isochromosome formation and chromosomal truncation in wild-type (TNF5369), rad51∆, srr1∆ rad51∆, skb1∆ rad51∆, and skb1-F319Y rad51∆ (TNF8391) strains. Rates relative to the rad51∆ strain are indicated on the top of the bars. The two-tailed Fischer’s exact test between the rad51∆ and other mutant strains. **p < 0.01; ****p < 0.0001. Numerical data underlying c are provided in Table B in Supplementary Data 1. Uncropped gel images are shown in Supplementary Fig. 5.
Fig. 3
Fig. 3. srr1 but not skb1 mutations increase DNA damage sensitivity.
a A serial dilution assay to determine the sensitivity to DNA damaging agents. Log-phase cultures of wild-type, srr1-W157R, srr1Δ, rad51Δ, srr1-W157R rad51Δ, and srr1Δ rad51Δ (TNF3885, 8280, 5847, 5845, 8573, and 5849) prepared in YE3S medium were spotted onto YE3S plates supplemented with the indicated concentrations of MMS, HU, or CPT (top panels). Log-phase cultures of wild-type, skb1Δ, rad51Δ, and skb1Δ rad51Δ (TNF35, 8321, 8107, and 8320) prepared in YE medium were spotted onto YE plates (bottom panels). b Wild-type, srr1Δ, skb1Δ, and chk1Δ cells (TNF35, 5943, 8321, and 3559) in the log phase in EMM were treated with 0.01% MMS. The percentage of cells containing a septum is indicated. > 300 cells are counted at each point. Pearson’s Chi-square test of the septation index between wild-type and other strains at t = 8 h showed that srr1Δ or skb1Δ did not significantly change the septation index (p > 0.05) but chk1Δ increased it. c Chk1 phosphorylation in response to MMS treatment. Before and after 4 h treatment with 0.01% MMS, extracts were prepared from chk1+ (TNF7555) and chk1-HA+ cells of wild-type, srr1Δ, and skb1Δ (TNF8441, 8799, and 8802) and separated by 8% SDS-PAGE. Chk1-HA was detected by Western blotting using anti-HA antibodies (16B12). Whole proteins were stained using Coomassie brilliant blue. Size markers (Takara, 3454 A, CLEARLY stained protein ladder) are shown on the left. wt, wild-type. Uncropped images are shown in Supplementary Fig 6. d Wild-type and srr1Δ (TNF5369 and 5774) cells were plated onto adenine-limited YE plates, on which ade6 cells form red colonies. e Chromosome loss rates of wild-type, srr1Δ, srr1-W157R, skb1Δ, rad51Δ, srr1-W157R rad51Δ, and skb1Δ rad51Δ strains (TNF5369, 5774, 8308, 5772, 5411, 8344, and 5788). The two-tailed Mann-Whitney test. **p < 0.01; ***p < 0.001. Numerical data underlying b, e are provided in Tables C and D, respectively, in Supplementary Data 1.
Fig. 4
Fig. 4. Srr1 plays a role in the Rad52-independent GCR pathway.
a GCR rates of wild-type, srr1∆, rad52-R45K, srr1∆ rad52-R45K, rad51∆, srr1-W157R rad51∆, rad52-R45K rad51∆, srr1-W157R rad52-R45K rad51∆, pcn1-K107R rad51∆, and srr1-W157R pcn1-K107R rad51∆ strains (TNF5369, 5774, 6599, 8281, 5411, 8344, 7122, 8663, 6761, and 8601). The two-tailed Mann-Whitney test. b Tetrad analysis of srr1∆ and rad52∆. srr1::kanR and rad52::hygR haploids (TNF5943 and 7988) were crossed, and the resulting tetrads were dissected on YE plates under a microscope. Images of three sets of three-spore viable tetrads in which the srr1::kanR rad52::hygR progenies did not form colonies are shown. c Depletion of Rad52 by the AID system impairs the growth of srr1∆ cells. rad52-AID, srr1∆ rad52-AID, OsTIRF74A, srr1∆ OsTIRF74A, rad52-AID OsTIRF74A, and srr1∆ rad52-AID OsTIRF74A (TNF8614, 8621, 8616, 8623, 8617, and 8627) were spotted on YE plates supplemented with 200 nM 5’a-IAA which induces Rad52 depletion. d Rpa2-mCherry foci (arrowhead) were observed by fluorescence microscopy in wild-type cells (TNF5492). Fluorescence and DIC images are overlayed. DIC, differential interference contrast. A bar shown below the image indicates 10 µm. The bar graph shows percentages of nuclei containing at least one Rpa2-mCherry focus in wild-type and srr1∆ (TNF8803) strains. The bars represent the mean of three independent experiments. The two-tailed student’s t-test. e Rad52-GFP foci (arrowhead) were observed in wild-type cells (TNF4442). The bar graph shows percentages of nuclei containing at least one Rad52-GFP focus in wild-type and srr1∆ (TNF6130) strains. Numerical data underlying a are provided in Table A, and those underlying d and e are in Table F in Supplementary Data 1.
Fig. 5
Fig. 5. A role of the SRR1-like domain in GCRs and DNA damage repair.
a Positions of the fission yeast srr1-D111A,P112A, -H148A, and -W157R mutation sites are indicated by blue circles. Similar and identical residues among the different species are highlighted in pale and dark gray, respectively. b A ribbon model of the Srr1 structure predicted by AlphaFold methods. Positions of the mutation sites are indicated. c A surface model of the Srr1 structure. Positively and negatively charged residues are shown in blue and red, respectively. d GCR rates of wild-type, rad51∆, srr1∆ rad51∆, srr1-W157R rad51∆, srr1-D111A,P112A rad51∆, and srr1-H148A rad51∆ (TNF5369, 5411, 5904, 8344, 8686, and 8387). The two-tailed Mann-Whitney test. Numerical data are provided in Table A in Supplementary Data 1. e Mutating the conserved residues in the SRR1-like domain increases the sensitivity to MMS, HU, and CPT. Wild-type, srr1∆, srr1-W157R, srr1-H148A, and srr1-D111A,P112A (TNF3885, 5847, 8280, 8275, and 8274) cells were spotted onto YE3S supplemented with the indicated concentrations of MMS, HU, or CPT.
Fig. 6
Fig. 6. Skb1 arginine methyltransferase acts in the Rad52-dependent GCR pathway.
a GCR rates of wild-type, skb1∆, slf1∆, pom1∆, rad51∆, skb1∆ rad51∆, slf1∆ rad51∆, and pom1∆ rad51∆ strains (TNF5369, 5772, 8811, 8813, 5411, 5788, 8834, and 8838). b Shown are the structure of the arginine methyltransferase domain of the fission yeast S. pombe Skb1 predicted by AlphaFold methods and the crystal structure of the arginine methyltransferase domain of C. elegans PRMT5 (PDB code 3UA3) with SAH, a SAM analog. Positions of the phenylalanine (F) and glutamic acid (E) residues essential for arginine methyltransferase activity are indicated. c GCR rates of wild-type, rad51∆, skb1∆ rad51∆, skb1-A377V rad51∆, skb1-F319Y rad51∆, and skb1-E422A,E431A rad51∆ strains (TNF5369, 5411, 5788, 8359, 8391, and 8474). d PFGE separated GCR products of the skb1-F319Y rad51∆ strain. Sample numbers of isochromosomes and truncations are shown in blue and magenta, respectively. e GCR rates of wild-type, skb1∆, rad52-R45K, skb1∆ rad52-R45K, rad51∆, skb1∆ rad51∆, rad52-R45K rad51∆, and skb1∆ rad52-R45K rad51∆ strains (TNF5369, 5772, 6599, 8324, 5411, 5788, 7122, and 8345). The two-tailed Mann-Whitney test. Numerical data underlying a, c, and e are provided in Table A in Supplementary Data 1. Uncropped gel images are shown in Supplementary Fig. 5.

References

    1. Pascarella G, et al. Recombination of repeat elements generates somatic complexity in human genomes. Cell. 2022;185:3025–3040. doi: 10.1016/j.cell.2022.06.032. - DOI - PubMed
    1. Carvalho CM, Lupski JR. Mechanisms underlying structural variant formation in genomic disorders. Nat. Rev. Genet. 2016;17:224–238. doi: 10.1038/nrg.2015.25. - DOI - PMC - PubMed
    1. Nurk S, et al. The complete sequence of a human genome. Science. 2022;376:44–53. doi: 10.1126/science.abj6987. - DOI - PMC - PubMed
    1. Koonin EV. Evolution of genome architecture. Int J. Biochem Cell Biol. 2009;41:298–306. doi: 10.1016/j.biocel.2008.09.015. - DOI - PMC - PubMed
    1. Altemose N, et al. Complete genomic and epigenetic maps of human centromeres. Science. 2022;376:eabl4178. doi: 10.1126/science.abl4178. - DOI - PMC - PubMed

Publication types

MeSH terms