. 2023 May 26;13(1):8553.
doi: 10.1038/s41598-023-35650-2.

Deep ultraviolet fluorescence microscopy of three-dimensional structures in the mouse brain

Affiliations

Deep ultraviolet fluorescence microscopy of three-dimensional structures in the mouse brain

Deepa Kamath Kasaragod et al. Sci Rep. .

Abstract

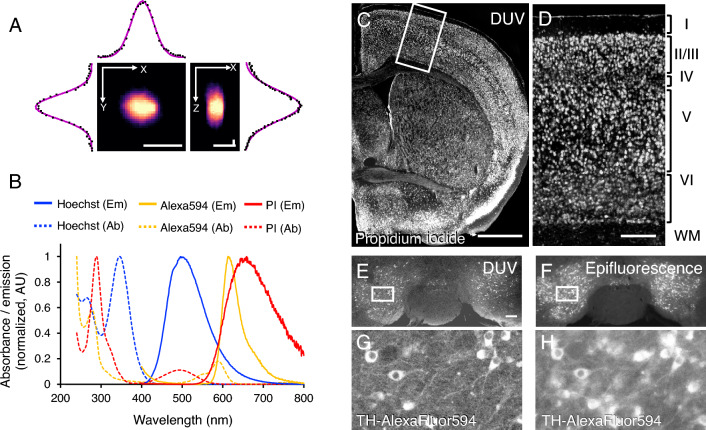
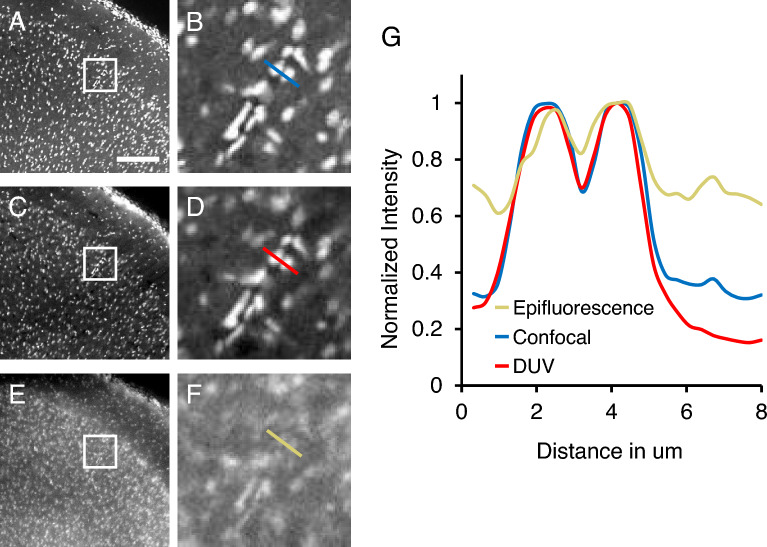
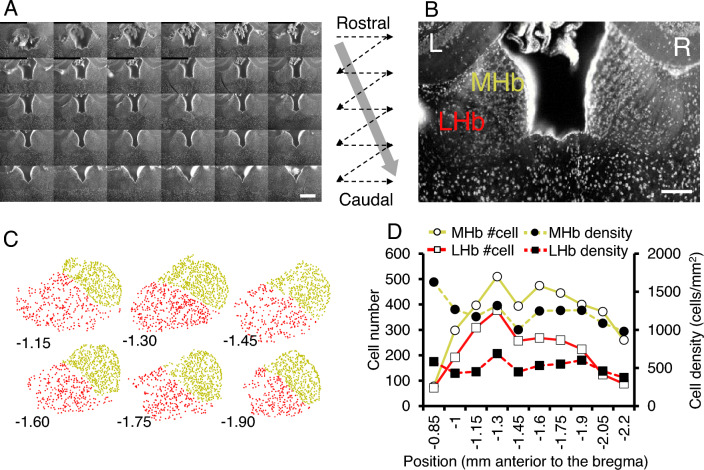
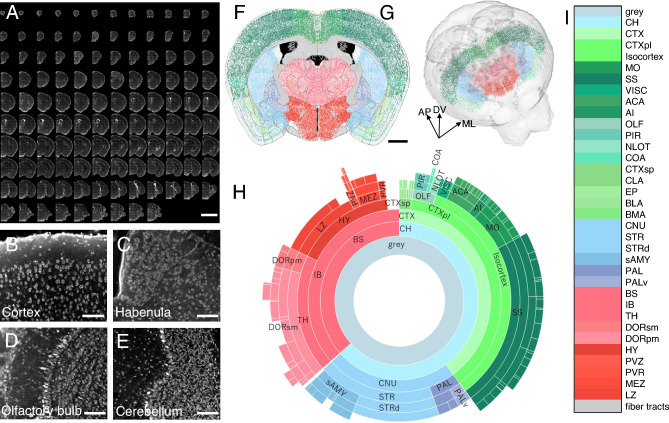
Three-dimensional (3D) imaging at cellular resolution improves our understanding of the brain architecture and is crucial for structural and functional integration as well as for the understanding of normal and pathological conditions in the brain. We developed a wide-field fluorescent microscope for 3D imaging of the brain structures using deep ultraviolet (DUV) light. This microscope allowed fluorescence imaging with optical sectioning due to the large absorption at the surface of the tissue and hence low tissue penetration of DUV light. Multiple channels of fluorophore signals were detected using single or a combination of dyes emitting fluorescence in the visible range of spectrum upon DUV excitation. Combination of this DUV microscope with microcontroller-based motorized stage enabled wide-field imaging of a coronal section of the cerebral hemisphere in mouse for deciphering cytoarchitecture of each substructure in detail. We extended this by integrating vibrating microtome which allowed serial block-face imaging of the brain structure such as the habenula in mouse. Acquired images were with resolution high enough for quantification of the cell numbers and density in the mouse habenula. Upon block-face imaging of the tissues covering entire extent of the cerebral hemisphere of the mouse brain, acquired data were registered and segmented for quantification of cell number in each brain regions. Results in the current analysis indicated that this novel microscope could be a convenient tool for large-scale 3D analysis of the brain in mice.


Conflict of interest statement

The authors declare no competing interests.

Figures

Figure 1
Figure 1
Overview of the 3D-DUV microscope. (A) A photo of the entire microscope system showing a combination of the optical parts (1, 2 for camera and light source, respectively), vibrating microtome (3) and motorized stage (4–6 for 3-axes translating stage, stepper motors and their driver unit, respectively). (B) A photo of the magnified view of the imaging part showing orientation of the cutting blade (7) and sample stage (8) of the vibrating microtome with optical parts including objective lens (9) and light source (10). (C) A schematic of the imaging and serial sectioning parts integrated via microcontroller (Arduino). (D) A schematic of the workflow design of serial sectioning and block-face imaging. (E) A schematic of the tissue sample embedded in the agarose to show that only the surface of the sample block (dark blue) but not the deeper part (light blue) is imaged. Upon sectioning by the thickness larger than the previously imaged depth, new surface will be imaged consecutively.
Figure 2
Figure 2
DUV imaging of the mouse brain stained with synthetic dye and immunohistochemistry. (A) Reconstructed DUV images of a fluorescent bead (TetraSpeck, 4 µm in diameter) projected onto the X–Y and X–Z spaces with intensity plots (raw and Gaussian-fitted data as shown by black dots and magenta solid lines, respectively). (B) Line plots of the normalized absorbance (Ab, dashed) and emission (Em, solid) spectra of the synthetic dyes (Hoechst 33258 and propidium iodide in blue and red, respectively) and Alexa Fluor 594-conjugated anti-rabbit IgG antibody (orange). (C, D) DUV images of a coronal section of the mouse brain stained with propidium iodide showing Nissl-like staining of the cell bodies of neurons in the cerebral hemisphere and in the cerebral cortex. Panel (D) is a magnified view of a boxed area in (C). (E, F) Tiled images of the mouse midbrain imaged with DUV (E, G) and epifluorescence (F, H) showing expression of tyrosine hydroxylase (TH) visualized with Alexa Fluor 594. Panels (G) and (H) are magnified views of the boxed areas in panels (E) and (F), respectively. Scale bars represent 4 µm (A), 1 mm (C), 200 µm (D), 200 µm (E, applies to F). Roman numerals on the right of panel D indicate the layers of the cerebral cortex. WM White matter.
Figure 3
Figure 3
Block-face imaging of a thick block of mouse brain over exposed region stained with Hoechst 33258. (AF) Coronal sections of the secondary motor area of the mouse cerebral cortex imaged by the confocal microscope (A, B), DUV microscope (C, D), and epifluorescence microscope using visible light (405 nm) for excitation (E, F). Panels (B, D) and (F) are magnified view of the boxed areas in panels (A, C, E), respectively. (G) Normalized intensity plots of the signals acquired along the coloured lines in panel (B, D, F). Scale bar, 100 μm (applies to panels C and E).
Figure 4
Figure 4
Quantitative assessment of the optical sectioning thickness in the mouse brain. (A) A coronal section showing the segmented cells outlined in yellow. (B) A box plot of the DUV signal intensities for each depth and the exponential curve fit to obtain the 1/e depth for the estimation of the optical sectioning thickness. (C) Magnified view of the boxed area in A imaged using 10 × and 20 × water objective lens. Co-registered DUV and confocal images from the z-stack at depth of 0, 18 and 36 μm are shown. (D) A line plot of correlation coefficient between DUV image and confocal z-stack at each axial location using 10 × (red) and 20 × objective lens (blue). Scale bars represent 200 µm (A) and 25 µm (C).
Figure 5
Figure 5
Quantitative analysis of the 3D dataset for the mouse habenula acquired by DUV sectioning tomography. (A) Montage of the coronal sections showing 30 DUV images of the entire extent of the mouse habenula stained with propidium iodide (step size, 50 µm). (B) A coronal section of the bilateral habenula showing the medial (MHb) and lateral habenula (LHb) as substructures. (C) Mapping of the cells onto entire extent of the MHb (yellow) and LHb (red) along rostro-caudal axis as revealed by Cell Counter plugin in ImageJ. (D) Line plots of the cell count (solid lines) and density (dashed lines) in MHb (yellow) and LHb (red). Values in abscissa represent the rostro-caudal position of the coronal section relative to the bregma. L, left; R, right. Scale bar, 500 µm (A) 200 µm (B).
Figure 6
Figure 6
Quantitative analysis of the 3D dataset for the mouse whole brain acquired by DUV sectioning tomography. (A) Montage of the coronal sections showing 117 DUV images of the entire extent of the mouse whole brain stained with propidium iodide (step size, 100 µm). (BE) DUV images of the mouse cerebral cortex (B), habenula (C), olfactory bulb (D) and cerebellum (E) showing layered (B, D, E) and nuclear (C) structures. (F, G) Mapping of the identified neuronal cell bodies mapped onto a coronal plane (F) and 3D model of mouse brain atlas (G). (H, I) A sunburst plot (H) of the cell count mapped onto the brain structures colour-coded as shown in I. AP, anterior–posterior axis. DV, dorso-ventral axis. ML, medio-lateral axis. Scale bar, 5 mm (A) 200 µm (B, applies to CE), 1.5 mm (F). CH Cerebrum, CTX Cerebral cortex, CTXpl Cortical plate, MO Somatomotor areas, SS Somatosensory areas, VISC Visceral area, ACA Anterior cingulate area, AI Agranular insular area, OLF Olfactory areas, PIR Piriform area, NLO Nucleus of the lateral olfactory tract, COA Cortical amygdalar area, CTXsp Cortical subplate, CLA Claustrum, EP Endopiriform nucleus, BLA Basolateral amygdalar nucleus, BMA Basomedial amygdalar nucleus, CNU Cerebral nuclei, STR Striatum, STRd Striatum dorsal region, sAMY Striatum-like amygdalar nuclei, PAL Pallidum, PALv Pallidum, ventral region, BS Brain stem, IB Interbrain, TH Thalamus, DORsm Thalamus, sensory-motor cortex related, DORpm Thalamus, polymodal association cortex related, HY Hypothalamus, PVZ Periventricular zone, PVR Periventricular region, MEZ Hypothalamic medial zone, LZ Hypothalamic lateral zone.

Similar articles

Cited by

References

    1. Seiriki K, et al. High-speed and scalable whole-brain imaging in rodents and primates. Neuron. 2017;94:1085–1100.e6. doi: 10.1016/j.neuron.2017.05.017. - DOI - PubMed
    1. Yang E, et al. Three-dimensional analysis of mouse habenula subnuclei reveals reduced volume and gene expression in the lipopolysaccharide-mediated depression model. Exp. Neurobiol. 2019;28:709–719. doi: 10.5607/en.2019.28.6.709. - DOI - PMC - PubMed
    1. Pichat J, Iglesias JE, Yousry T, Ourselin S, Modat M. A survey of methods for 3D histology reconstruction. Med. Image Anal. 2018;46:73–105. doi: 10.1016/j.media.2018.02.004. - DOI - PubMed
    1. Zheng T, et al. Review of micro-optical sectioning tomography (MOST): technology and applications for whole-brain optical imaging [Invited] Biomed. Opt. Express. 2019;10:4075. doi: 10.1364/BOE.10.004075. - DOI - PMC - PubMed
    1. Gong H, et al. High-throughput dual-colour precision imaging for brain-wide connectome with cytoarchitectonic landmarks at the cellular level. Nat. Commun. 2016;7:12142. doi: 10.1038/ncomms12142. - DOI - PMC - PubMed

Publication types