. 2023 Jun;163(2):327-338.
doi: 10.1007/s11060-023-04341-3. Epub 2023 May 26.

Comparative analysis of deeply phenotyped GBM cohorts of 'short-term' and 'long-term' survivors

Affiliations

Comparative analysis of deeply phenotyped GBM cohorts of 'short-term' and 'long-term' survivors

Archita Biswas et al. J Neurooncol. 2023 Jun.

Abstract

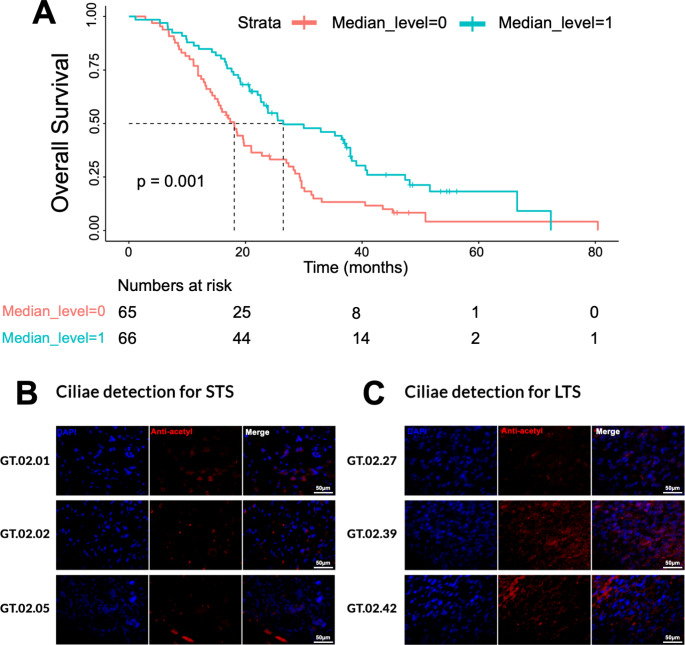
Background: Glioblastoma (GBM) is an aggressive brain cancer that typically results in death in the first 15 months after diagnosis. There have been limited advances in finding new treatments for GBM. In this study, we investigated molecular differences between patients with extremely short (≤ 9 months, Short term survivors, STS) and long survival (≥ 36 months, Long term survivors, LTS).

Methods: Patients were selected from an in-house cohort (GLIOTRAIN-cohort), using defined inclusion criteria (Karnofsky score > 70; age < 70 years old; Stupp protocol as first line treatment, IDH wild type), and a multi-omic analysis of LTS and STS GBM samples was performed.

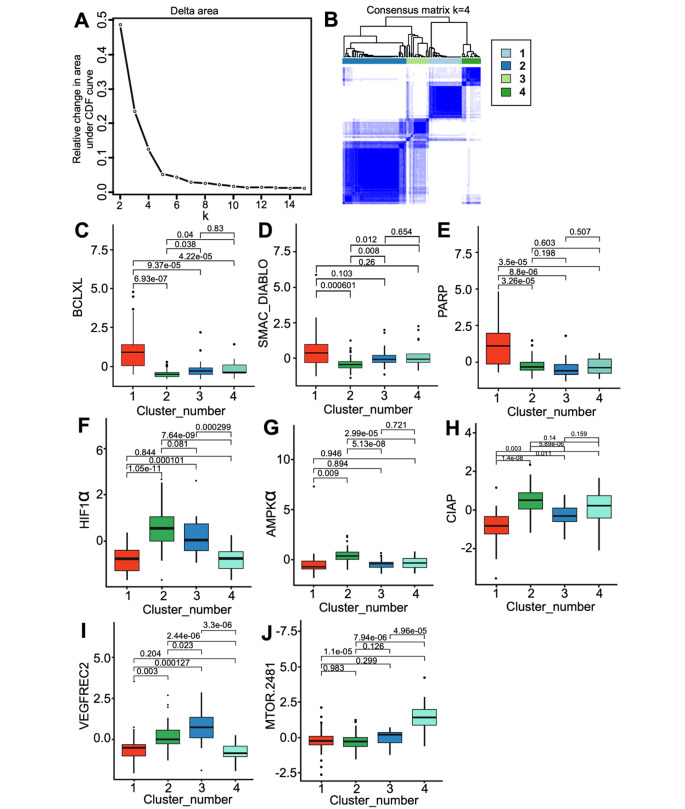
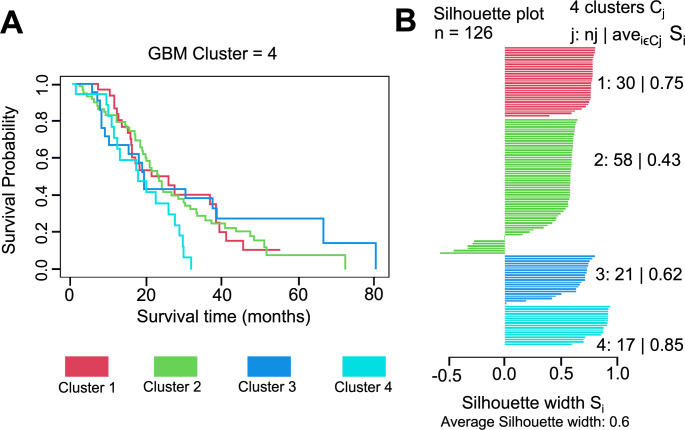
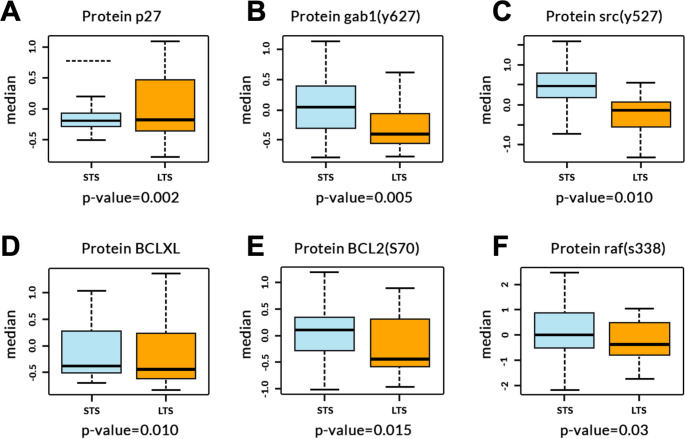
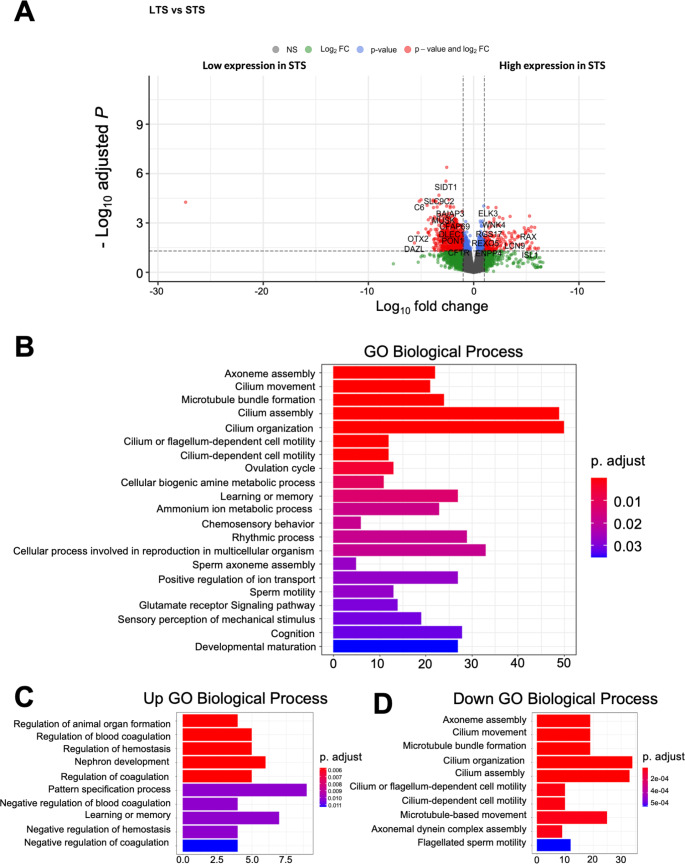
Results: Transcriptomic analysis of tumour samples identified cilium gene signatures as enriched in LTS. Moreover, Immunohistochemical analysis confirmed the presence of cilia in the tumours of LTS. Notably, reverse phase protein array analysis (RPPA) demonstrated increased phosphorylated GAB1 (Y627), SRC (Y527), BCL2 (S70) and RAF (S338) protein expression in STS compared to LTS. Next, we identified 25 unique master regulators (MR) and 13 transcription factors (TFs) belonging to ontologies of integrin signalling and cell cycle to be upregulated in STS.

Conclusion: Overall, comparison of STS and LTS GBM patients, identifies novel biomarkers and potential actionable therapeutic targets for the management of GBM.

Keywords: Apoptosis; Cell cycle; Cilium; Glioblastoma; Long term survivors; RNA-sequencing; Reverse phase protein array; Short term survivors; Transcriptomics.


Conflict of interest statement

The authors declare no competing interests.

Figures

Fig. 1
Fig. 1
Identification of 4 (phospho-)protein clusters in GBM samples. (A) Elbow plot indicates the relative change in area under CDF curve vs. the k clusters. (B) Unsupervised CNF clustering for N = 126 samples indicates 4 distinct clusters. Boxplots reveal higher median expression of protein levels at cluster 1 for BCLXL (C), SMAC/DIABLO (D), and PARP (E); cluster 2 for HIF1α (F), AMPKα (G), and CIAP (H); cluster 3 for VEGFREC2 (I); and cluster 4 for mTOR(2481) (J). Likelihood-ratio t-test was used to calculate the significant difference between each cluster (ANOVA, Tukey HSD p-adjust. < 0.05)
Fig. 2
Fig. 2
OS and silhouette plot for RPPA data across the GT cohort. (A) OS analysis plot showing the survival rate of all samples present in four different clusters. (B) Silhouette plot displayed a measure of how close each sample in one cluster is to sample in the neighbouring clusters. ((N = 30 (cluster 1), N = 58 (cluster 2), N = 21 (cluster 3) and N = 17 (cluster 4))
Fig. 3
Fig. 3
Proteins differentiating STS and LTS. Boxplots for proteins P27, GAB1 Y627, SRC Y527, BCLXL, BCL2 S70 and RAF S338 with p value for STS and LTS in GLIOTRAIN cohort. Likelihood ratio p-value < 0.05. N = 18(STS), N = 30(LTS)
Fig. 4
Fig. 4
(A). Volcano plot showing DEGs for STS vs. LTS samples. (B) Overall, GO analysis for DEGs. (N = 1577). (C) GO annotations for up regulated genes enriched in STS samples. (D) GO annotations for down regulated genes enriched in LTS samples
Fig. 5
Fig. 5
(A) OS analysis for the median expression for the cilium genes mapped from GO analysis. 44 cilium genes were mapped, and their median expression were taken for the GT dataset. The pink line demonstrates lower level of expression from the median value and the blue line shows higher level of expression from the calculated median value. Detection of ciliae in (B) STS and (C) LTS GBM samples using an anti-acetyl-alpha Tubulin antibody (red; middle panel). Nuclei were counterstained with DAPI (blue). Scale bar = 50 μm

References

    1. Wirsching HG, Galanis E, Weller M. Glioblastoma Handb Clin Neurol. 2016;134:381–397. doi: 10.1016/B978-0-12-802997-8.00023-2. - DOI - PubMed
    1. Lacroix M, et al. A multivariate analysis of 416 patients with glioblastoma multiforme: prognosis, extent of resection, and survival. J Neurosurg. 2001;95(2):190–198. doi: 10.3171/jns.2001.95.2.0190. - DOI - PubMed
    1. Lara-Velazquez M et al (2017) Advances in brain tumor surgery for glioblastoma in adults. Brain Sci, 7(12) - PMC - PubMed
    1. Hegi ME, et al. MGMT gene silencing and benefit from temozolomide in glioblastoma. N Engl J Med. 2005;352(10):997–1003. doi: 10.1056/NEJMoa043331. - DOI - PubMed
    1. Louis DN, et al. The 2021 WHO classification of tumors of the Central Nervous System: a summary. Neuro Oncol. 2021;23(8):1231–1251. doi: 10.1093/neuonc/noab106. - DOI - PMC - PubMed