. 2023 May 26;21(1):197.
doi: 10.1186/s12916-023-02887-7.

Adipsin alleviates cardiac microvascular injury in diabetic cardiomyopathy through Csk-dependent signaling mechanism

Affiliations

Adipsin alleviates cardiac microvascular injury in diabetic cardiomyopathy through Csk-dependent signaling mechanism

Xuebin Zhang et al. BMC Med. .

Abstract

Background: Microvascular complications are associated with an overtly increased risk of adverse outcomes in patients with diabetes including coronary microvascular injury which manifested as disruption of adherens junctions between cardiac microvascular endothelial cells (CMECs). However, particular mechanism leading to diabetic coronary microvascular hyperpermeability remains elusive.

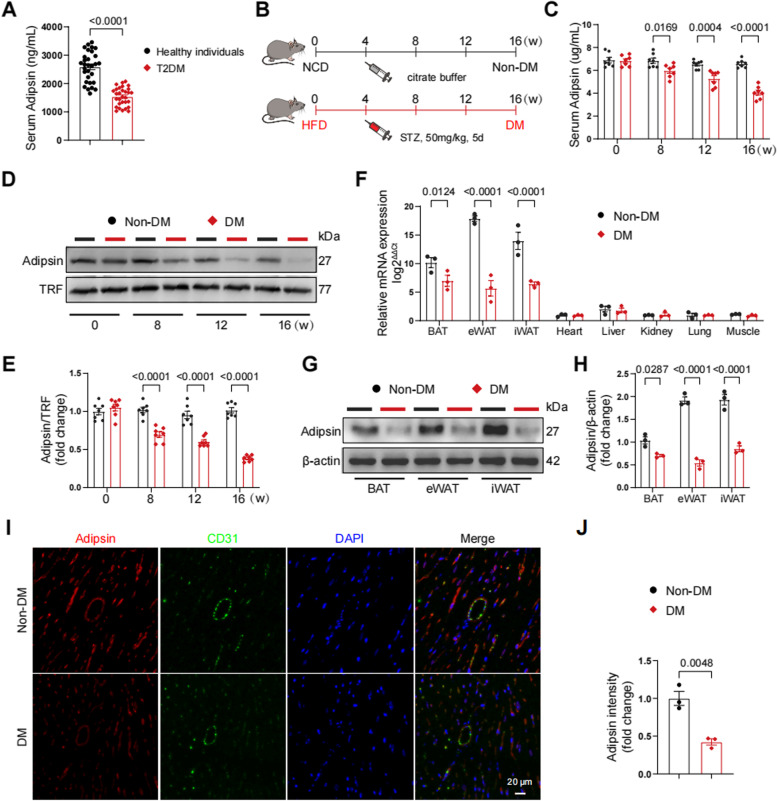
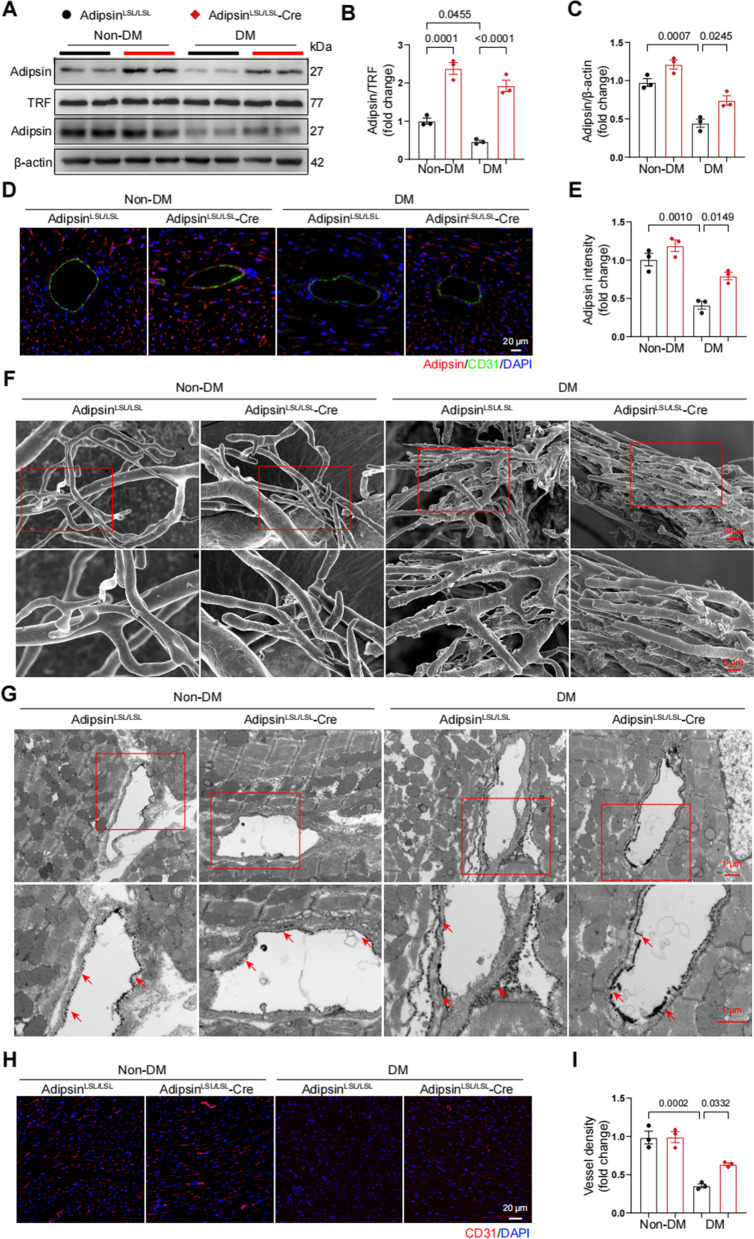
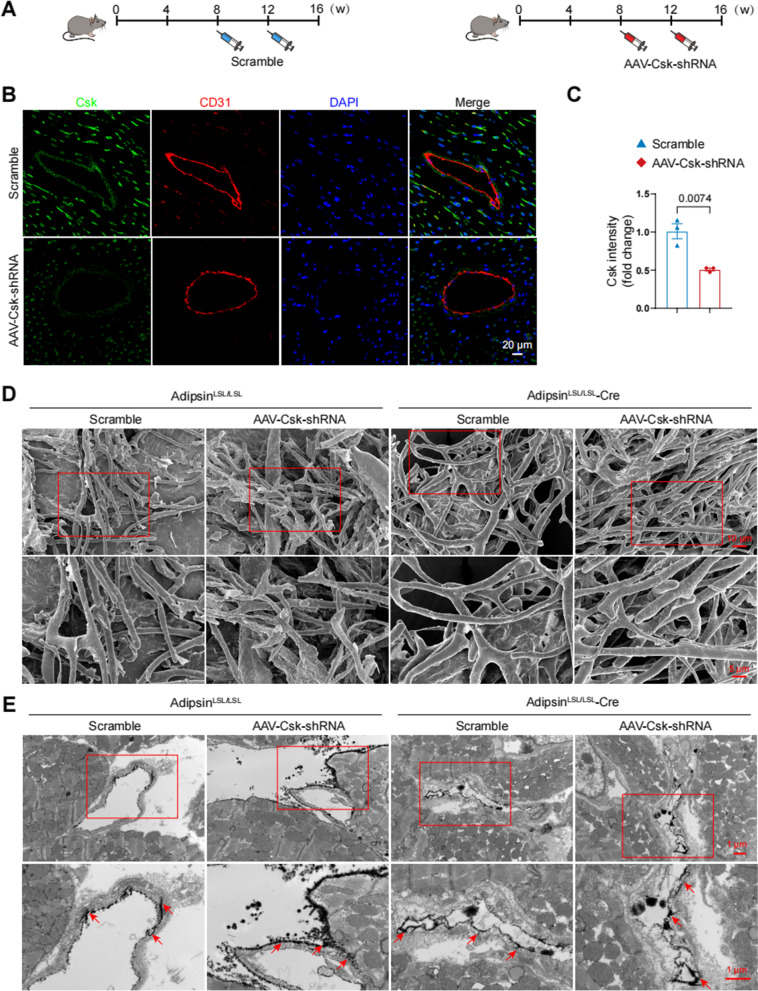
Methods: Experimental diabetes was induced in mice with adipose tissue-specific Adipsin overexpression (AdipsinLSL/LSL-Cre) and their respective control (AdipsinLSL/LSL). In addition, cultured CMECs were subjected to high glucose/palmitic acid (HG + PA) treatment to simulate diabetes for a mechanistic approach.

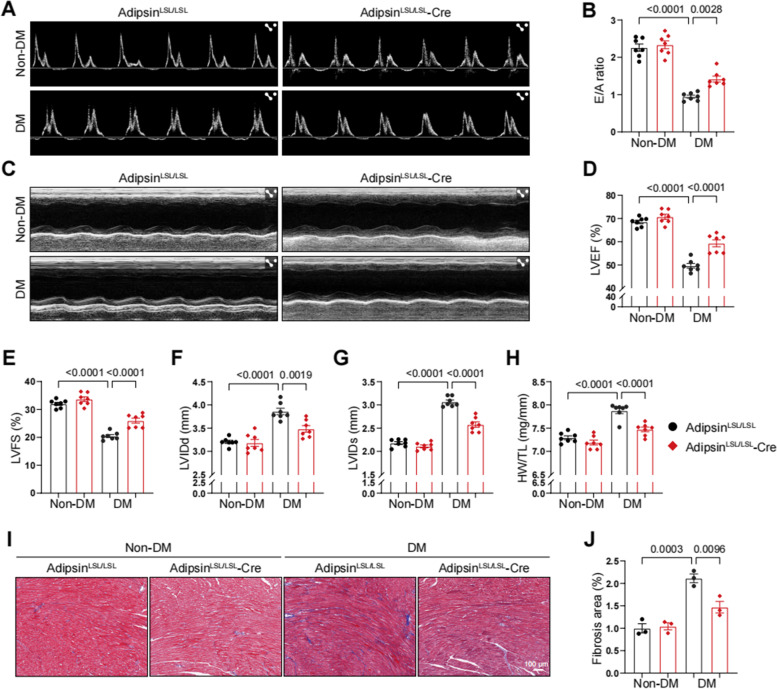
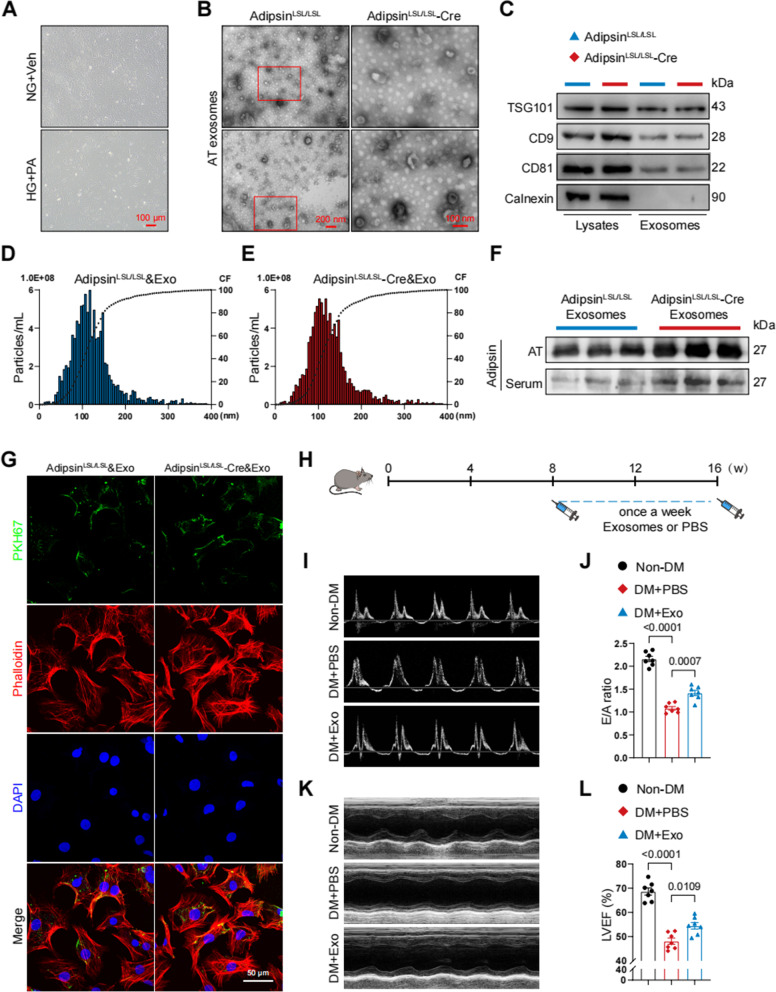
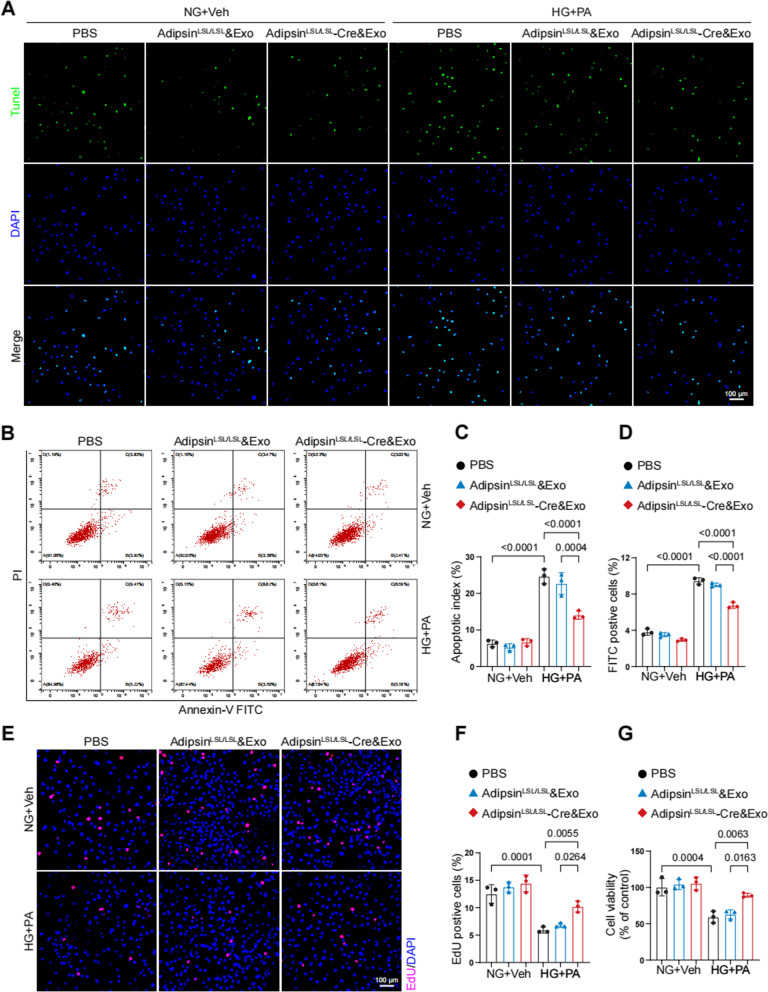
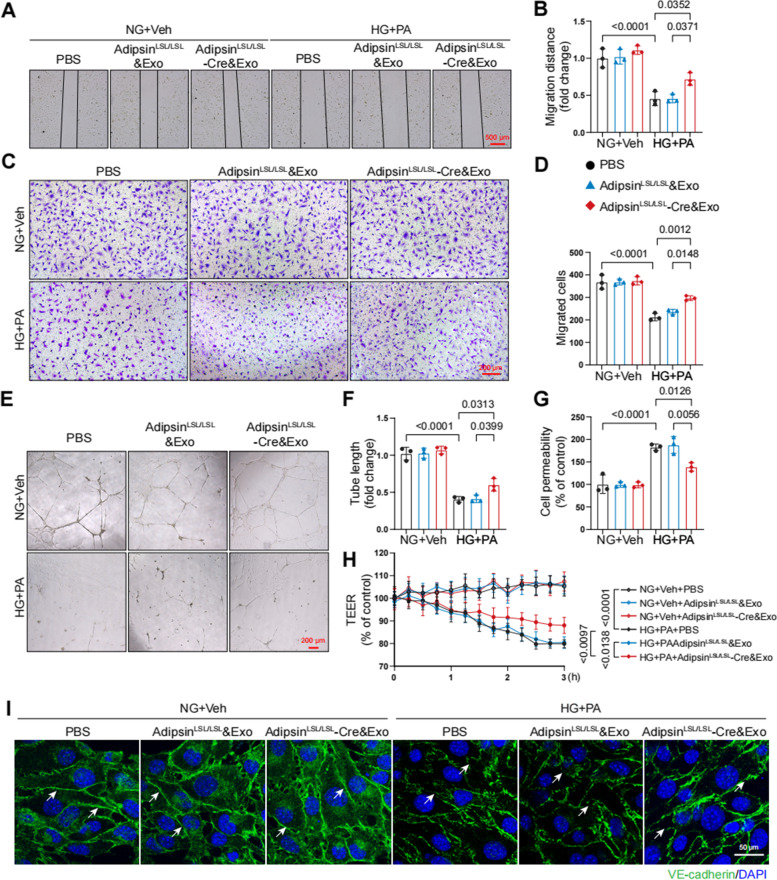
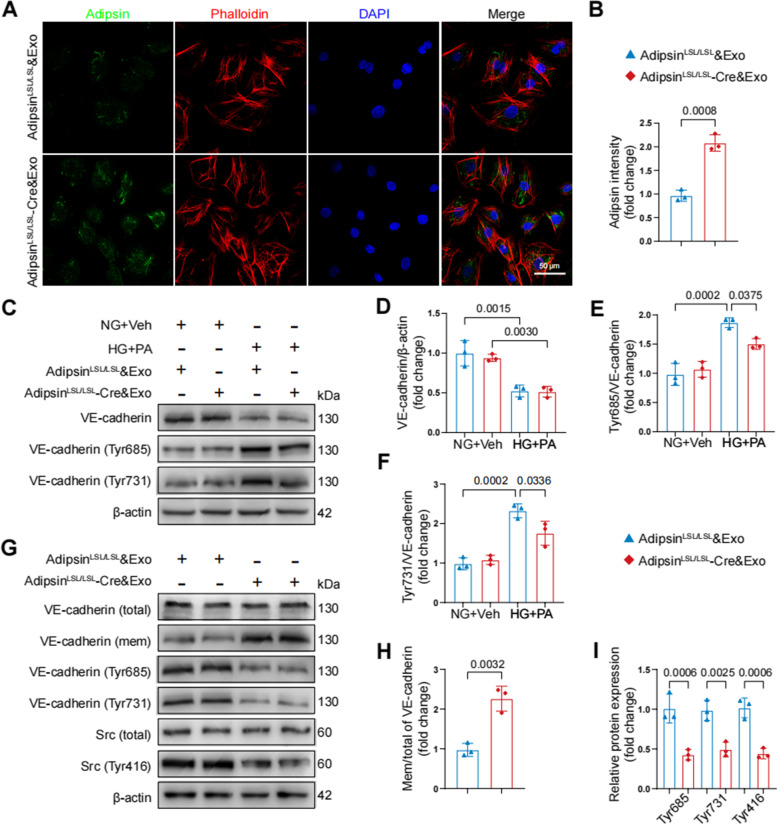
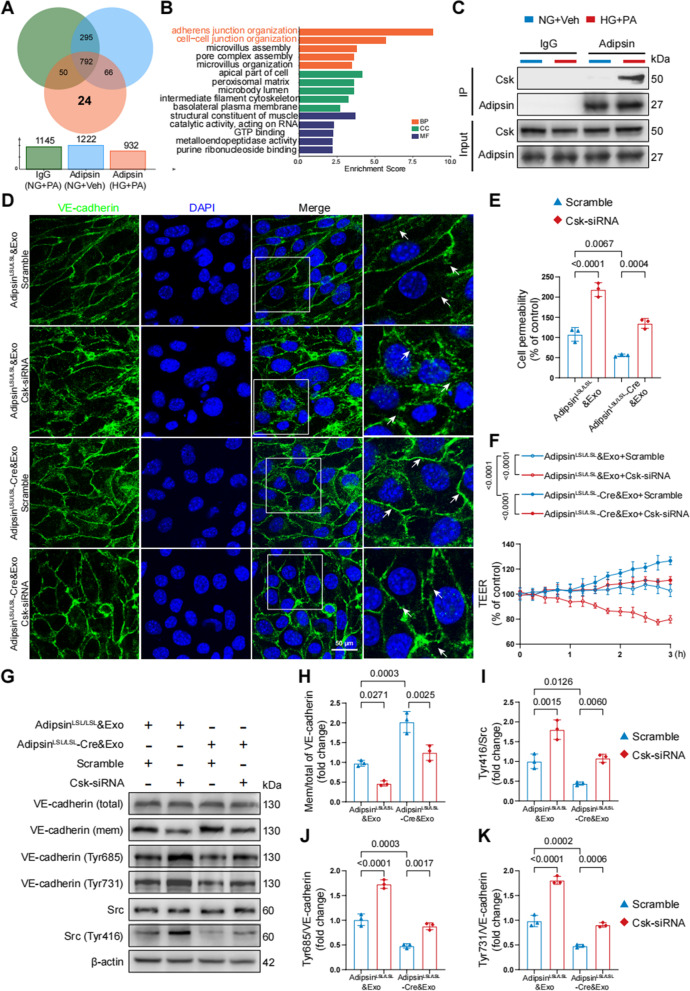
Results: The results showed that Adipsin overexpression significantly reduced cardiac microvascular permeability, preserved coronary microvascular integrity, and increased coronary microvascular density. Adipsin overexpression also attenuated cardiac dysfunction in diabetic mice. E/A ratio, an indicator of cardiac diastolic function, was improved by Adipsin. Adipsin overexpression retarded left ventricular adverse remodeling, enhanced LVEF, and improved cardiac systolic function. Adipsin-enriched exosomes were taken up by CMECs, inhibited CMECs apoptosis, and increased CMECs proliferation under HG + PA treatment. Adipsin-enriched exosomes also accelerated wound healing, rescued cell migration defects, and promoted tube formation in response to HG + PA challenge. Furthermore, Adipsin-enriched exosomes maintained adherens junctions at endothelial cell borders and reversed endothelial hyperpermeability disrupted by HG + PA insult. Mechanistically, Adipsin blocked HG + PA-induced Src phosphorylation (Tyr416), VE-cadherin phosphorylation (Tyr685 and Tyr731), and VE-cadherin internalization, thus maintaining CMECs adherens junctions integrity. LC-MS/MS analysis and co-immunoprecipitation analysis (Co-IP) unveiled Csk as a direct downstream regulator of Adipsin. Csk knockdown increased Src phosphorylation (Tyr416) and VE-cadherin phosphorylation (Tyr685 and Tyr731), while abolishing Adipsin-induced inhibition of VE-cadherin internalization. Furthermore, Csk knockdown counteracted Adipsin-induced protective effects on endothelial hyperpermeability in vitro and endothelial barrier integrity of coronary microvessels in vivo.

Conclusions: Together, these findings favor the vital role of Adipsin in the regulation of CMECs adherens junctions integrity, revealing its promises as a treatment target against diabetic coronary microvascular dysfunction. Graphical abstract depicting the mechanisms of action behind Adipsin-induced regulation of diabetic coronary microvascular dysfunction.

Trial registration: ClinicalTrials.gov NCT04570527.

Keywords: Adherens junctions; Adipsin; Diabetic cardiomyopathy; Exosomes; Permeability.


Conflict of interest statement

The authors declare that they have no competing interests.

Figures

Fig. 1
Fig. 1
Adipsin is downregulated in diabetic mice. A Serum Adipsin levels detected using ELISA assay in healthy individuals and T2DM. B Schematic protocols of high-fat diet and streptozotocin-induced type 2 diabetic mouse model. Non-DM, non-diabetes; DM, diabetes mellitus. C Serum Adipsin levels determined using ELISA at indicated time points in mice. D Representative Western blot images of serum Adipsin levels at 0, 8, 12, and 16 weeks following high-fat diet feeding. E Quantitative analysis of serum Adipsin levels in D. F Adipsin mRNA levels quantified in various tissues. G Representative Western blot images of Adipsin in different types of adipose tissues. BAT, brown adipose tissue, eWAT; epididymal white adipose tissue; iWAT, inguinal white adipose tissue. H Quantitative analysis of Adipsin levels in G. I Representative immunofluorescence images of Adipsin around blood vessels in mice. Scale bar = 20 μm. J Quantitative analysis of Adipsin fluorescence intensity in I. Data were presented as mean ± SEM. Student’s t‐test was used for statistical analysis
Fig. 2
Fig. 2
Adipose tissue-specific Adipsin overexpression improves microvascular dysfunction. A Representative Western blot images of Adipsin levels in serum and heart from different groups. B Quantitative analysis of serum Adipsin levels in A. C Quantitative analysis of Adipsin levels in cardiac tissues in A. D Representative immunofluorescence images of Adipsin around blood vessels. Scale bar = 20 μm. E Quantitative analysis of Adipsin fluorescence intensity in D. F Representative scanning electron micrographs of cardiac microvessels corrosion in different groups. Insert boxes indicated areas of magnification shown below. Scale bar = 10 μm (upper) and 5 μm (bottom). G Representative transmission electron micrographs of cardiac capillaries with lanthanum nitrate staining indicating barrier function. Insert boxes indicated areas of magnification shown below, and red arrowheads indicated areas of lanthanum nitrate deposition. Scale bar = 1 μm (upper) and 1 μm (bottom). H Representative immunofluorescence images of CD31 in cardiac tissue. Scale bar = 20 μm. I Quantitative analysis of blood vessel density in H. Data were presented as mean ± SEM. One-way ANOVA was used for statistical analysis
Fig. 3
Fig. 3
Adipose tissue-specific Adipsin overexpression inhibits cardiac hypertrophy and improves cardiac function. A Representative echocardiographic images of cardiac diastolic function. B Quantitative analysis of E/A ratio. C Representative echocardiographic images of cardiac systolic function. DG Quantitative analysis of left ventricular ejection fraction (LVEF), left ventricular fractional shortening (LVFS), left ventricular systolic internal dimension (LVIDs), and left ventricular diastolic internal dimension (LVIDd). H Ratio of heart weight (mg) to tibia length (mm). I Masson trichrome staining of cardiac tissue. Scale bar = 100 μm. J Quantification of the Masson staining density in I. Data were presented as mean ± SEM. One-way ANOVA was used for statistical analysis
Fig. 4
Fig. 4
Exosomes secreted by adipose tissues can be taken up by CMECs and improve cardiac function in DCM. A Representative images of primary cardiac microvascular endothelial cells treated with NG + vehicle or HG + PA. Scale bar = 100 μm. B Representative transmission electron microscopy images of exosomes. Scale bar = 200 nm (left) and 100 nm (right). C Representative Western blot images of exosomes protein markers (positive: TSG101, CD9, and CD81; negative: Calnexin). DE Representative size distribution of exosomes detected by nanoparticle tracking analysis. CF, cumulative frequencies. F Representative Western blot images of Adipsin levels in exosomes derived from serum and adipose tissue. G Representative immunofluorescence images of exosomes uptake. Scale bar = 50 μm. H Schematic illustration of experimental procedure. Mice were injected with exosomes isolated from adipose tissue of donor mice via tail veins. I Representative echocardiographic images of cardiac diastolic function. J Quantitative analysis of E/A ratio. K Representative echocardiographic images of cardiac systolic function. L Quantitative analysis of left ventricular ejection fraction (LVEF). Data were presented as mean ± SEM. One-way ANOVA was used for statistical analysis
Fig. 5
Fig. 5
Adipsin promotes proliferation and suppresses apoptosis in CMECs under HG + PA conditions. A Representative images of apoptosis evaluated by TUNEL Assay (green cells) in vitro. Scale bar = 100 μm. B Representative dot plots displaying proportions of apoptotic cells. D Quantitative analysis of Annexin V-FITC-positive cells. C The apoptotic index was expressed as the number of TUNEL-positive cells normalized to the total number of cells. E Representative immunofluorescence images of CMEC proliferation evaluated by EdU-based proliferation assay. Scale bar = 100 μm. F Quantitative analysis of EdU-positive cells. G Cell viability determined using CCK-8 assay. Data were presented as mean ± SEM. One-way ANOVA was used for statistical analysis
Fig. 6
Fig. 6
Adipsin promotes CMECs migration and tube formation while inhibits hyperpermeability in CMECs treated with HG + PA. A Wound healing scratches were imaged at 12 h after the initial scratch time point. Black lines indicated the boundary of the scratch. Scale bar = 500 μm. B Migration distances from edges of the wound. C Representative images of migrated cells in the transwell migration assay. Scale bar = 200 μm. D Quantitative analysis of migrated cells. E Representative images of tube formation assay. Scale bar = 200 μm. F Tube formation assays were quantified by measuring tube length. G Quantitative analysis of FITC-conjugated Dextran intensity evaluating monolayer cellular permeability. H Measurements of trans-endothelial electrical resistance (TEER). I Representative immunofluorescence images of cell-cell junctions, and white arrowheads indicated endothelial cell junctions. Scale bar = 50 μm. Data were presented as mean ± SEM. One-way ANOVA was used for statistical analysis
Fig. 7
Fig. 7
Adipsin interrupts HG + PA-induced VE-cadherin internalization by inhibiting Src activity. A Representative images of immunofluorescence staining for Adipsin in CMECs treated with AdipsinLSL/LSL&Exosomes or AdipsinLSL/LSL-Cre&Exosomes isolated from adipose tissues. Scale bar = 50 μm. B Quantitative analysis of Adipsin intensity in A. C Representative Western blot images for VE-cadherin (total), phospho-VE-cadherin (Tyr731), and phospho-VE-cadherin (Tyr685). DF Quantitative analysis of Western blot images from three independent experiments in C. G Representative Western blot images for VE-cadherin (total), VE-cadherin (membrane), phospho-VE-cadherin (Tyr731), phospho-VE-cadherin (Tyr685), Src, and phospho-Src (Tyr416). HI Quantitative Western blot analysis from three independent experiments in G. Data were presented as mean ± SEM. For B, H, and I, Student’s t‐test was used for statistical analysis. For DF, one-way ANOVA was used for statistical analysis
Fig. 8
Fig. 8
Adipsin directly bounds to Csk, impeding Src activity and VE-cadherin internalization. A Venn diagram showed the protein candidates as the targets of Adipsin. B GO analysis of Adipisn-associated proteins. GO, Gene Ontology; BP, biological process; CC, cellular component; MF, molecular function. C Representative Western blot images for co-immunoprecipitation of Adipsin interacting with Csk. D Representative immunofluorescence images of cell-cell junctions, and white arrowheads indicated endothelial cell junctions. Scale bar = 50 μm. E Quantitative analysis of FITC-conjugated Dextran intensity evaluating monolayer cellular permeability. F Measurements of trans-endothelial electrical resistance (TEER). G Representative Western blot images for VE-cadherin (total), VE-cadherin (membrane), phospho-VE-cadherin (Tyr685), phospho-VE-cadherin (Tyr731), Src, and phospho-Src (Tyr416). HK Quantitative analysis of Western blot images from three independent experiments in G. Data were presented as mean ± SEM. One-way ANOVA was used for statistical analysis
Fig. 9
Fig. 9
Csk serves as a critical downstream target of Adipsin. A Schematic illustration of adeno-associated virus 9 delivery leading to knockdown of Csk in CMECs. B Representative immunofluorescence images of Csk in cardiac tissue. Scale bar = 20 μm. C Quantitative analysis of Csk fluorescence intensity in B. D Representative scanning electron micrographs of cardiac microvessels corrosion in different groups. Inserted boxes indicated areas of magnification shown below. Scale bar = 10 μm (upper) and 5 μm (bottom). E Representative transmission electron micrographs of microvascular leakage of lanthanum nitrate evaluating endothelial permeability. Inserted boxes indicated areas of magnification shown below, and red arrowheads indicated areas of lanthanum nitrate deposition. Scale bar = 1 μm (upper) and 1 μm (bottom). Data were presented as mean ± SEM. Student’s t‐test was used for statistical analysis

References

    1. Ogurtsova K, da Rocha Fernandes JD, Huang Y, Linnenkamp U, Guariguata L, Cho NH, et al. IDF Diabetes Atlas: Global estimates for the prevalence of diabetes for 2015 and 2040. Diabetes Res Clin Pract. 2017;128:40–50. doi: 10.1016/j.diabres.2017.03.024. - DOI - PubMed
    1. Sarwar N, Gao P, Seshasai SR, Gobin R, Kaptoge S, Di Angelantonio E, et al. Diabetes mellitus, fasting blood glucose concentration, and risk of vascular disease: a collaborative meta-analysis of 102 prospective studies. Lancet. 2010;375(9733):2215–22. doi: 10.1016/S0140-6736(10)60484-9. - DOI - PMC - PubMed
    1. Kristensen SL, Rørth R, Jhund PS, Shen L, Lee M, Petrie MC, et al. Microvascular complications in diabetes patients with heart failure and reduced ejection fraction-insights from the Beta-blocker evaluation of survival trial. Eur J Heart Fail. 2018;20(11):1549–56. doi: 10.1002/ejhf.1201. - DOI - PubMed
    1. Solini A, Penno G, Bonora E, Fondelli C, Orsi E, Arosio M, et al. Diverging association of reduced glomerular filtration rate and albuminuria with coronary and noncoronary events in patients with type 2 diabetes: the renal insufficiency and cardiovascular events (RIACE) Italian multicenter study. Diabetes Care. 2012;35(1):143–9. doi: 10.2337/dc11-1380. - DOI - PMC - PubMed
    1. Voigt M, Schmidt S, Lehmann T, Köhler B, Kloos C, Voigt UA, et al. Prevalence and progression rate of diabetic retinopathy in type 2 diabetes patients in correlation with the duration of diabetes. Exp Clin Endocrinol Diabetes. 2018;126(9):570–6. doi: 10.1055/s-0043-120570. - DOI - PubMed

Publication types

Substances

Associated data