

Determinants of province-based health service utilization according to Andersen' s Behavioral Model: a population-based spatial panel modeling study
- PMID: 37237347
- PMCID: PMC10224305
- DOI: 10.1186/s12889-023-15885-4
Determinants of province-based health service utilization according to Andersen' s Behavioral Model: a population-based spatial panel modeling study
Abstract
Objective: The Andersen' s Behavioral Model was used to explore the impact of various factors on the utilization of health services. The purpose of this study is to establish a provincial-level proxy framework for the utilization of health services from a spatial perspective, based on the influencing factors of the Andersen' s Behavioral Model.
Method: Provincial-level health service utilization was estimated by the annual hospitalization rate of residents and the average number of outpatient visits per year from China Statistical Yearbook 2010-2021. Exploring the relevant influencing factors of health service utilization using the spatial panel Durbin model. Spatial spillover effects were introduced to interpret the direct and indirect effects influenced by the proxy framework for predisposing, enabling, and need factors on health services utilization.
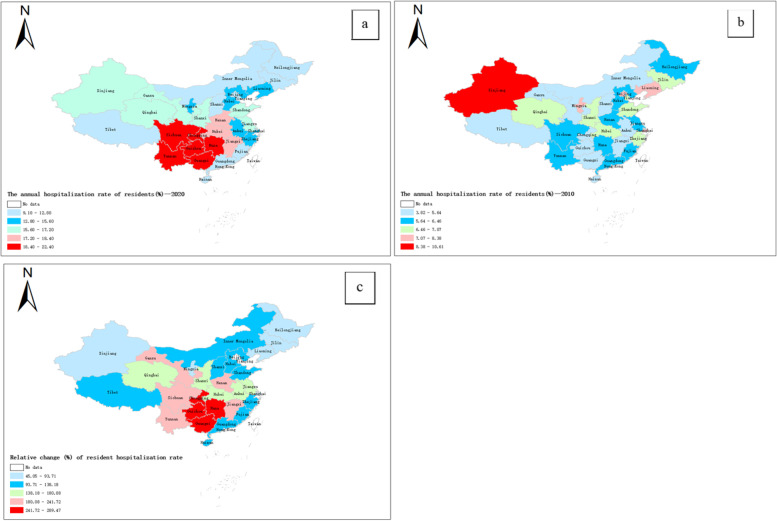
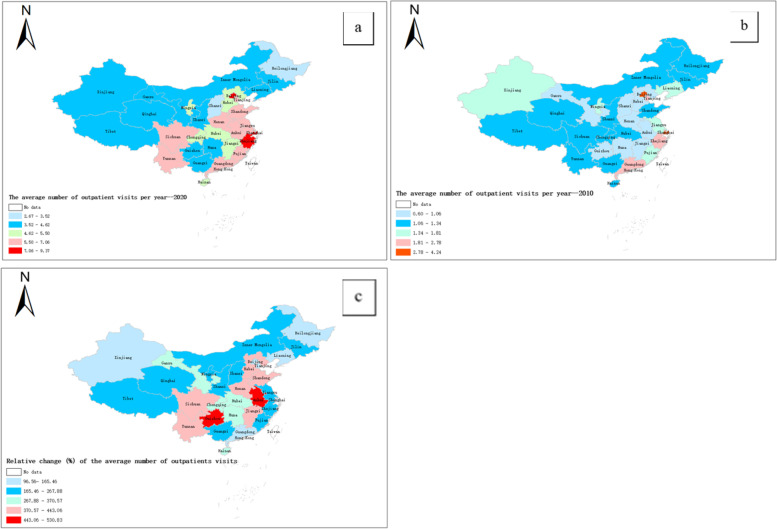
Results: From 2010 - 2020, the resident hospitalization rate increased from 6.39% ± 1.23% to 15.57% ± 2.61%, and the average number of outpatient visits per year increased from 1.53 ± 0.86 to 5.30 ± 1.54 in China. For different provinces, the utilization of health services is uneven. The results of the Durbin model show that locally influencing factors were statistically significantly related to an increase in the resident hospitalization rate, including the proportion of 65-year-olds, GDP per capita, percentage of medical insurance participants, and health resources index, while statistically related to the average number of outpatient visits per year, including the illiteracy rate and GDP per capita. Direct and indirect effects decomposition of resident hospitalization rate associated influencing factors demonstrated that proportion of 65-year-olds, GDP per capita, percentage of medical insurance participants, and health resources index not only affected local resident hospitalization rate but also exerted spatial spillover effects toward geographical neighbors. The illiteracy rate and GDP per capita have significant local and neighbor impacts on the average number of outpatient visits.
Conclusion: Health services utilization was a variable varied by region and should be considered in a geographic context with spatial attributes. From the spatial perspective, this study identified the local and neighbor impacts of predisposing factors, enabling factors, and need factors that contributed to disparities in local health services utilization.
Keywords: Andersen’ s Behavioral Model; China; Geography; Health Service Utilization; Spatial spillover effects.
© 2023. The Author(s).
Conflict of interest statement
The authors declare no competing interests.
Figures


References
-
- World Health Organization. Health Equity. Available online: https://www.who.int/health-topics/health-equity#tab=tab_1
-
- Durey R. The Power of Human Rights for Women’s Health. Health Issues. 2009;(101):21–3. https://search.informit.org/doi/10.3316/informit.655756825293987. - DOI
Publication types
MeSH terms
LinkOut - more resources
Full Text Sources
