

The neutrophil to lymphocyte ratio (NLR) positively correlates with the presence and severity of metabolic syndrome in obese adults, but not in obese children/adolescents
- PMID: 37237368
- PMCID: PMC10224327
- DOI: 10.1186/s12902-023-01369-4
The neutrophil to lymphocyte ratio (NLR) positively correlates with the presence and severity of metabolic syndrome in obese adults, but not in obese children/adolescents
Abstract
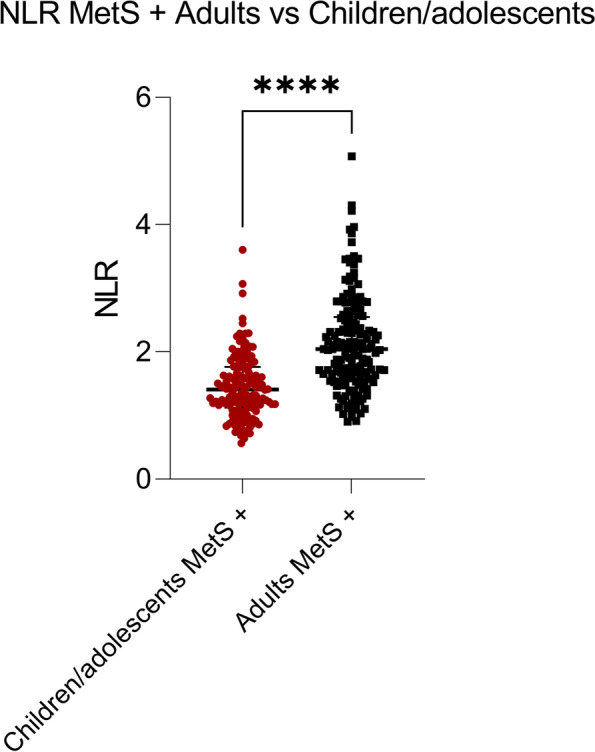
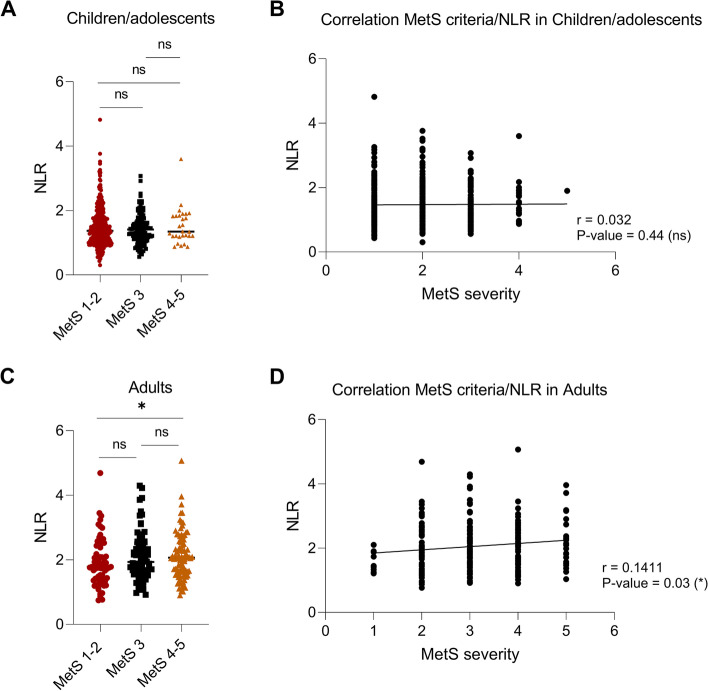
Metabolic syndrome (MetS) associated with obesity is a pathological condition increasing worldwide. Recent studies have demonstrated that the neutrophil to lymphocyte ratio (NLR) can be successfully used to stage MetS in obese adults. The aim of the study was to evaluate NLR values in 552 children/adolescents (M 219, F 333; 14.8 [12.9-16.3] years) and 231 adults (M 88, F 143; 52.3 [36.4-63.3] years) with morbid obesity, subdivided into subgroups according with the presence or absence of MetS. Adult patients with obesity showed a higher prevalence of MetS compared to the pediatric population (71% vs 26%), associated with a greater number of subjects with 3 and 4-5 altered components for MetS. NLR was higher (P-value = 0.041) in adults with MetS compared with those without. NLR values also positively correlated with the severity grade of the syndrome (P-value = 0.032). By contrast, in pediatric subjects with obesity with MetS, NLR values were comparable with those recorded in subjects without MetS (P-value = 0.861), no correlation being found with MetS severity (P-value = 0.441). Our study confirms the importance of NLR as an inflammatory indicator associated with MetS in adult subjects with severe obesity, while it excludes a similar role in children/adolescents.
Keywords: Adults; Children/adolescents; Metabolic syndrome; Neutrophil to lymphocyte ratio; Obesity.
© 2023. The Author(s).
Conflict of interest statement
The authors declare no competing interests.
Figures

Similar articles
-
Macular Variability in Children and Adolescents with Metabolic Syndrome: A Cross-sectional Study Examining the Associations with Anthropometric Measurements, Metabolic Parameters and Inflammatory Markers.J Clin Res Pediatr Endocrinol. 2020 Mar 19;12(1):63-70. doi: 10.4274/jcrpe.galenos.2019.2019.0082. Epub 2019 Aug 22. J Clin Res Pediatr Endocrinol. 2020. PMID: 31434461 Free PMC article.
-
Elevated Neutrophil-to-Lymphocyte Ratio in Metabolic Syndrome Is Associated with Increased Risk of Colorectal Adenoma.Metab Syndr Relat Disord. 2017 Oct;15(8):393-399. doi: 10.1089/met.2017.0041. Epub 2017 Sep 14. Metab Syndr Relat Disord. 2017. PMID: 28910195
-
The age of the obesity onset is a very important factor for the development of metabolic complications and cardiovascular risk in children and adolescents with severe obesity.Eur J Pediatr. 2024 Sep;183(9):3833-3841. doi: 10.1007/s00431-024-05636-x. Epub 2024 Jun 15. Eur J Pediatr. 2024. PMID: 38877324 Free PMC article.
-
Is the Neutrophil-to-Lymphocyte Ratio an Exceptional Indicator for Metabolic Syndrome Disease and Outcomes?Endocr Pract. 2022 Mar;28(3):342-348. doi: 10.1016/j.eprac.2021.11.083. Epub 2021 Nov 24. Endocr Pract. 2022. PMID: 34838762 Review.
-
Effects of aerobic exercise on obese children with metabolic syndrome: a systematic review and meta-analysis.J Pediatr Endocrinol Metab. 2021 Jul 22;34(9):1069-1079. doi: 10.1515/jpem-2021-0295. Print 2021 Sep 27. J Pediatr Endocrinol Metab. 2021. PMID: 34293838
Cited by
-
Epigenetic and Molecular Alterations in Obesity: Linking CRP and DNA Methylation to Systemic Inflammation.Curr Issues Mol Biol. 2024 Jul 13;46(7):7430-7446. doi: 10.3390/cimb46070441. Curr Issues Mol Biol. 2024. PMID: 39057082 Free PMC article.
-
Insights into the clinical impact of complete blood cell inflammatory markers on body composition variations and fatty liver grading in Iranian adults undergoing bariatric surgery: a retrospective longitudinal study.Ann Med Surg (Lond). 2024 Jul 18;86(9):4990-4998. doi: 10.1097/MS9.0000000000002257. eCollection 2024 Sep. Ann Med Surg (Lond). 2024. PMID: 39239052 Free PMC article.
-
Complete Blood Count (CBC)-Derived Inflammation Indexes Are Useful in Predicting Metabolic Syndrome in Adults with Severe Obesity.J Clin Med. 2024 Feb 27;13(5):1353. doi: 10.3390/jcm13051353. J Clin Med. 2024. PMID: 38592161 Free PMC article.
-
The Role of Paraclinical Investigations in Detecting Inflammation in Children and Adolescents with Obesity and Metabolic Syndrome.Life (Basel). 2024 Sep 23;14(9):1206. doi: 10.3390/life14091206. Life (Basel). 2024. PMID: 39337988 Free PMC article.
-
Neutrophils: tissue and circulating signatures of pediatric non-alcoholic fatty liver disease.Front Cell Dev Biol. 2024 Jan 4;11:1336033. doi: 10.3389/fcell.2023.1336033. eCollection 2023. Front Cell Dev Biol. 2024. PMID: 38239291 Free PMC article. Review.
References
-
- World Health Organisation (WHO). Obesity and Overweight. 2021. Available online: https://www.who.int/news-room/fact-sheets/detail/obesity-and-overweight.
-
- Abarca-Gómez L, Abdeen ZA, Hamid ZA, Abu-Rmeileh NM, Acosta-Cazares B, Acuin C, et al. Worldwide trends in body-mass index, underweight, overweight, and obesity from 1975 to 2016: a pooled analysis of 2416 population-based measurement studies in 128·9 million children, adolescents, and adults. Lancet. 2017;390(10113):2627–2642. doi: 10.1016/S0140-6736(17)32129-3. - DOI - PMC - PubMed
MeSH terms
LinkOut - more resources
Full Text Sources
Medical
