. 2023 May 26;15(1):92.
doi: 10.1186/s13148-023-01506-9.

Histone lysine methyltransferase SMYD3 promotes oral squamous cell carcinoma tumorigenesis via H3K4me3-mediated HMGA2 transcription

Affiliations

Histone lysine methyltransferase SMYD3 promotes oral squamous cell carcinoma tumorigenesis via H3K4me3-mediated HMGA2 transcription

Zongcheng Yang et al. Clin Epigenetics. .

Abstract

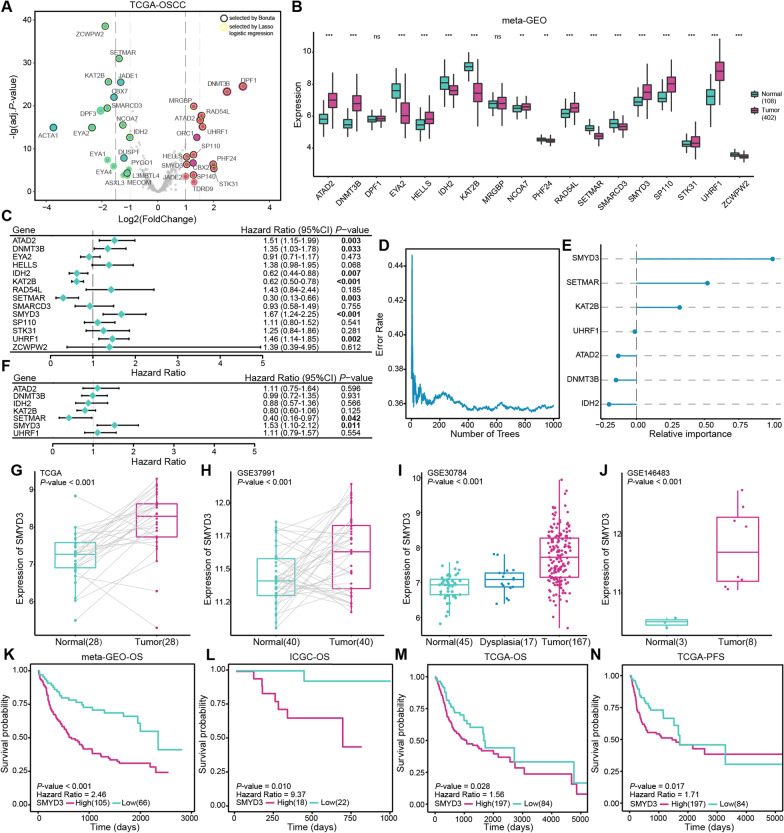
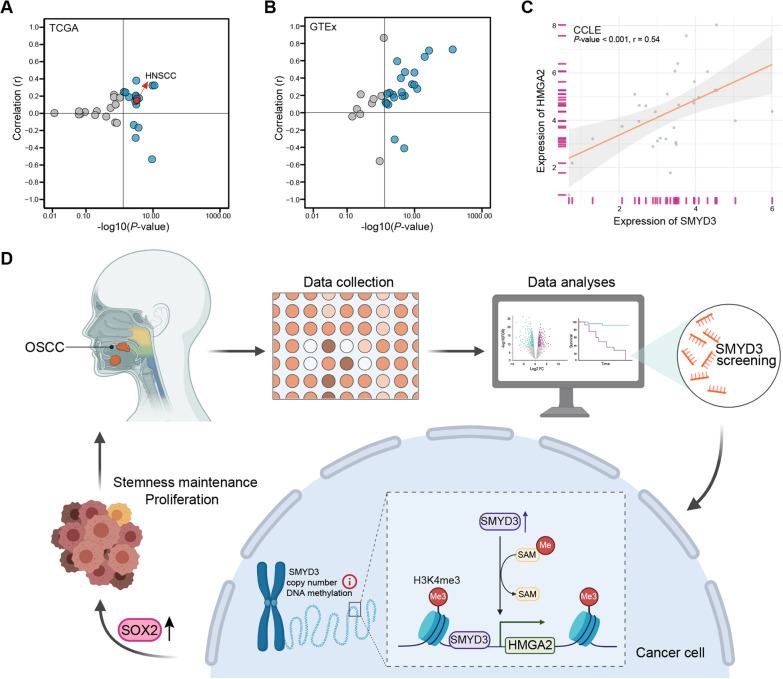
Background: Epigenetic dysregulation is essential to the tumorigenesis of oral squamous cell carcinoma (OSCC). SET and MYND domain-containing protein 3 (SMYD3), a histone lysine methyltransferase, is implicated in gene transcription regulation and tumor development. However, the roles of SMYD3 in OSCC initiation are not fully understood. The present study investigated the biological functions and mechanisms involved in the SMYD3-mediated tumorigenesis of OSCC utilizing bioinformatic approaches and validation assays with the aim of informing the development of targeted therapies for OSCC.

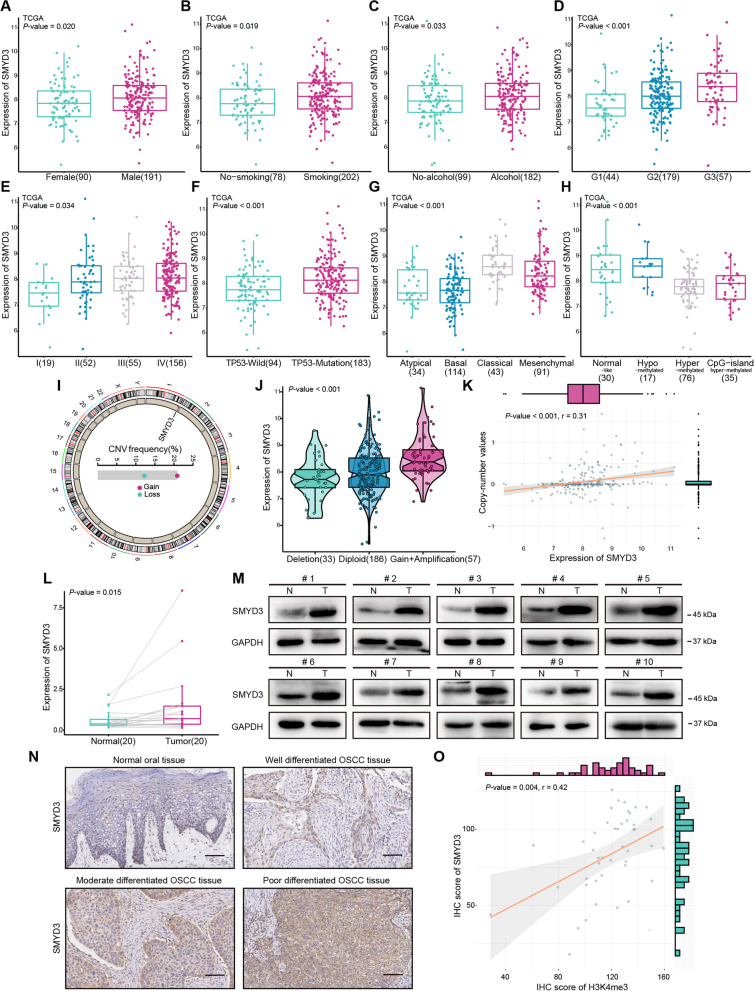
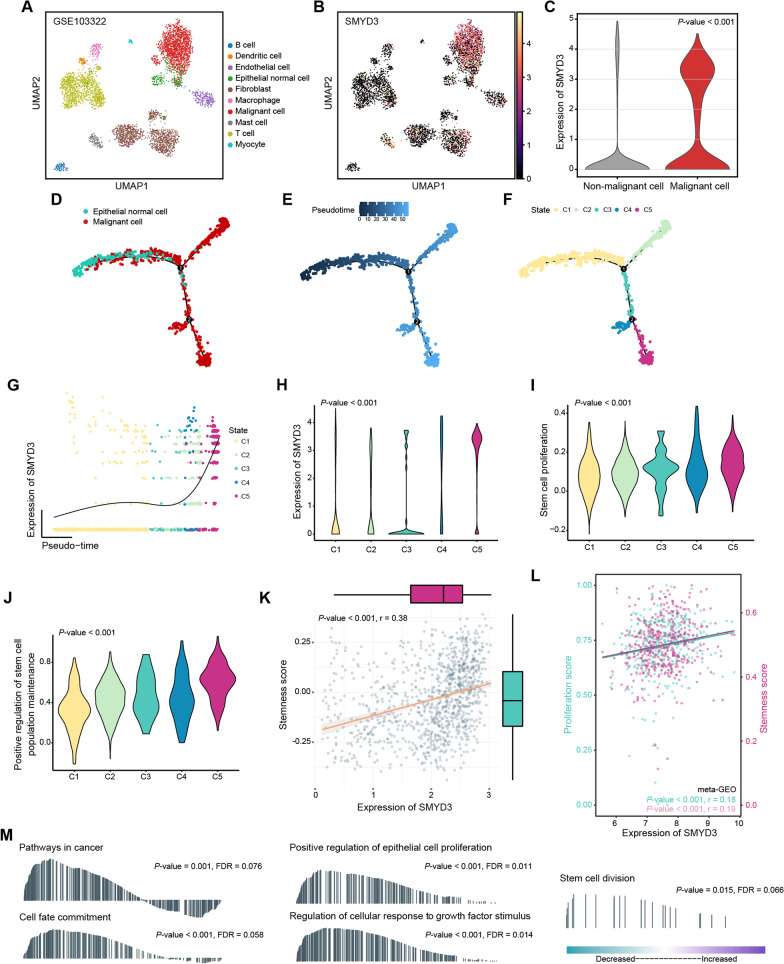
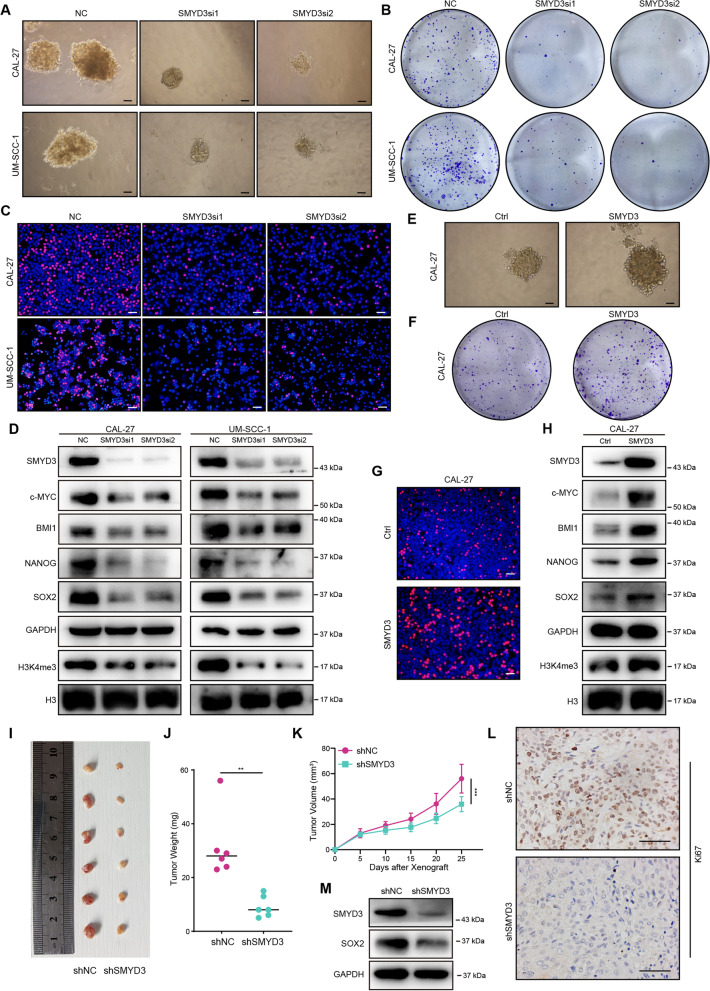
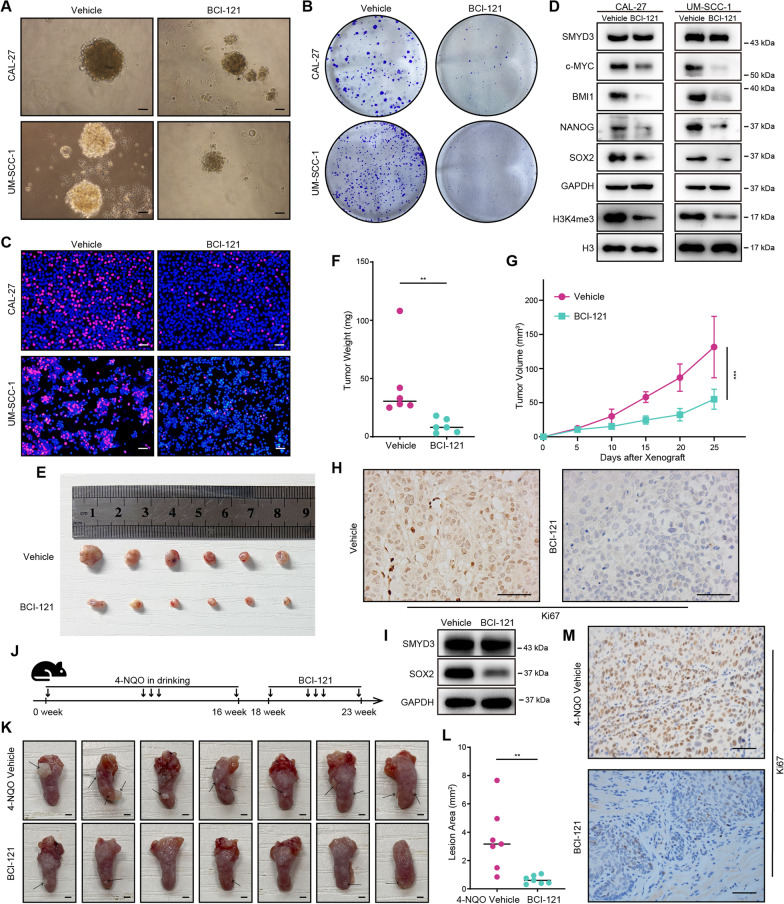
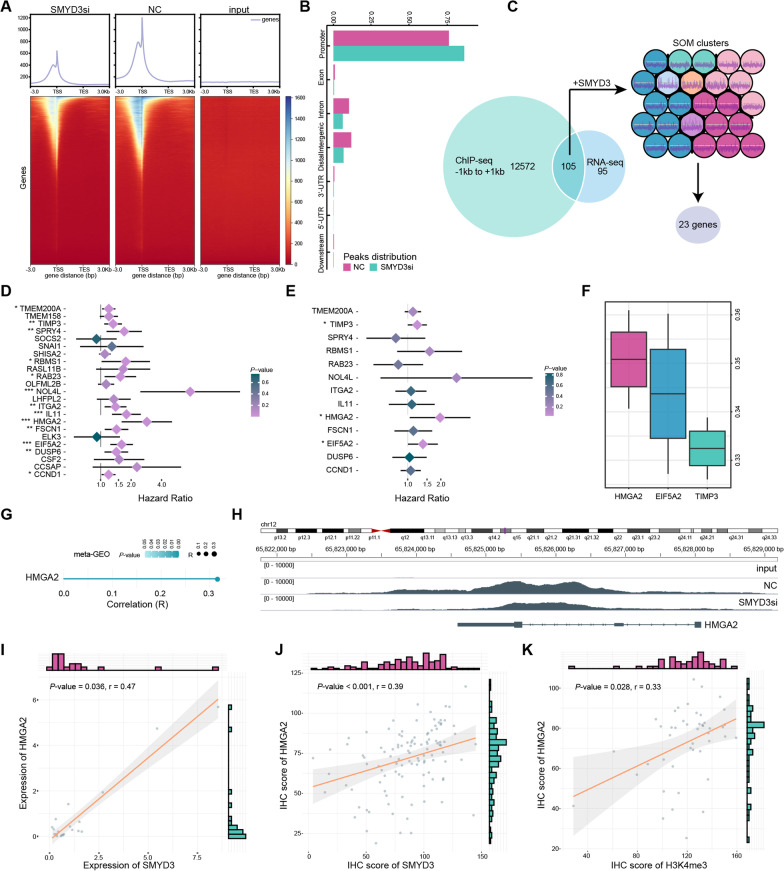
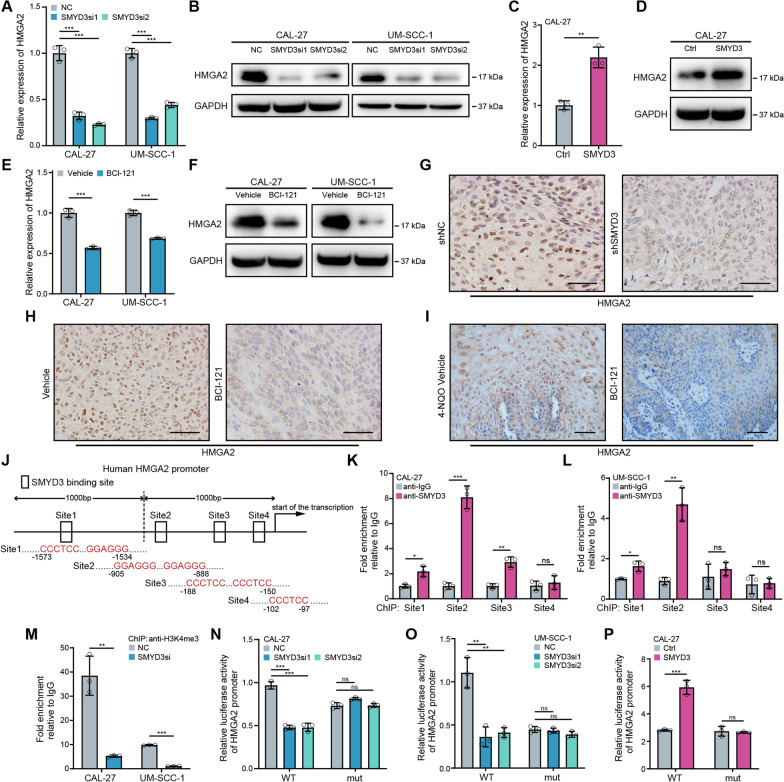
Results: 429 chromatin regulators were screened by a machine learning approach and aberrant expression of SMYD3 was found to be closely associated with OSCC formation and poor prognosis. Data profiling of single-cell and tissue demonstrated that upregulated SMYD3 significantly correlated with aggressive clinicopathological features of OSCC. Alterations in copy number and DNA methylation patterns may contribute to SMYD3 overexpression. Functional experimental results suggested that SMYD3 enhanced cancer cell stemness and proliferation in vitro and tumor growth in vivo. SMYD3 was observed to bind to the High Mobility Group AT-Hook 2 (HMGA2) promoter and elevated tri-methylation of histone H3 lysine 4 at the corresponding site was responsible for transactivating HMGA2. SMYD3 also was positively linked to HMGA2 expression in OSCC samples. Furthermore, treatment with the SMYD3 chemical inhibitor BCI-121 exerted anti-tumor effects.

Conclusions: Histone methyltransferase activity and transcription-potentiating function of SMYD3 were found to be essential for tumorigenesis and the SMYD3-HMGA2 is a potential therapeutic target in OSCC.

Keywords: Epigenetics; HMGA2; Oral squamous cell carcinoma; SMYD3; Tumorigenesis.


Conflict of interest statement

The authors declare no conflict of interest.

Figures

Fig. 1
Fig. 1
Deregulation of chromatin regulators in OSCC. A Volcano plots showing the 34 DEGs between normal (n = 29) and OSCC (n = 281) samples in the TCGA database and clarifying the 19 chromatin regulators were closely related to OSCC tumorigenesis by Lasso logistic regression and Boruta machine learning algorithm. B Differential expression profiles of 14 chromatin regulators in normal (n = 108) and OSCC (n = 402) samples from the meta-GEO dataset (SP140 was not present on the microarray chip). C Univariate Cox regression analyses of the 14 chromatin regulators in the meta-GEO dataset. Hazard Ratio and P-values were displayed. D, E Random survival forest analysis, where the error rate was reduced to a stable value as the number of trees increases, and genes were ranked according to importance. F Multivariate Cox regression analyses of the 7 chromatin regulators in the meta-GEO dataset. Hazard Ratio and P-values were displayed. G–J Boxplot indicating SMYD3 expression in different tissue samples and cell lines from the TCGA database, GSE37991 dataset, GSE30784 dataset and GSE146483 dataset. Numbers in parentheses indicate the sample size. K–N Up-regulation of SMYD3 had a significantly shorter OS time and PFS time in the meta-GEO dataset, ICGC database and TCGA database. Numbers in parentheses indicate the sample size. P-values were obtained from the log-rank tests. Ns, not significant, *P < 0.05, **P ≤ 0.01, and ***P ≤ 0.001
Fig. 2
Fig. 2
SMYD3 is upregulated in OSCC samples. A–H The box plots showed the distribution of SMYD3 expression in subtypes of TCGA-OSCC cohort. Numbers in parentheses indicate the sample size. I The location of CNV of SMYD3 on 23 chromosomes using the TCGA-OSCC cohort. J Deletion, diploid, copy number gain and amplification were involved in the deregulation of SMYD3 expression as analyzed by cBioPortal using TCGA-OSCC data. Numbers in parentheses indicate the sample size. K Correlation between SMYD3 CNV and mRNA expression. L Quantitative result of qRT-PCR of SMYD3 in 20 paired adjacent normal and OSCC tissues. M The protein levels of SMYD3 in 10 pairs of OSCC tissues (T) and adjacent normal tissues (N) measured by Western blotting. N Images of IHC staining for SMYD3 in normal tissues and different histologic grades of OSCC tissues (n = 131, from Stomatological Hospital of Shandong University and Shanghai Qutdo Biotech Company). Scale bars: 50 μm. O Quantification of SMYD3 IHC staining was correlated with that of H3K4me3 IHC staining in OSCC samples (n = 45, from Shanghai Qutdo Biotech Company)
Fig. 3
Fig. 3
SMYD3 is overexpressed in malignant epithelial cells and correlates with cell stemness in OSCC. A UMAP dimensionality reduction was used to show the distribution and dissimilarity of cell types in GSE103322. B, C SMYD3 is highly expressed in malignant cells. D, E A pseudotime trajectory was plotted to describe the evolution of epithelial cells, and the progression trajectory originated from normal epithelial cells and developed into two main branches. F Epithelial cells including normal and malignant cells were segmented into five clusters defined as C1–C5. G, H In the (dynamic) expression profile of SMYD3 in epithelial cells pseudotime, SMYD3 became highly expressed in C5 group. I, J Violin plots showed the level of “stem cell proliferation” and “positive regulation of stem cell population maintenance” in C1–C5 of epithelial cells. K In malignant cells from single-cell RNA-seq dataset (GSE103322), SMYD3 expression was positively correlated with cell stemness score measured by GSVA. L SMYD3 expression was positively correlated with cell stemness as well as proliferation score measured by ssGSEA in meta-GEO dataset. M The GSEA results of RNA-seq on CAL-27 transfected with NC and SMYD3 siRNA groups
Fig. 4
Fig. 4
SMYD3 facilitates OSCC cell stemness maintenance and proliferation in vitro and tumorigenesis in vivo. A Representative image of NC- or SMYD3 siRNA-transfected CAL-27 and UM-SCC-1 cells in a secondary tumorsphere formation assay. Scale bars: 50 μm. B Representative images of NC- or SMYD3 siRNA-transfected CAL-27 and UM-SCC-1 cells in a colony formation assay. C Representative images of NC- or SMYD3 siRNA-transfected CAL-27 and UM-SCC-1 cells in an EdU staining assay. Scale bars: 50 μm. D Western blotting analyses showing that SMYD3, c-MYC, BMI1, NANOG, SOX2 and H3K4me3 protein expression were decreased in CAL-27 and UM-SCC-1 cells. E Representative images of vector- or SMYD3 plasmid-transfected CAL-27 cells in a secondary tumorsphere formation assay. Scale bars: 50 μm. F Representative images of vector- or SMYD3 plasmid-transfected CAL-27 cells in a colony formation assay. G Representative images of vector- or SMYD3 plasmid-transfected CAL-27 cells in an EdU staining assay. Scale bars: 50 μm. H Western blotting analyses showing that SMYD3, c-MYC, BMI1, NANOG, SOX2 and H3K4me3 protein expression were elevated in SMYD3 plasmid-transfected CAL-27 cells. I Subcutaneous tumor formation in nude mice of shNC and shSMYD3 groups (n = 6/group). J, K Tumor weight and tumor growth curves in the nude mouse xenograft model. L IHC staining for Ki67 in xenografts (n = 6/group). Scale bars: 50 μm. M Western blotting analyses showing that SOX2 protein expression was reduced in shSMYD3 group than in shNC group in vivo. *P < 0.05, **P ≤ 0.01, and ***P ≤ 0.001
Fig. 5
Fig. 5
Pharmacological inhibition of SMYD3 suppresses OSCC cells growth and impedes the chemical-induced primary OSCC formation. A The ability of secondary tumorsphere formation was significantly reduced in BCI-121-treated OSCC cells relative to cells treated with vehicle. Representative images were shown. Scale bars: 50 μm. B The colony formation potential was inhibited following BCI-121 treatment as compared to vehicle treatment. C The ability of proliferation was suppressed in BCI-121-treated OSCC cells relative to cells treated with vehicle. Representative images were shown. Scale bars: 50 μm. D Western blotting analyses showing that c-MYC, BMI1, NANOG, SOX2 and H3K4me3 protein expression were decreased in BCI-121-treated CAL-27 and UM-SCC-1 cells. E Subcutaneous tumor formation in nude mice of BCI-121 treatment and vehicle groups (n = 6/group). F, G Tumor weight and tumor growth curves in the nude mouse xenograft model. H IHC staining for Ki67 in xenografts (n = 6/group). Scale bars: 50 μm. I Western blotting analyses showing that SOX2 protein expression was decreased in BCI-121 group than in vehicle group in vivo. J Experimental design of 4NQO-induced OSCC animal model and BCI-121 treatment. K Representative images of tongue lesions at 23 weeks after treatment (n = 7/group). Scale bars: 1.5 mm. L Quantification of lesion areas visible in the tongue from BCI-121 treatment and vehicle groups. M IHC staining for Ki67 in OSCC tissues (n = 7/group). Scale bars: 50 μm. *P < 0.05, **P ≤ 0.01, and ***P ≤ 0.001
Fig. 6
Fig. 6
HMGA2 is a key downstream effector for SMYD3-mediated functions. A, B Binding peak signal distribution locations in ChIP-seq. C Flow chart for screening 23 downstream target genes. D, E Univariate and multivariate Cox regression analyses of the 23 genes in the meta-GEO dataset. Hazard Ratio and P-values were displayed. F The distributions of functional similarities of three proteins were summarized as boxplots. G SMYD3 was co-expressed with HMGA2 in the meta-GEO dataset. H The variation of H3K4me3 binding peaks was mainly at the promoter regions (− 1 kb to the TSS) of HMGA2. I Quantification of qRT-PCR of SMYD3 was correlated with that of HMGA2 in collected 20 OSCC samples. J Quantification of SMYD3 IHC staining was correlated with that of HMGA2 IHC staining in OSCC samples (n = 131, from Stomatological Hospital of Shandong University and Shanghai Qutdo Biotech Company). K Quantification of HMGA2 IHC staining was correlated with that of H3K4me3 IHC staining in OSCC samples (n = 45, from Shanghai Qutdo Biotech Company)
Fig. 7
Fig. 7
SMYD3 enhances HMGA2 transcription by binding to the HMGA2 promoter and increasing H3K4me3 modification. A, B The mRNA and protein levels of HMGA2 in CAL-27 and UM-SCC-1 cells transfected with SMYD3 siRNA. C, D The mRNA and protein levels of HMGA2 in CAL-27 and UM-SCC-1 cells transfected with SMYD3 plasmid. E, F The mRNA and protein levels of HMGA2 in CAL-27 and UM-SCC-1 cells following BCI-121 treatment. G HMGA2 expression was significantly decreased in the shSMYD3 group than in the shNC group of xenografts (n = 6/group). Scale bars: 50 μm. H HMGA2 expression was significantly reduced in the BCI-121 treatment group than in the vehicle group of xenografts (n = 6/group). Scale bars: 50 μm. I HMGA2 expression was significantly reduced in the BCI-121 treatment group than in the vehicle group of 4NQO-induced OSCC tissues (n = 7/group). Scale bars: 50 μm. J The SMYD3 potential binding sites in human HMGA2 promoter. K, L ChIP assays were performed to identify occupancy of the HMGA2 promoter in OSCC cells using SMYD3 antibodies. M Enrichment of H3K4me3 on the Site2 fragment of HMGA2 promoter. NP Transcriptional activity of SMYD3 was assessed using a luciferase reporter system in OSCC cells. Ns, not significant, *P < 0.05, **P ≤ 0.01, and ***P ≤ 0.001
Fig. 8
Fig. 8
The regulatory association of SMYD3 with HMGA2 could be universal. A In the TCGA pan-cancer dataset, SMYD3 was positively correlated with HMGA2 expression in most tumor tissues. B In the GTEx database, SMYD3 was positively correlated with HMGA2 expression in most normal tissues. C In the CCLE database, SMYD3 was positively correlated with HMGA2 expression in most upper respiratory gastrointestinal tract tumor cell lines. D Graphical abstract for SMYD3 promoting tumorigenesis of OSCC

Similar articles

Cited by

References

    1. Gu W, Kim M, Wang L, Yang Z, Nakajima T, Tsushima Y. Multi-omics analysis of ferroptosis regulation patterns and characterization of tumor microenvironment in patients with oral squamous cell carcinoma. Int J Biol Sci. 2021;17:3476–3492. doi: 10.7150/ijbs.61441. - DOI - PMC - PubMed
    1. Yang Z, Liang X, Fu Y, Liu Y, Zheng L, Liu F, et al. Identification of AUNIP as a candidate diagnostic and prognostic biomarker for oral squamous cell carcinoma. EBioMedicine. 2019;47:44–57. doi: 10.1016/j.ebiom.2019.08.013. - DOI - PMC - PubMed
    1. Johnson DE, Burtness B, Leemans CR, Lui VWY, Bauman JE, Grandis JR. Head and neck squamous cell carcinoma. Nat Rev Dis Primers. 2020;6:92. doi: 10.1038/s41572-020-00224-3. - DOI - PMC - PubMed
    1. Osazuwa-Peters N, Simpson MC, Zhao L, Boakye EA, Olomukoro SI, Deshields T, et al. Suicide risk among cancer survivors: head and neck versus other cancers. Cancer. 2018;124:4072–4079. doi: 10.1002/cncr.31675. - DOI - PubMed
    1. Yang Z, Yan G, Zheng L, Gu W, Liu F, Chen W, et al. YKT6, as a potential predictor of prognosis and immunotherapy response for oral squamous cell carcinoma, is related to cell invasion, metastasis, and CD8+ T cell infiltration. Oncoimmunology. 2021;10:1938890. doi: 10.1080/2162402X.2021.1938890. - DOI - PMC - PubMed

Publication types

MeSH terms