. 2023 Apr 28;12(5):1020.
doi: 10.3390/antiox12051020.

Distinct Roles of CK2- and AKT-Mediated NF-κB Phosphorylations in Clasmatodendrosis (Autophagic Astroglial Death) within the Hippocampus of Chronic Epilepsy Rats

Affiliations

Distinct Roles of CK2- and AKT-Mediated NF-κB Phosphorylations in Clasmatodendrosis (Autophagic Astroglial Death) within the Hippocampus of Chronic Epilepsy Rats

Ji-Eun Kim et al. Antioxidants (Basel). .

Abstract

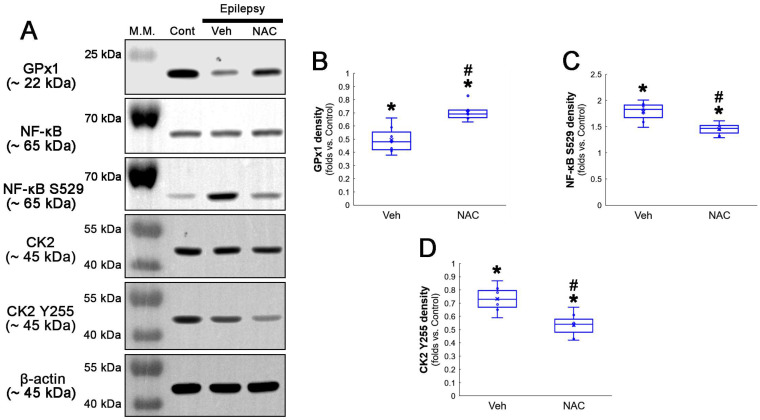
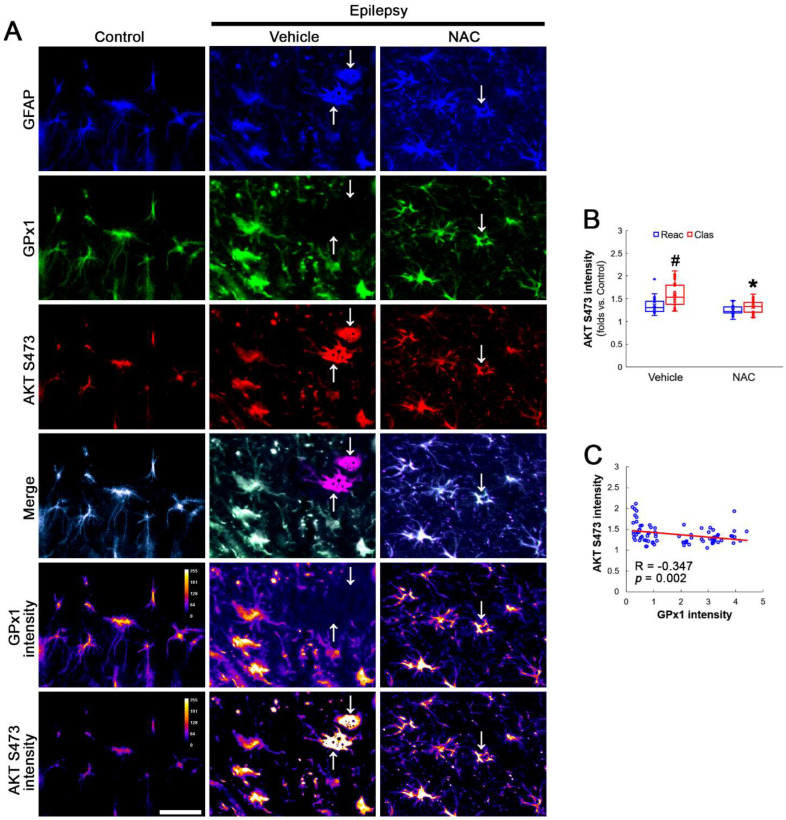
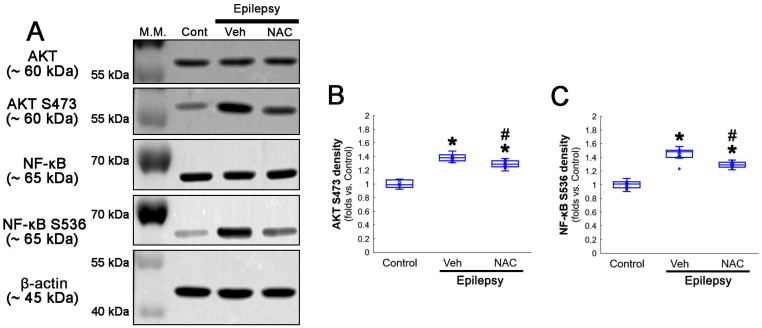
The downregulation of glutathione peroxidase-1 (GPx1) plays a role in clasmatodendrosis (an autophagic astroglial death) in the hippocampus of chronic epilepsy rats. Furthermore, N-acetylcysteine (NAC, a GSH precursor) restores GPx1 expression in clasmatodendritic astrocytes and alleviates this autophagic astroglial death, independent of nuclear factor erythroid-2-related factor 2 (Nrf2) activity. However, the regulatory signal pathways of these phenomena have not been fully explored. In the present study, NAC attenuated clasmatodendrosis by alleviating GPx1 downregulation, casein kinase 2 (CK2)-mediated nuclear factor-κB (NF-κB) serine (S) 529 and AKT-mediated NF-κB S536 phosphorylations. 2-[4,5,6,7-Tetrabromo-2-(dimethylamino)-1H-benzo[d]imidazole-1-yl]acetic acid (TMCB; a selective CK2 inhibitor) relieved clasmatodendritic degeneration and GPx1 downregulation concomitant with the decreased NF-κB S529 and AKT S473 phosphorylations. In contrast, AKT inhibition by 3-chloroacetyl-indole (3CAI) ameliorated clasmatodendrosis and NF-κB S536 phosphorylation, while it did not affect GPx1 downregulation and CK2 tyrosine (Y) 255 and NF-κB S529 phosphorylations. Therefore, these findings suggest that seizure-induced oxidative stress may diminish GPx1 expression by increasing CK2-mediated NF-κB S529 phosphorylation, which would subsequently enhance AKT-mediated NF-κB S536 phosphorylation leading to autophagic astroglial degeneration.

Keywords: 3CAI; GPx1; NAC; TMCB; astrocyte; autophagy; oxidative stress; seizure.


Conflict of interest statement

The authors declare no conflict of interest.

Figures

Figure 1
Figure 1
Effects of NAC on GPx1 expression and NF-κB S529 phosphorylation in CA1 astrocytes. Compared to control rats, GPx1 expression is increased in reactive CA1 astrocytes (Reac), while it is reduced in clasmatodendritic (vacuolized) CA1 astrocytes (Clas, arrows). However, the NF-κB S529 signal is enhanced only in clasmatodendritic CA1 astrocytes. CK2 Y255 phosphorylation is diminished in the whole hippocampus of chronic epilepsy rats. Compared to the vehicle (Veh), NAC ameliorates GPx1 downregulation and NF-κB S529 phosphorylation in clasmatodendritic astrocytes, accompanied by the reduced CK2 Y255 phosphorylation. (A) Representative photos of GPx1 expression, NF-κB S529 signal and their intensities. Bar = 25 μm. (B) Quantification of clasmatodendritic degeneration in CA1 astrocytes (* p < 0.05 vs. vehicle, n = 7 rats, respectively; Mann–Whitney test). (C,D) Quantification of GPx1 and NF-κB S529 intensities in CA1 astrocytes (*,# p < 0.05 vs. vehicle and reactive astrocytes, respectively, n = 20 cells in 7 rats, respectively; Kruskal–Wallis test with Dunn–Bonferroni post hoc test). (E) Linear regression analysis between GPx1 and NF-κB S529 intensities in reactive and clasmatodendritic CA1 astrocytes of chronic epilepsy rats (n = 80 cells in 14 rats; Spearman test).
Figure 2
Figure 2
Western blot data representing the effects of NAC on GPx1 expression, NF-κB S529, and CK2 Y255 phosphorylations. Consistent with the immunofluorescent study (Figure 1), NAC increases GPx1 expression, but diminishes NF-κB S529 phosphorylation level, as compared to the vehicle (Veh). In addition, CK2 Y255 phosphorylation is decreased in the whole hippocampus of chronic epilepsy rats, which is further reduced by NAC. (A) Representative Western blot of GPx1, NF-κB, NF-κB S529, CK2 and CK2 Y255 levels. (BD) Quantification of GPx1, NF-κB S529 and CK2 Y255 phosphorylation levels based on Western blot data (*,# p < 0.05 vs. control rats and vehicle-treated epilepsy rats, n = 7 rats, respectively; Kruskal–Wallis test with Dunn–Bonferroni post hoc test).
Figure 3
Figure 3
Effects of NAC on GPx1 expression and AKT S473 phosphorylation in CA1 astrocytes. Compared to control rats, AKT S473 phosphorylation is enhanced in clasmatodendritic (vacuolized) CA1 astrocytes (Clas, arrows) more than reactive CA1 astrocytes (Reac), which is attenuated by NAC treatment. (A) Representative photos of GPx1 expression, AKT S473 signal and their intensities. Bar = 25 μm. (B) Quantification of AKT S473 intensity in CA1 astrocytes (*,# p < 0.05 vs. vehicle and reactive astrocytes, respectively, n = 20 cells in 7 rats, respectively; Kruskal–Wallis test with Dunn–Bonferroni post hoc test). (C) Linear regression analysis between GPx1 and AKT S473 intensities in reactive and clasmatodendritic CA1 astrocytes of chronic epilepsy rats (n = 80 cells in 14 rats; Spearman test).
Figure 4
Figure 4
Effects of NAC on GPx1 expression and NF-κB S536 phosphorylation in CA1 astrocytes. Compared to control rats, NF-κB S536 signal is increased in clasmatodendritic (vacuolized) CA1 astrocytes (Clas, arrows), but not reactive CA1 astrocytes (Reac), which is attenuated by NAC treatment. (A) Representative photos of GPx1 expression, NF-κB S536 signal and their intensities. Bar = 25 μm. (B) Quantification of NF-κB S536 intensity in CA1 astrocytes (*,# p < 0.05 vs. vehicle and reactive astrocytes, respectively, n = 20 cells in 7 rats, respectively; Kruskal–Wallis test with Dunn–Bonferroni post hoc test). (C) Linear regression analysis between GPx1 and NF-κB S536 intensities in reactive and clasmatodendritic CA1 astrocytes of chronic epilepsy rats (n = 80 cells in 14 rats; Spearman test).
Figure 5
Figure 5
Western blot data representing the effects of NAC on AKT S473 and NF-κB S536 phosphorylations. Consistent with immunofluorescent study (Figure 3 and Figure 4), NAC diminishes AKT S473 and NF-κB S536 phosphorylation levels, as compared to the vehicle (Veh). (A) Representative Western blot of AKT, AKT S473, NF-κB and NF-κB S536 levels. (B,C) Quantification of AKT S473 and NF-κB S536 phosphorylation levels based on Western blot data (*,# p < 0.05 vs. control animals and vehicle-treated epilepsy rats, respectively, n = 7 rats, respectively; Kruskal–Wallis test with Dunn–Bonferroni post hoc test).
Figure 6
Figure 6
Effects of TMCB on GPx1 expression and NF-κB S529 phosphorylation in CA1 astrocytes. Compared to the vehicle, TMCB attenuates clasmatodendritic degeneration concomitant with the enhanced GPx1 expression and the decreased NF-κB S529 phosphorylation in clasmatodendritic (vacuolized) CA1 astrocytes (Clas, arrows), but not reactive CA1 astrocytes (Reac). (A) Representative photos of GPx1 expression, NF-κB S529 signal and their intensities. Bar = 25 μm. (B) Quantification of clasmatodendritic degeneration in CA1 astrocytes (* p < 0.05 vs. vehicle, n = 7 rats, respectively; Mann–Whitney test). (C,D) Quantification of GPx1 and NF-κB S529 intensities in CA1 astrocytes (*,# p < 0.05 vs. vehicle and reactive astrocytes, respectively, n = 20 cells in 7 rats, respectively; Kruskal–Wallis test with Dunn–Bonferroni post hoc test).
Figure 7
Figure 7
Effects of TMCB on AKT S473 and NF-κB S536 phosphorylations in CA1 astrocytes. Compared to the vehicle, TMCB ameliorates NF-κB S536, but not AKT S473, phosphorylation in clasmatodendritic (vacuolized) CA1 astrocytes (Clas, arrows), but not reactive CA1 astrocytes (Reac). (A) Representative photos of AKT S473 phosphorylation and its intensities. Bar = 25 μm. (B,C) Quantification of AKT S473 and NF-κB S536 intensity in CA1 astrocytes (*,# p < 0.05 vs. vehicle and reactive astrocytes, respectively, n = 20 cells in 7 rats, respectively; Kruskal–Wallis test with Dunn–Bonferroni post hoc test). (D) Representative photos of NF-κB S536 phosphorylation and its intensities. Bar = 25 μm.
Figure 8
Figure 8
Western blot data representing the effects of TMCB on GPx1 expression, AKT S473, NF-κB S529 and NF-κB S536 phosphorylations. Consistent with immunofluorescent study (Figure 6 and Figure 7), TMCB increases GPx1 expression, but reduces AKT S473, NF-κB S529 and NF-κB S536 phosphorylation levels, as compared to the vehicle (Veh). (A) Representative Western blot of GPx1, AKT, AKT S473, NF-κB, NF-κB S529 and NF-κB S536 levels. (BE) Quantification of GPx1 expression, AKT S473, NF-κB S529 and NF-κB S536 phosphorylation levels based on Western blot data (*,# p < 0.05 vs. control rats and vehicle-treated epilepsy rats, respectively, n = 7 rats, respectively; Kruskal–Wallis test with Dunn–Bonferroni post hoc test).
Figure 9
Figure 9
Effects of 3CAI on GPx1 expression and NF-κB S536 phosphorylation in CA1 astrocytes. Compared to the vehicle, 3CAI attenuates clasmatodendritic degeneration concomitant and the increased NF-κB S536 phosphorylation in clasmatodendritic (vacuolized) CA1 astrocytes (Clas, arrows), but not reactive CA1 astrocytes (Reac), while it does not affect GPx1 expression level. (A) Representative photos of GPx1 expression and NF-κB S536 signal and their intensities. Bar = 25 μm. (B) Quantification of clasmatodendritic degeneration in CA1 astrocytes (* p < 0.05 vs. vehicle, n = 7 rats, respectively; Mann–Whitney test). (C,D) Quantification of GPx1 and NF-κB S536 intensities in CA1 astrocytes (*,# p < 0.05 vs. vehicle and reactive astrocytes, respectively, n = 20 cells in 7 rats, respectively; Kruskal–Wallis test with Dunn–Bonferroni post hoc test).
Figure 10
Figure 10
Effects of 3CAI on NF-κB S529 and CK2 Y255 phosphorylations in CA1 astrocytes. Compared to the vehicle, 3CAI does not influence NF-κB S529 in clasmatodendritic (vacuolized) CA1 astrocytes (Clas, arrows) and reactive CA1 astrocytes (Reac). CK2 Y255 phosphorylation in the whole hippocampus is also unaffected by 3CAI treatment. (A) Representative photos of the NF-κB S529 signal and its intensities. Bar = 25 μm. (B) Quantification of NF-κB S529 intensity in CA1 astrocytes (# p < 0.05 vs. reactive astrocytes, n = 20 cells in 7 rats, respectively; Kruskal–Wallis test with Dunn–Bonferroni post hoc test).
Figure 11
Figure 11
Western blot data representing the effects of 3CAI on GPx1 expression, NF-κB S529, NF-κB S536 and CK2 Y255 phosphorylations. Consistent with the immunofluorescent study (Figure 9 and Figure 10), 3CAI reduces only the NF-κB S536 phosphorylation level without affecting GPx1 expression, NF-κB S529 and CK2 Y255 phosphorylations, as compared to the vehicle (Veh). (A) Representative Western blot of GPx1, NF-κB, NF-κB S529, NF-κB S536, CK2 and CK2 Y255 levels. (BE) Quantification of GPx1 expression, AKT S473, NF-κB S529 and NF-κB S536 phosphorylation levels based on Western blot data (*,# p < 0.05 vs. control rats and vehicle-treated epilepsy rat, respectively, n = 7 rats, respectively; Kruskal–Wallis test with Dunn–Bonferroni post hoc test).
Figure 12
Figure 12
Schematic depiction representing the distinct role of NF-κB phosphorylation in clasmatodendritic CA1 astrocytes based on the present data and previous reports. Seizure activity decreases the GSH level and subsequently increases the ROS level. Aberrant CK2-mediated NF-κB S529 phosphorylation participates in GPx1 downregulation, which abolishes the GPx1-mediated inhibition of NF-κB S536 phosphorylation induced by AKT hyperactivation. In turn, the enhanced NF-κB S536 phosphorylation is involved in clasmatodendritic degeneration concomitant with AKT-mediated Bif-1 activation.

References

    1. Thorburn A. Apoptosis and autophagy: Regulatory connections between two supposedly different processes. Apoptosis. 2008;13:1–9. doi: 10.1007/s10495-007-0154-9. - DOI - PMC - PubMed
    1. Ryu H.J., Kim J.E., Yeo S.I., Kang T.-C. p65/RelA-Ser529 NF-κB subunit phosphorylation induces autophagic astroglial death (Clasmatodendrosis) following status epilepticus. Cell. Mol. Neurobiol. 2011;31:1071–1078. doi: 10.1007/s10571-011-9706-1. - DOI - PMC - PubMed
    1. Ryu H.J., Kim J.E., Yeo S.I., Kim D.W., Kwon O.S., Choi S.Y., Kang T.C. F-actin depolymerization accelerates clasmatodendrosis via activation of lysosome-derived autophagic astroglial death. Brain Res. Bull. 2011;85:368–373. doi: 10.1016/j.brainresbull.2011.05.007. - DOI - PubMed
    1. Penfield W. Neuroglia and microglia—The interstitial tissue of the central nervous system. In: Cowdry E.V., editor. Special Cytology, the Form and Function of the Cell in Health and Disease. Hoeber; New York, NY, USA: 1928. pp. 1033–1068.
    1. Duchen L.W. General pathology of neurons and neuroglia. In: Adams J.H., Duchen L.W., editors. Greenfield’s Neuropathology. Oxford University Press; New York, NY, USA: 1992. pp. 1–68.

LinkOut - more resources