. 2023 May 21;25(5):823.
doi: 10.3390/e25050823.

Entropy of Financial Time Series Due to the Shock of War

Affiliations

Entropy of Financial Time Series Due to the Shock of War

Ewa A Drzazga-Szczȩśniak et al. Entropy (Basel). .

Abstract

The concept of entropy is not uniquely relevant to the statistical mechanics but, among others, it can play pivotal role in the analysis of a time series, particularly the stock market data. In this area, sudden events are especially interesting as they describe abrupt data changes with potentially long-lasting effects. Here, we investigate the impact of such events on the entropy of financial time series. As a case study, we assume data of the Polish stock market, in the context of its main cumulative index, and discuss it for the finite time periods before and after outbreak of the 2022 Russian invasion of Ukraine. This analysis allows us to validate the entropy-based methodology in assessing changes in the market volatility, as driven by the extreme external factors. We show that some qualitative features of such market variations can be well captured in terms of the entropy. In particular, the discussed measure appears to highlight differences between data of the two considered timeframes in agreement with the character of their empirical distributions, which is not always the case in terms of the conventional standard deviation. Moreover, the entropy of cumulative index averages, qualitatively, the entropies of composing assets, suggesting capability for describing interdependencies between them. The entropy is also found to exhibit signatures of the upcoming extreme events. To this end, the role of recent war in shaping the current economic situation is briefly discussed.

Keywords: data science; econophysics; entropy; information theory; sudden events; time series; volatility; war.


Conflict of interest statement

The authors declare no conflict of interest.

Figures

Figure A1
Figure A1
The daily log-returns for the WIG20 cumulative index before (blue) and after (orange) the beginning of the 2022 Russian invasion of Ukraine. For convenience, the inset presents data in the vicinity of the initial invasion day.
Figure 1
Figure 1
The standard deviation for the WIG20 index and its composing stocks. The first panel is for the constant component companies and the second (third) for the stocks introduced to (removed from) the index at some point. The results are given for the one-year time period before the beginning of the Russian invasion of Ukraine (blue) and after this event (orange). The solid lines correspond to the WIG20 index, whereas closed symbols represent estimates for the component stocks. Dashed lines are the guide for an eye.
Figure 2
Figure 2
The discrete probability density function for the WIG20 index, for the one-year period before (blue) and after (orange) the beginning of the Russian invasion of Ukraine.
Figure 3
Figure 3
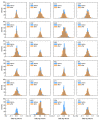
The discrete probability density function for the component stocks of the WIG20 index. The first four rows are for the constant component companies, and the fifth (sixth) row is for the stocks introduced to (removed from) the index at some point. The results are presented for the one-year time period before the beginning of the Russian invasion of Ukraine (blue) and after this event (orange).
Figure 4
Figure 4
The Shannon entropy for the WIG20 index and its composing stocks. The first panel is for the constant component companies and the second (third) for the stocks introduced to (removed from) the index at some point. The results are given for the one-year time period before the beginning of the Russian invasion of Ukraine (blue) and after this event (orange). The solid lines correspond to the WIG20 index, whereas closed symbols represent estimates for the component stocks. Dashed lines are the guide for an eye.
Figure 5
Figure 5
The Shannon entropy for the WIG20 index as calculated for different periods of time before (blue) and after (orange) the beginning of the Russian invasion of Ukraine. Dashed lines are the guide for an eye.

References

    1. He C., Wen Z., Huang K., Ji X. Sudden shock and stock market network structure characteristics: A comparison of past crisis events. Technol. Forecast. Soc. Chang. 2022;180:121732. doi: 10.1016/j.techfore.2022.121732. - DOI
    1. Weinberg D.H., Andrews B.H., Freudenburg J. Equilibrium and sudden events in chemical evolution. Astrophys. J. 2017;837:183. doi: 10.3847/1538-4357/837/2/183. - DOI
    1. Aminikhanghahi S., Cook D. A survey of methods for time series change point detection. Knowl. Inf. Syst. 2017;51:339–367. doi: 10.1007/s10115-016-0987-z. - DOI - PMC - PubMed
    1. Suriani N.S., Hussain A., Zulkifley M.A. Sudden event recognition: A survey. Sensors. 2013;13:9966–9998. doi: 10.3390/s130809966. - DOI - PMC - PubMed
    1. Ramage C. Sudden events. Futures. 1980;12:268–274. doi: 10.1016/0016-3287(80)90076-2. - DOI