. 2023 May 5;11(5):1372.
doi: 10.3390/biomedicines11051372.

Augmenting the Angiogenic Profile and Functionality of Cord Blood Endothelial Colony-Forming Cells by Indirect Priming with Bone-Marrow-Derived Mesenchymal Stromal Cells

Affiliations

Augmenting the Angiogenic Profile and Functionality of Cord Blood Endothelial Colony-Forming Cells by Indirect Priming with Bone-Marrow-Derived Mesenchymal Stromal Cells

Ashutosh Bansal et al. Biomedicines. .

Abstract

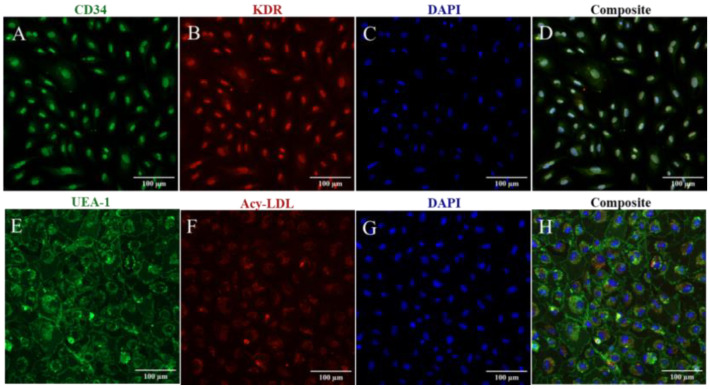
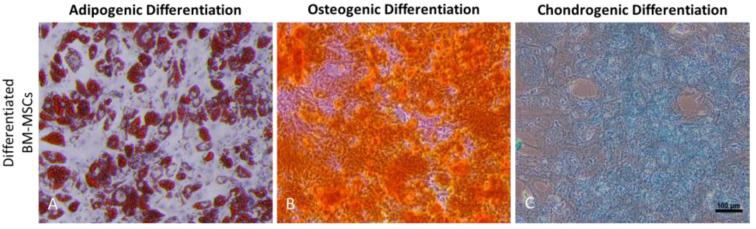
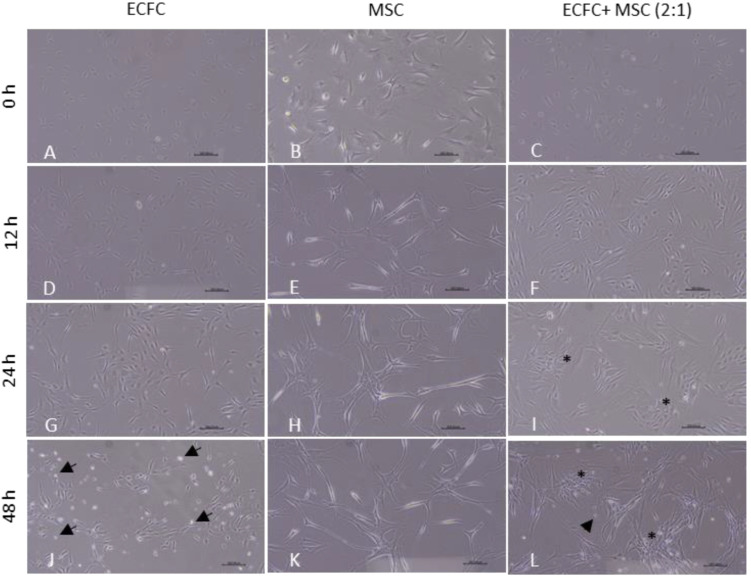
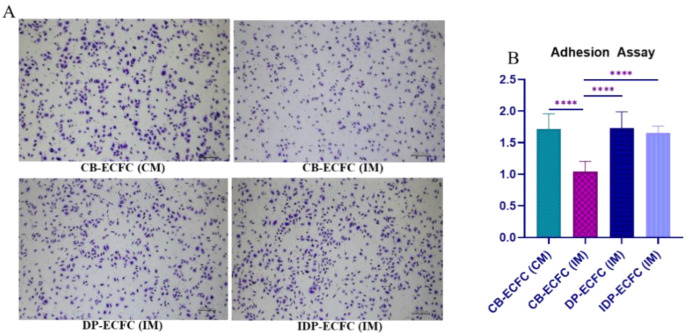
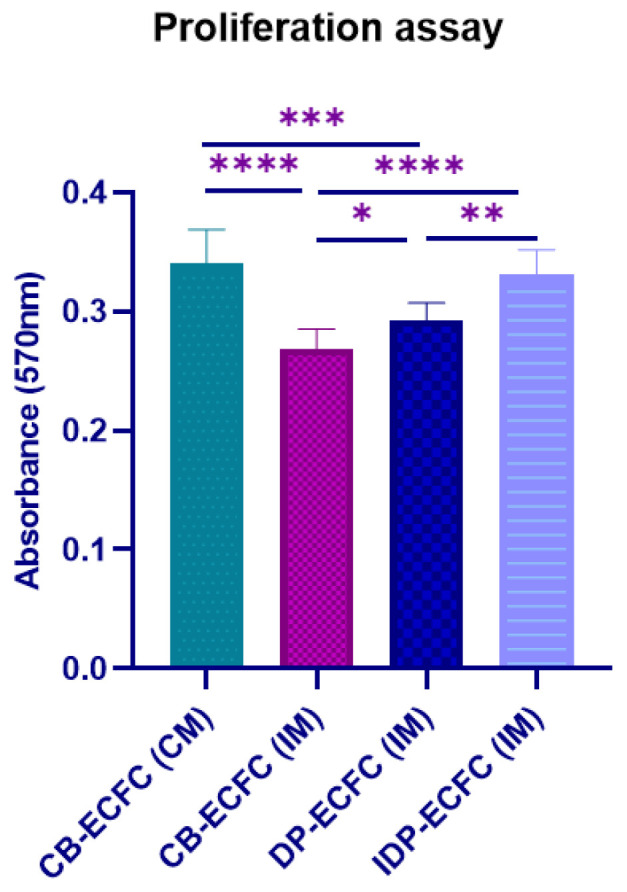
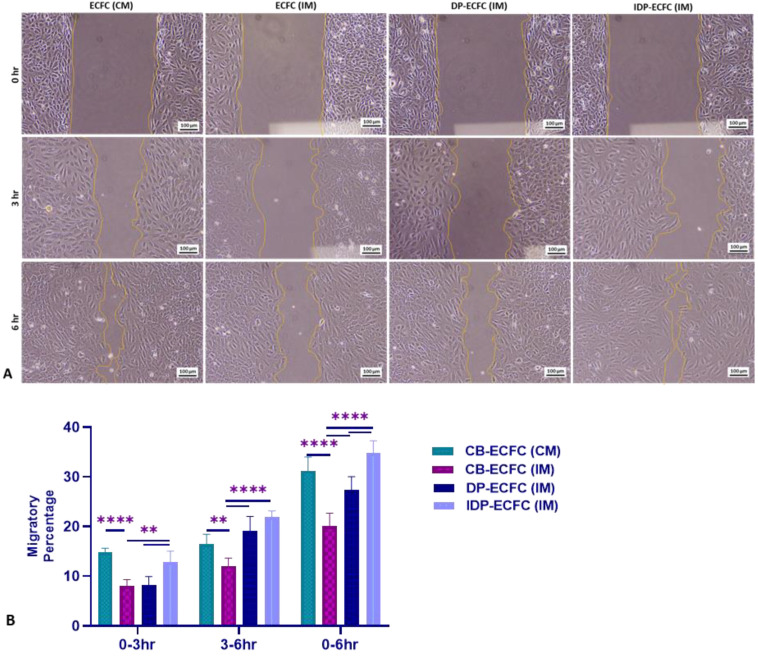
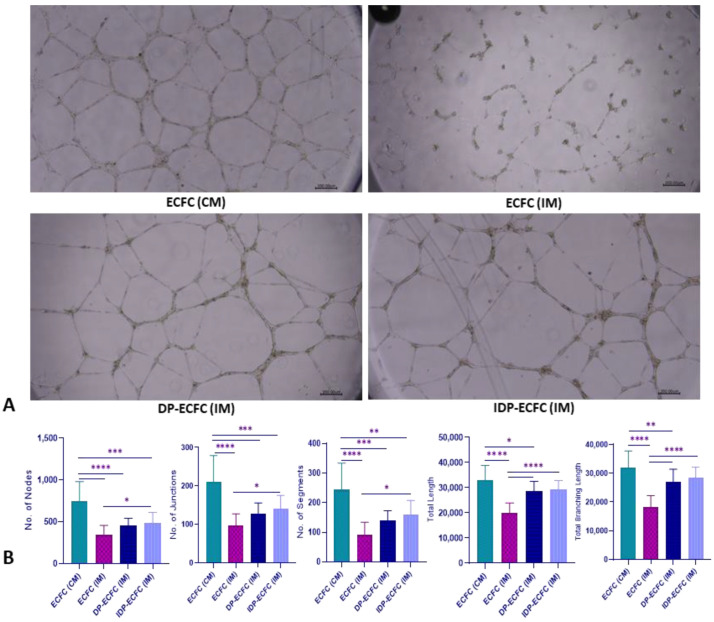
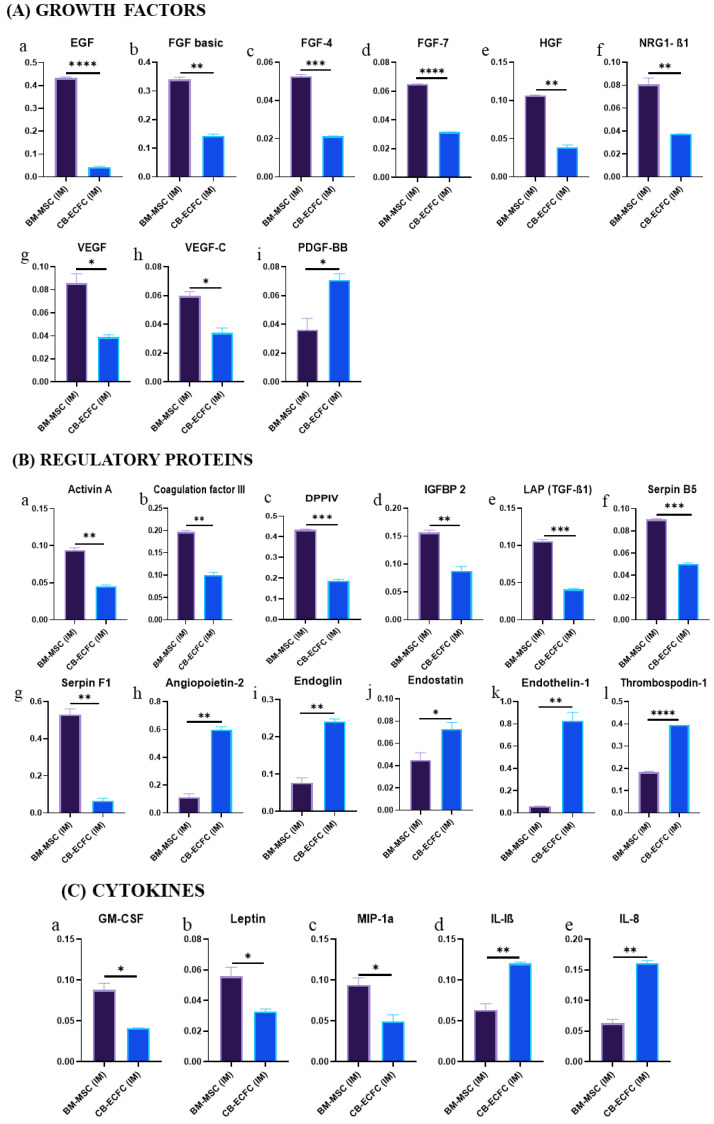
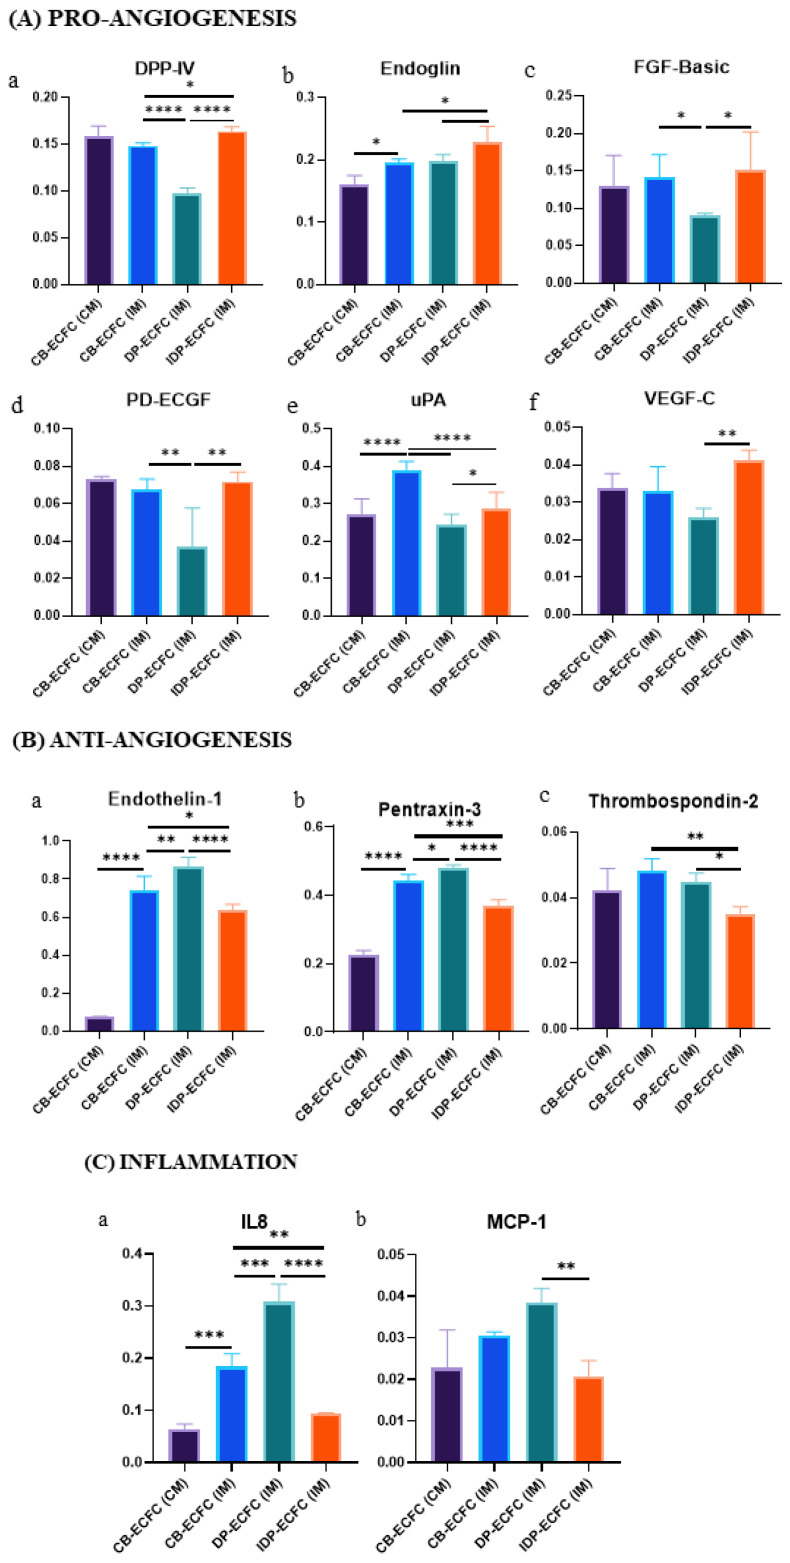
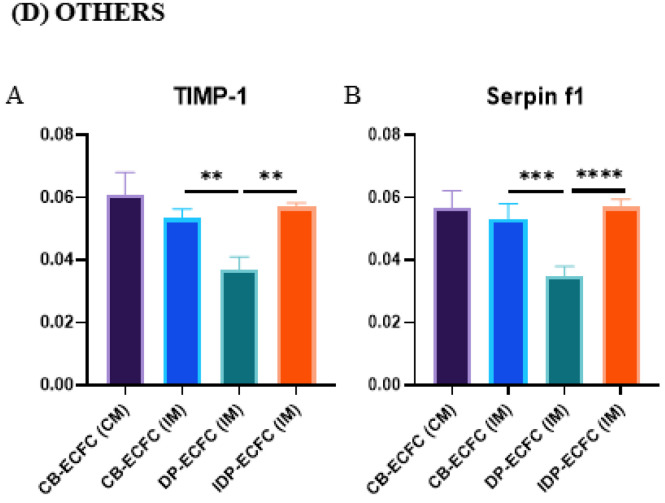
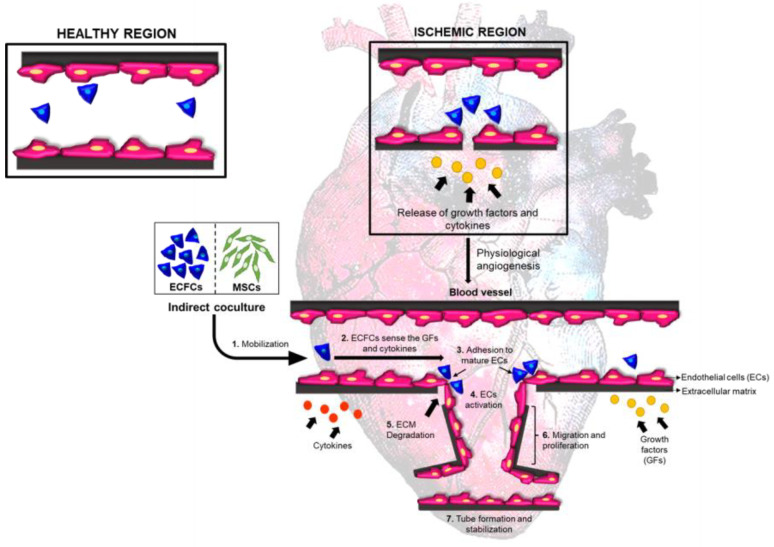
Cellular therapy has shown promise as a strategy for the functional restoration of ischemic tissues through promoting vasculogenesis. Therapy with endothelial progenitor cells (EPCs) has shown encouraging results in preclinical studies, but the limited engraftment, inefficient migration, and poor survival of patrolling endothelial progenitor cells at the injured site hinder its clinical utilization. These limitations can, to some extent, be overcome by co-culturing EPCs with mesenchymal stem cells (MSCs). Studies on the improvement in functional capacity of late EPCs, also referred to as endothelial colony-forming cells (ECFCs), when cultured with MSCs have mostly focused on the angiogenic potential, although migration, adhesion, and proliferation potential also determine effective physiological vasculogenesis. Alteration in angiogenic proteins with co-culturing has also not been studied. We co-cultured ECFCs with MSCs via both direct and indirect means, and studied the impact of the resultant contact-mediated and paracrine-mediated impact of MSCs over ECFCs, respectively, on the functional aspects and the angiogenic protein signature of ECFCs. Both directly and indirectly primed ECFCs significantly restored the adhesion and vasculogenic potential of impaired ECFCs, whereas indirectly primed ECFCs showed better proliferation and migratory potential than directly primed ECFCs. Additionally, indirectly primed ECFCs, in their angiogenesis proteomic signature, showed alleviated inflammation, along with the balanced expression of various growth factors and regulators of angiogenesis.

Keywords: bone-marrow-derived mesenchymal stem/stromal cells (BM-MSCs); co-culture; direct priming; endothelial colony-forming cells (ECFCs); functionality of ECFCs; indirect priming; proteome profiling.


Conflict of interest statement

The authors declare no conflict of interest.

Figures

Figure 1
Figure 1
The confocal microscopy images depicting the expression of progenitor and endothelial markers in cord-blood-derived endothelial colony-forming cells and uptake of AcLDL and Ulex europaeus agglutinin (UEA-1) binding: (A) expression of progenitor marker CD34 (green); (B) expression of endothelial marker KDR (red); (C) nuclear stain with DAPI (blue); (D) composite image; (E) binding to Ulex europaeus agglutinin (UEA-1); (F) uptake of Dil-Acy LDL; (G) nuclear stain with DAPI (blue); (H) composite image. All the images are at 20× magnification. Scale bar, 100 µm.
Figure 2
Figure 2
Trilineage differentiation potential of human bone-marrow-derived MSCs as described by the International Society for Cell & Gene Therapy (A) depicting adipocytes differentiated from BM-MSCs; (B) depicting osteoblasts differentiated from BM-MSCs; and (C) depicting chondrocytes differentiated from BM-MSCs. All the images are at 10× magnification. Scale bar, 100 µm.
Figure 3
Figure 3
Pocketing of CB-ECFCs by BM-MSCs during direct co-culture. Representative images of ECFCs, BM- MSCs, and ECFCs:BM-MSCs (2:1) at (AC) 0 h, (DF) 12 h, (GI) 24 h, and (JL) 48 h respectively in serum- and growth-factor-deprived conditions; asterisks (*) indicate pocketing of ECFCs surrounded by MSCs, and arrows indicate detachment of ECFCs that are not in contact with MSCs (10× magnification; scale bar, 300 µm).
Figure 4
Figure 4
(A) Brightfield microscopic image of adhered ECFCs stained with crystal violet to determine cellular adhesion (4× magnification; scale bar, 200 µm); (B) bar graph depicting mean absorbance at 590 nm, bar represents mean ± SD, n = 3, **** p ≤ 0.0001. Significance was assessed by a two-way ANOVA.
Figure 5
Figure 5
Bar graph depicting absorbance at 570 nm; bar represents mean ± SD, n = 3, * p ≤ 0.05, ** p ≤ 0.01, *** p ≤ 0.001, **** p ≤ 0.0001. Significance was assessed by a two-way ANOVA.
Figure 6
Figure 6
(A) Representative phase contrast images showing migration potential of ECFCs (10× magnification; scale bar, 100 µm); (B) bar graph depicting the mean migratory percentage during the specified time interval; bar represents mean ± SD, n = 3, ** p ≤ 0.01, **** p ≤ 0.0001. Significance was assessed by a two-way ANOVA.
Figure 7
Figure 7
(A) Phase contrast images of tubules formed by ECFCs (4× magnification; scale bar, 200 µm); (B) bar graph depicting the mean number of nodes ± SD, mean number of junctions ± SD, mean number of segments ± SD, mean total length of tubules ± SD, and the mean branching length of capillaries ± SD, n = 3, * p ≤ 0.05, ** p ≤ 0.01, *** p ≤ 0.001, **** p ≤ 0.0001. Significance was assessed by a two-way ANOVA.
Figure 8
Figure 8
Bar graphs depicting relative expression of various (A(ai)) growth factors, (B(al)) regulatory proteins, (C(ae)) cytokines, (D(ad)) MMP inhibitors, and ECM-degradation-related proteins, in BM-MSCs and CB-ECFCs; bar represents mean ± SD, n = 2, * p ≤ 0.05, ** p ≤ 0.01, *** p ≤ 0.001, **** p ≤ 0.0001. Significance was assessed by Student’s t-test.
Figure 8
Figure 8
Bar graphs depicting relative expression of various (A(ai)) growth factors, (B(al)) regulatory proteins, (C(ae)) cytokines, (D(ad)) MMP inhibitors, and ECM-degradation-related proteins, in BM-MSCs and CB-ECFCs; bar represents mean ± SD, n = 2, * p ≤ 0.05, ** p ≤ 0.01, *** p ≤ 0.001, **** p ≤ 0.0001. Significance was assessed by Student’s t-test.
Figure 9
Figure 9
Representative images of angiogenesis array membranes of various groups depicting relative expression of various proteins: (A) healthy CB-ECFC (CM); (B) impaired CB-ECFC (IM); (C) directly primed ECFC (DP-ECFC (IM)); (D) indirectly primed ECFC (IDP-ECFC (IM)).
Figure 10
Figure 10
Bar graphs depicting relative expression of various (A(ak))regulatory proteins, (B(ad)) ECM degradation proteins and MMP inhibitors, (C(ac)) cytokines, (D) endothelial dysfunction, and (E(ad)) growth factors; bar represents mean ± SD, n = 3, * p ≤ 0.05, ** p ≤ 0.01, *** p ≤ 0.001, **** p ≤ 0.0001. Significance was assessed by a two-way ANOVA.
Figure 10
Figure 10
Bar graphs depicting relative expression of various (A(ak))regulatory proteins, (B(ad)) ECM degradation proteins and MMP inhibitors, (C(ac)) cytokines, (D) endothelial dysfunction, and (E(ad)) growth factors; bar represents mean ± SD, n = 3, * p ≤ 0.05, ** p ≤ 0.01, *** p ≤ 0.001, **** p ≤ 0.0001. Significance was assessed by a two-way ANOVA.
Figure 11
Figure 11
Bar graphs depicting relative expression of various (A(af)) pro-angiogenic proteins, (B(ac)) anti-angiogenic proteins, (C(a,b)) inflammation-related proteins, and (D(A,B)) other proteins; bar represents mean ± SD, n = 3, *p ≤ 0.05, **p ≤ 0.01, ***p ≤ 0.001, ****p ≤ 0.0001. Significance was assessed by a two-way ANOVA.
Figure 11
Figure 11
Bar graphs depicting relative expression of various (A(af)) pro-angiogenic proteins, (B(ac)) anti-angiogenic proteins, (C(a,b)) inflammation-related proteins, and (D(A,B)) other proteins; bar represents mean ± SD, n = 3, *p ≤ 0.05, **p ≤ 0.01, ***p ≤ 0.001, ****p ≤ 0.0001. Significance was assessed by a two-way ANOVA.
Figure 12
Figure 12
Schematic diagram summarizing various events involved in the revascularization process through recruitment of ECFCs.

Similar articles

Cited by

References

    1. Contributions of Risk Factors and Medical Care to Cardiovascular Mortality Trends-PubMed. [(accessed on 30 March 2023)]; Available online: https://pubmed.ncbi.nlm.nih.gov/26076950/
    1. Roth G.A., Mensah G.A., Johnson C.O., Addolorato G., Ammirati E., Baddour L.M., Barengo N.C., Beaton A.Z., Benjamin E.J., Benziger C.P., et al. Global Burden of Cardiovascular Diseases and Risk Factors, 1990–2019: Update From the GBD 2019 Study. J. Am. Coll. Cardiol. 2020;76:2982–3021. doi: 10.1016/j.jacc.2020.11.010. - DOI - PMC - PubMed
    1. Cardiovascular Diseases (CVDs) [(accessed on 4 February 2023)]. Available online: https://www.who.int/news-room/fact-sheets/detail/cardiovascular-diseases...
    1. Deaths Due to Heart Attacks up by 53% in 5 Years: NCRB|India News-Times of India. [(accessed on 4 February 2023)]. Available online: https://timesofindia.indiatimes.com/india/deaths-due-to-heart-attacks-up....
    1. Asahara T., Murohara T., Sullivan A., Silver M., van der Zee R., Li T., Witzenbichler B., Schatteman G., Isner J.M. Isolation of Putative Progenitor Endothelial Cells for Angiogenesis. Science. 1997;275:964–967. doi: 10.1126/science.275.5302.964. - DOI - PubMed

LinkOut - more resources