Developing In Vitro Models to Define the Role of Direct Mitochondrial Toxicity in Frequently Reported Drug-Induced Rhabdomyolysis
- PMID: 37239154
- PMCID: PMC10216605
- DOI: 10.3390/biomedicines11051485
Developing In Vitro Models to Define the Role of Direct Mitochondrial Toxicity in Frequently Reported Drug-Induced Rhabdomyolysis
Abstract
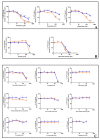
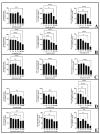
The United States Food and Drug Administration Adverse Event Reporting System (FAERS) logged 27,140 rhabdomyolysis cases from 2004 to 31 March 2020. We used FAERS to identify 14 drugs frequently reported in 6583 rhabdomyolysis cases and to investigate whether mitochondrial toxicity is a common pathway of drug-induced rhabdomyolysis by these drugs. Preliminary screening for mitochondrial toxicity was performed using the acute metabolic switch assay, which is adapted here for use in murine L6 cells. Fenofibrate, risperidone, pregabalin, propofol, and simvastatin lactone drugs were identified as mitotoxic and underwent further investigation, using real-time respirometry (Seahorse Technology) to provide more detail on the mechanism of mitochondrial-induced toxicity. To confirm the human relevance of the findings, fenofibrate and risperidone were evaluated in primary human skeletal muscle-derived cells (HSKMDC), using the acute metabolic switch assay and real-time respirometry, which confirmed this designation, although the toxic effects on the mitochondria were more pronounced in HSKMDC. Overall, these studies demonstrate that the L6 model of acute modification may find utility as an initial, cost-effective screen for identifying potential myotoxicants with relevance to humans and, importantly, that drug-induced mitochondrial dysfunction may be a common mechanism shared by some drugs that induce myotoxicity.
Keywords: FAERS; HSKMDC; L6; mitochondrial dysfunction; skeletal muscle toxicity; suspect drug-induced rhabdomyolysis.
Conflict of interest statement
The authors have no conflict of interest to declare.
Figures


Similar articles
-
Combination treatment with statins and bezafibrate induces myotoxicity via inhibition of geranylgeranyl pyrophosphate biosynthesis and Rho activation in L6 myoblasts and myotube cells.J Physiol Pharmacol. 2022 Feb;73(1). doi: 10.26402/jpp.2022.1.14. Epub 2022 Jul 4. J Physiol Pharmacol. 2022. PMID: 35793766
-
Association between proton pump inhibitors and rhabdomyolysis risk: a post-marketing surveillance using FDA adverse event reporting system (FAERS) database.Ther Adv Drug Saf. 2023 Feb 27;14:20420986231154075. doi: 10.1177/20420986231154075. eCollection 2023. Ther Adv Drug Saf. 2023. PMID: 36875514 Free PMC article.
-
Hepatotoxicity reports in the FDA adverse event reporting system database: A comparison of drugs that cause injury via mitochondrial or other mechanisms.Acta Pharm Sin B. 2021 Dec;11(12):3857-3868. doi: 10.1016/j.apsb.2021.05.028. Epub 2021 Jun 7. Acta Pharm Sin B. 2021. PMID: 35024312 Free PMC article.
-
FDA adverse event reports on statin-associated rhabdomyolysis.Ann Pharmacother. 2002 Feb;36(2):288-95. doi: 10.1345/aph.1A289. Ann Pharmacother. 2002. PMID: 11847951 Review.
-
Statin-induced rhabdomyolysis.J Emerg Med. 2006 Aug;31(2):177-80. doi: 10.1016/j.jemermed.2005.08.020. J Emerg Med. 2006. PMID: 17044581 Review.
Cited by
-
Mitochondrial myopathy without extraocular muscle involvement: a unique clinicopathologic profile.J Neurol. 2024 Feb;271(2):864-876. doi: 10.1007/s00415-023-12005-5. Epub 2023 Oct 17. J Neurol. 2024. PMID: 37847292
-
Pregabalin-induced rhabdomyolysis: a case series and literature analysis.J Int Med Res. 2024 Jun;52(6):3000605241257776. doi: 10.1177/03000605241257776. J Int Med Res. 2024. PMID: 38879799 Free PMC article. Review.
-
Risk of Rhabdomyolysis Associated with Dexmedetomidine Use over the Past 10 Years: Insights from the EudraVigilance Database.J Pers Med. 2024 Sep 10;14(9):961. doi: 10.3390/jpm14090961. J Pers Med. 2024. PMID: 39338215 Free PMC article.
References
Grants and funding
LinkOut - more resources
Full Text Sources

