. 2023 May 16;20(10):5830.
doi: 10.3390/ijerph20105830.

Exploring the Spatial Relative Risk of COVID-19 in Berlin-Neukölln

Affiliations

Exploring the Spatial Relative Risk of COVID-19 in Berlin-Neukölln

Christoph Lambio et al. Int J Environ Res Public Health. .

Abstract

Identifying areas with high and low infection rates can provide important etiological clues. Usually, areas with high and low infection rates are identified by aggregating epidemiological data into geographical units, such as administrative areas. This assumes that the distribution of population numbers, infection rates, and resulting risks is constant across space. This assumption is, however, often false and is commonly known as the modifiable area unit problem. This article develops a spatial relative risk surface by using kernel density estimation to identify statistically significant areas of high risk by comparing the spatial distribution of address-level COVID-19 cases and the underlying population at risk in Berlin-Neukölln. Our findings show that there are varying areas of statistically significant high and low risk that straddle administrative boundaries. The findings of this exploratory analysis further highlight topics such as, e.g., Why were mostly affluent areas affected during the first wave? What lessons can be learned from areas with low infection rates? How important are built structures as drivers of COVID-19? How large is the effect of the socio-economic situation on COVID-19 infections? We conclude that it is of great importance to provide access to and analyse fine-resolution data to be able to understand the spread of the disease and address tailored health measures in urban settings.

Keywords: COVID-19; infectious disease; kernel density; modifiable areal unit problem; point data; spatial relative risk.


Conflict of interest statement

The authors declare no conflict of interest.

Figures

Figure 1
Figure 1
The inset map depicts Berlin and its 12 districts, with Berlin-Neukölln highlighted. (a) The five local districts of Berlin-Neukölln and the planning units [40], (b) population density of Berlin-Neukölln [41], (c) built structure of Berlin-Neukölln [38], and (d) socio-economic situation [39]; CRS: 25833.
Figure 1
Figure 1
The inset map depicts Berlin and its 12 districts, with Berlin-Neukölln highlighted. (a) The five local districts of Berlin-Neukölln and the planning units [40], (b) population density of Berlin-Neukölln [41], (c) built structure of Berlin-Neukölln [38], and (d) socio-economic situation [39]; CRS: 25833.
Figure 2
Figure 2
Blocks with their population densities. The points in the block represent the corresponding inhabitants—one for each person living in that block. Please note that even though it looks like one COVID-19 case, there could be five, ten, or fifteen positive COVID-19 cases behind each star. This is because each star represents the (here, pseudo) residential address of a COVID-19 case. If there are several people in the same residential building, they all have the same address, resulting in the same coordinates. Data source: Stadt-Berlin [41]; CRS: 25833.
Figure 3
Figure 3
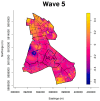
Asymmetric adaptive kernel log-relative risk surface for Berlin-Neukölln with asymptotic p-value surfaces at the 0.01 (solid line) and 0.001 (dashed line) significance levels. Yellow lines: Areas of statistically significant high risk; Blue lines: Areas of statistically significant low risk. Scale: log2n.
Figure 4
Figure 4
Asymmetric adaptive kernel log-relative risk surface for Berlin-Neukölln with asymptotic p-value surfaces at the 0.01 (solid line) and 0.001 (dashed line) significance levels. Yellow lines: Areas of statistically significant high risk; Blue lines: Areas of statistically significant low risk. Scale: log2n.
Figure 5
Figure 5
Asymmetric adaptive kernel log-relative risk surface for Berlin-Neukölln with asymptotic p-value surfaces at the 0.01 (solid line) and 0.001 (dashed line) significance levels. Yellow lines: Areas of statistically significant high risk; Blue lines: Areas of statistically significant low risk. Scale: log2n.
Figure 6
Figure 6
Asymmetric adaptive kernel log-relative risk surface for Berlin-Neukölln with asymptotic p-value surfaces at the 0.01 (solid line) and 0.001 (dashed line) significance levels. Yellow lines: Areas of statistically significant high risk; Blue lines: Areas of statistically significant low risk. Scale: log2n.
Figure 7
Figure 7
Incidence (cases per 100,000) in the local districts. The dashed lines indicate the waves as defined in Table 3.

Similar articles

Cited by

References

    1. WHO WHO Director-General’s Opening Remarks at the Media Briefing on COVID-19. 2020. [(accessed on 11 March 2020)]. Available online: https://www.who.int/director-general/speeches/detail/who-director-genera....
    1. RKI Epidemiologisches 2022 Bulletin—Aktualisierte Phaseneinteilung der COVID-19-Pandemie (10/2022) 2022. [(accessed on 21 March 2022)]. Available online: https://www.rki.de/DE/Content/Infekt/EpidBull/Archiv/2022/Ausgaben/10_22....
    1. Franch-Pardo I., Napoletano B.M., Rosete-Verges F., Billa L. Spatial analysis and GIS in the study of COVID-19. A review. Sci. Total Environ. 2020;739:140033. doi: 10.1016/j.scitotenv.2020.140033. - DOI - PMC - PubMed
    1. Rezaei M., Nouri A.A., Park G.S., Kim D.H. Application of Geographic Information System in Monitoring and Detecting the COVID-19 Outbreak. Iran. J. Public Health. 2020;49((Suppl. 1)):114–116. doi: 10.18502/ijph.v49iS1.3679. - DOI - PMC - PubMed
    1. Rossman H., Keshet A., Shilo S., Gavrieli A., Bauman T., Cohen O., Shelly E., Balicer R., Geiger B., Dor Y., et al. A framework for identifying regional outbreak and spread of COVID-19 from one-minute population-wide surveys. Nat. Med. 2020;26:634–638. doi: 10.1038/s41591-020-0857-9. - DOI - PMC - PubMed

Publication types